. 2018 Feb;67(2):193-207.
doi: 10.2337/db17-0223. Epub 2017 Oct 26.

S-Nitrosoglutathione Reductase Dysfunction Contributes to Obesity-Associated Hepatic Insulin Resistance via Regulating Autophagy

Affiliations

S-Nitrosoglutathione Reductase Dysfunction Contributes to Obesity-Associated Hepatic Insulin Resistance via Regulating Autophagy

Qingwen Qian et al. Diabetes. 2018 Feb.

Abstract

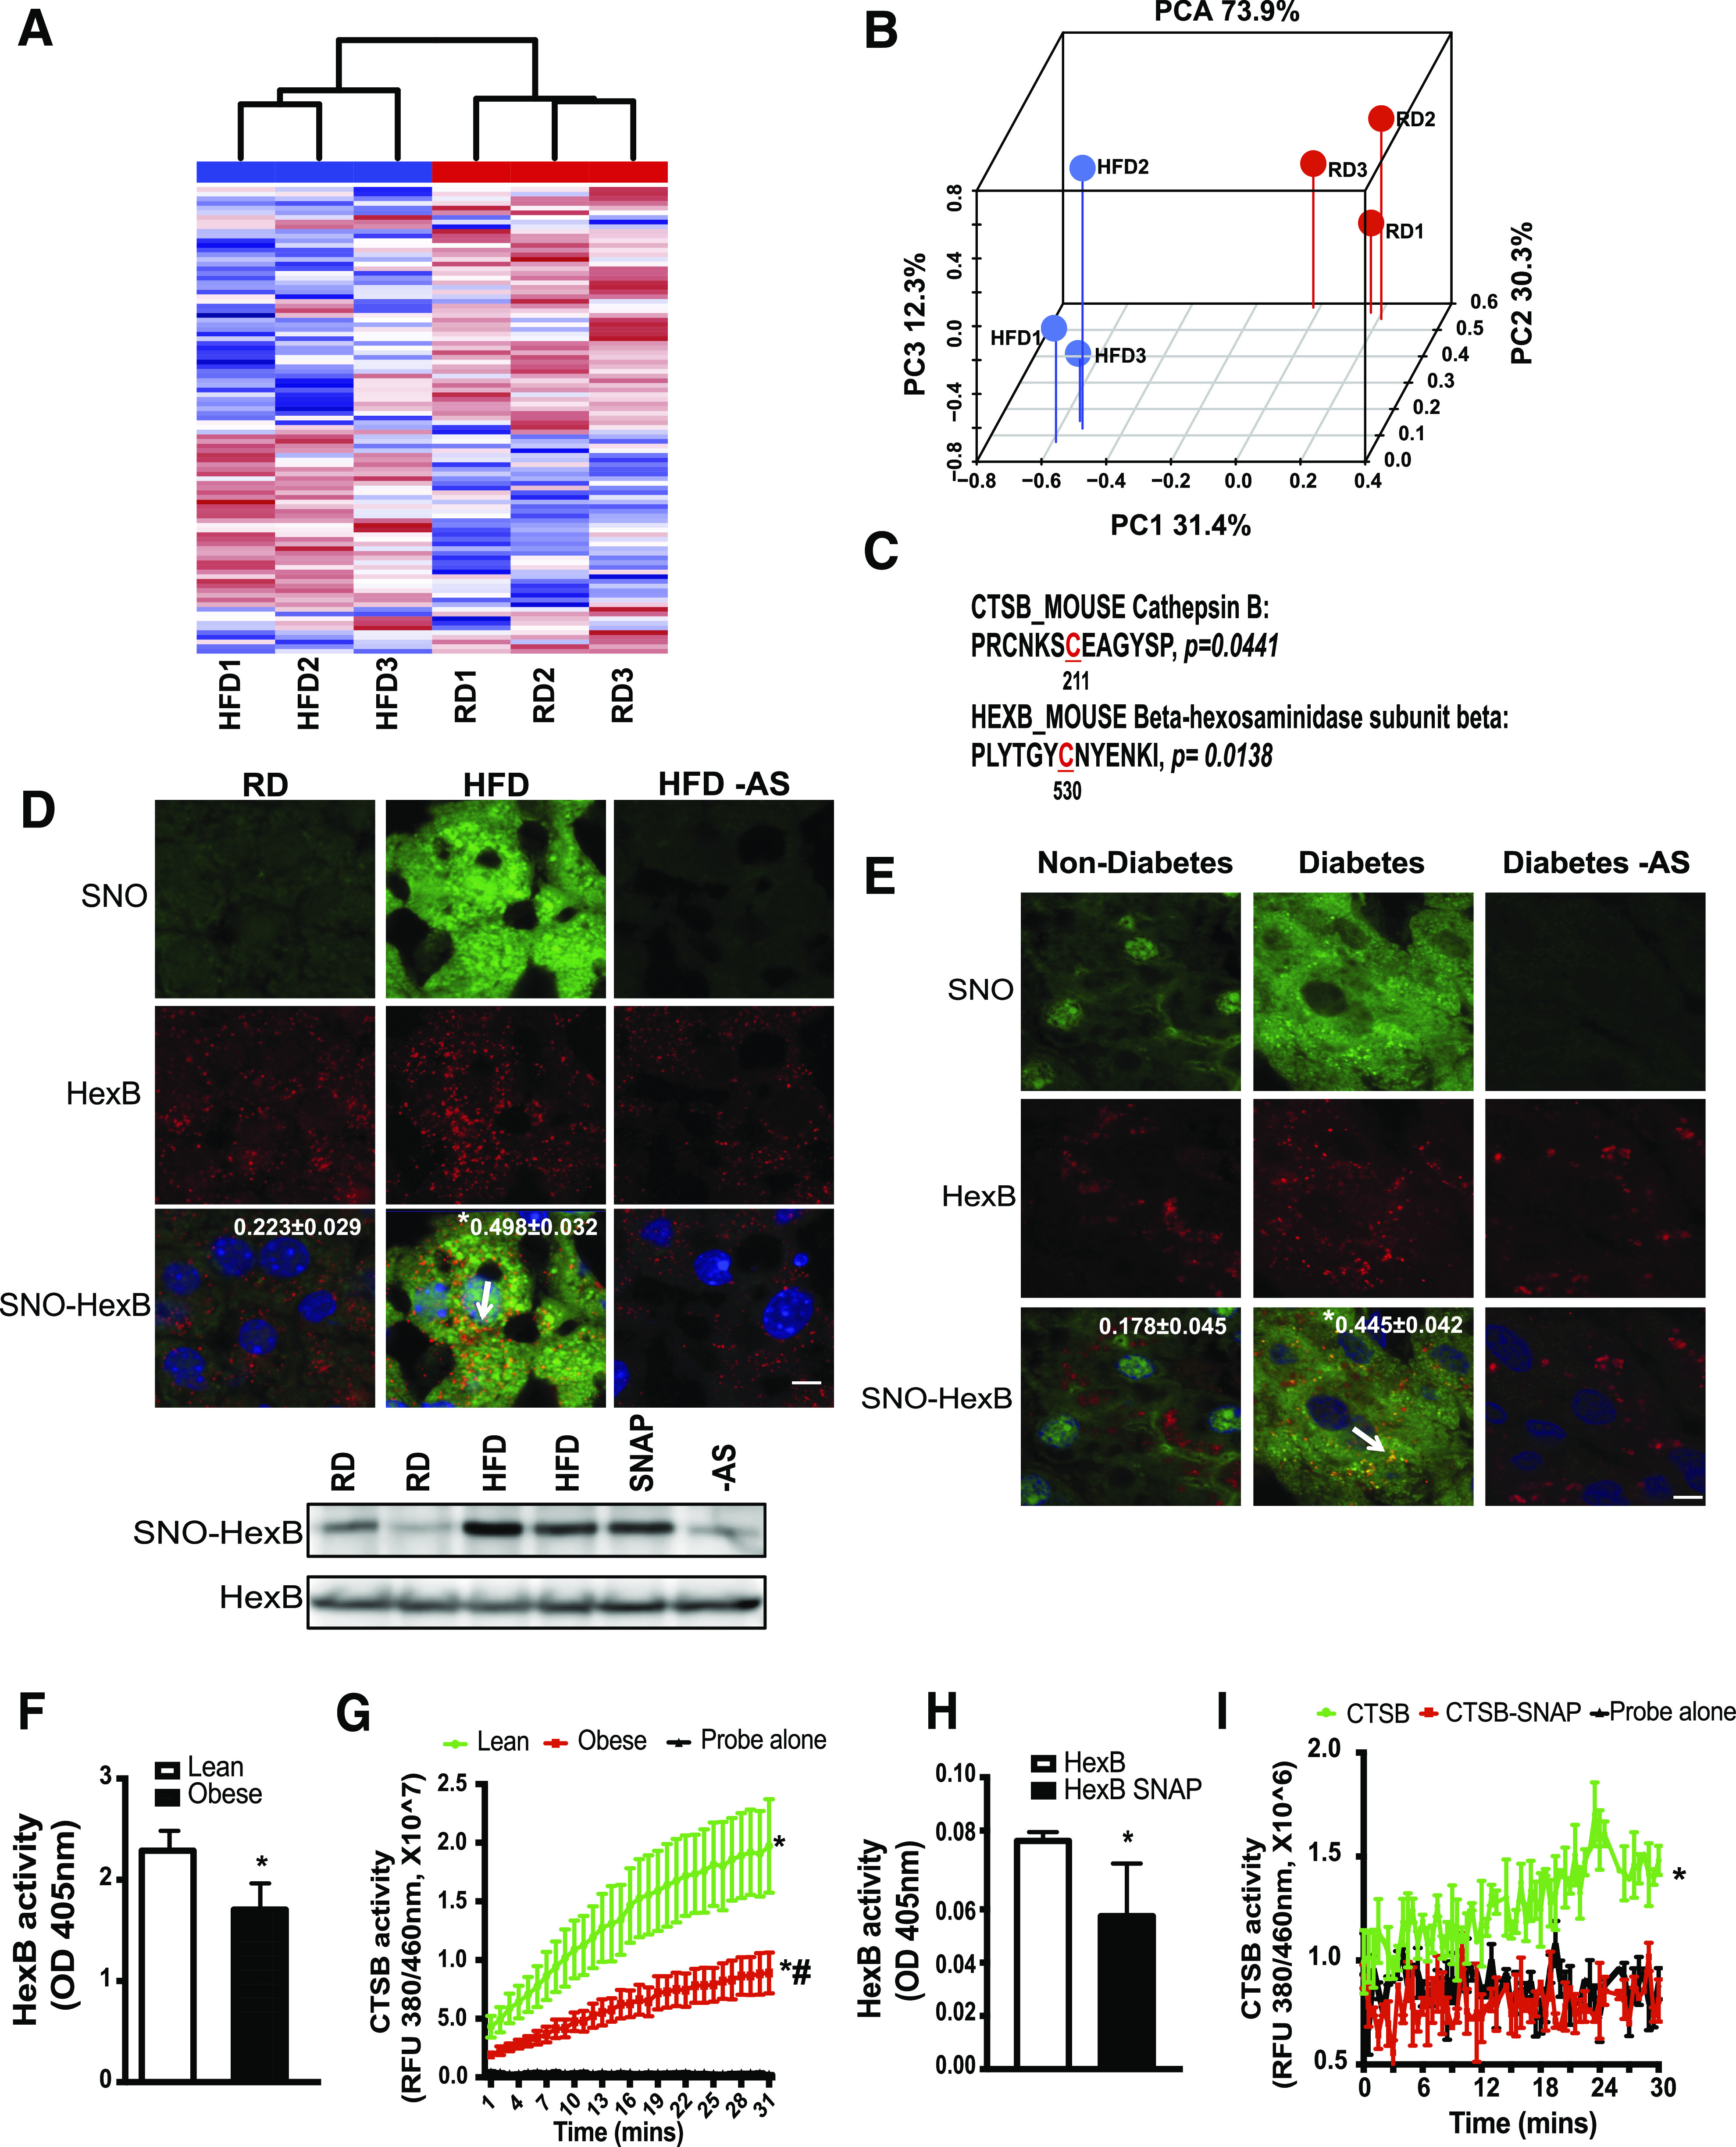
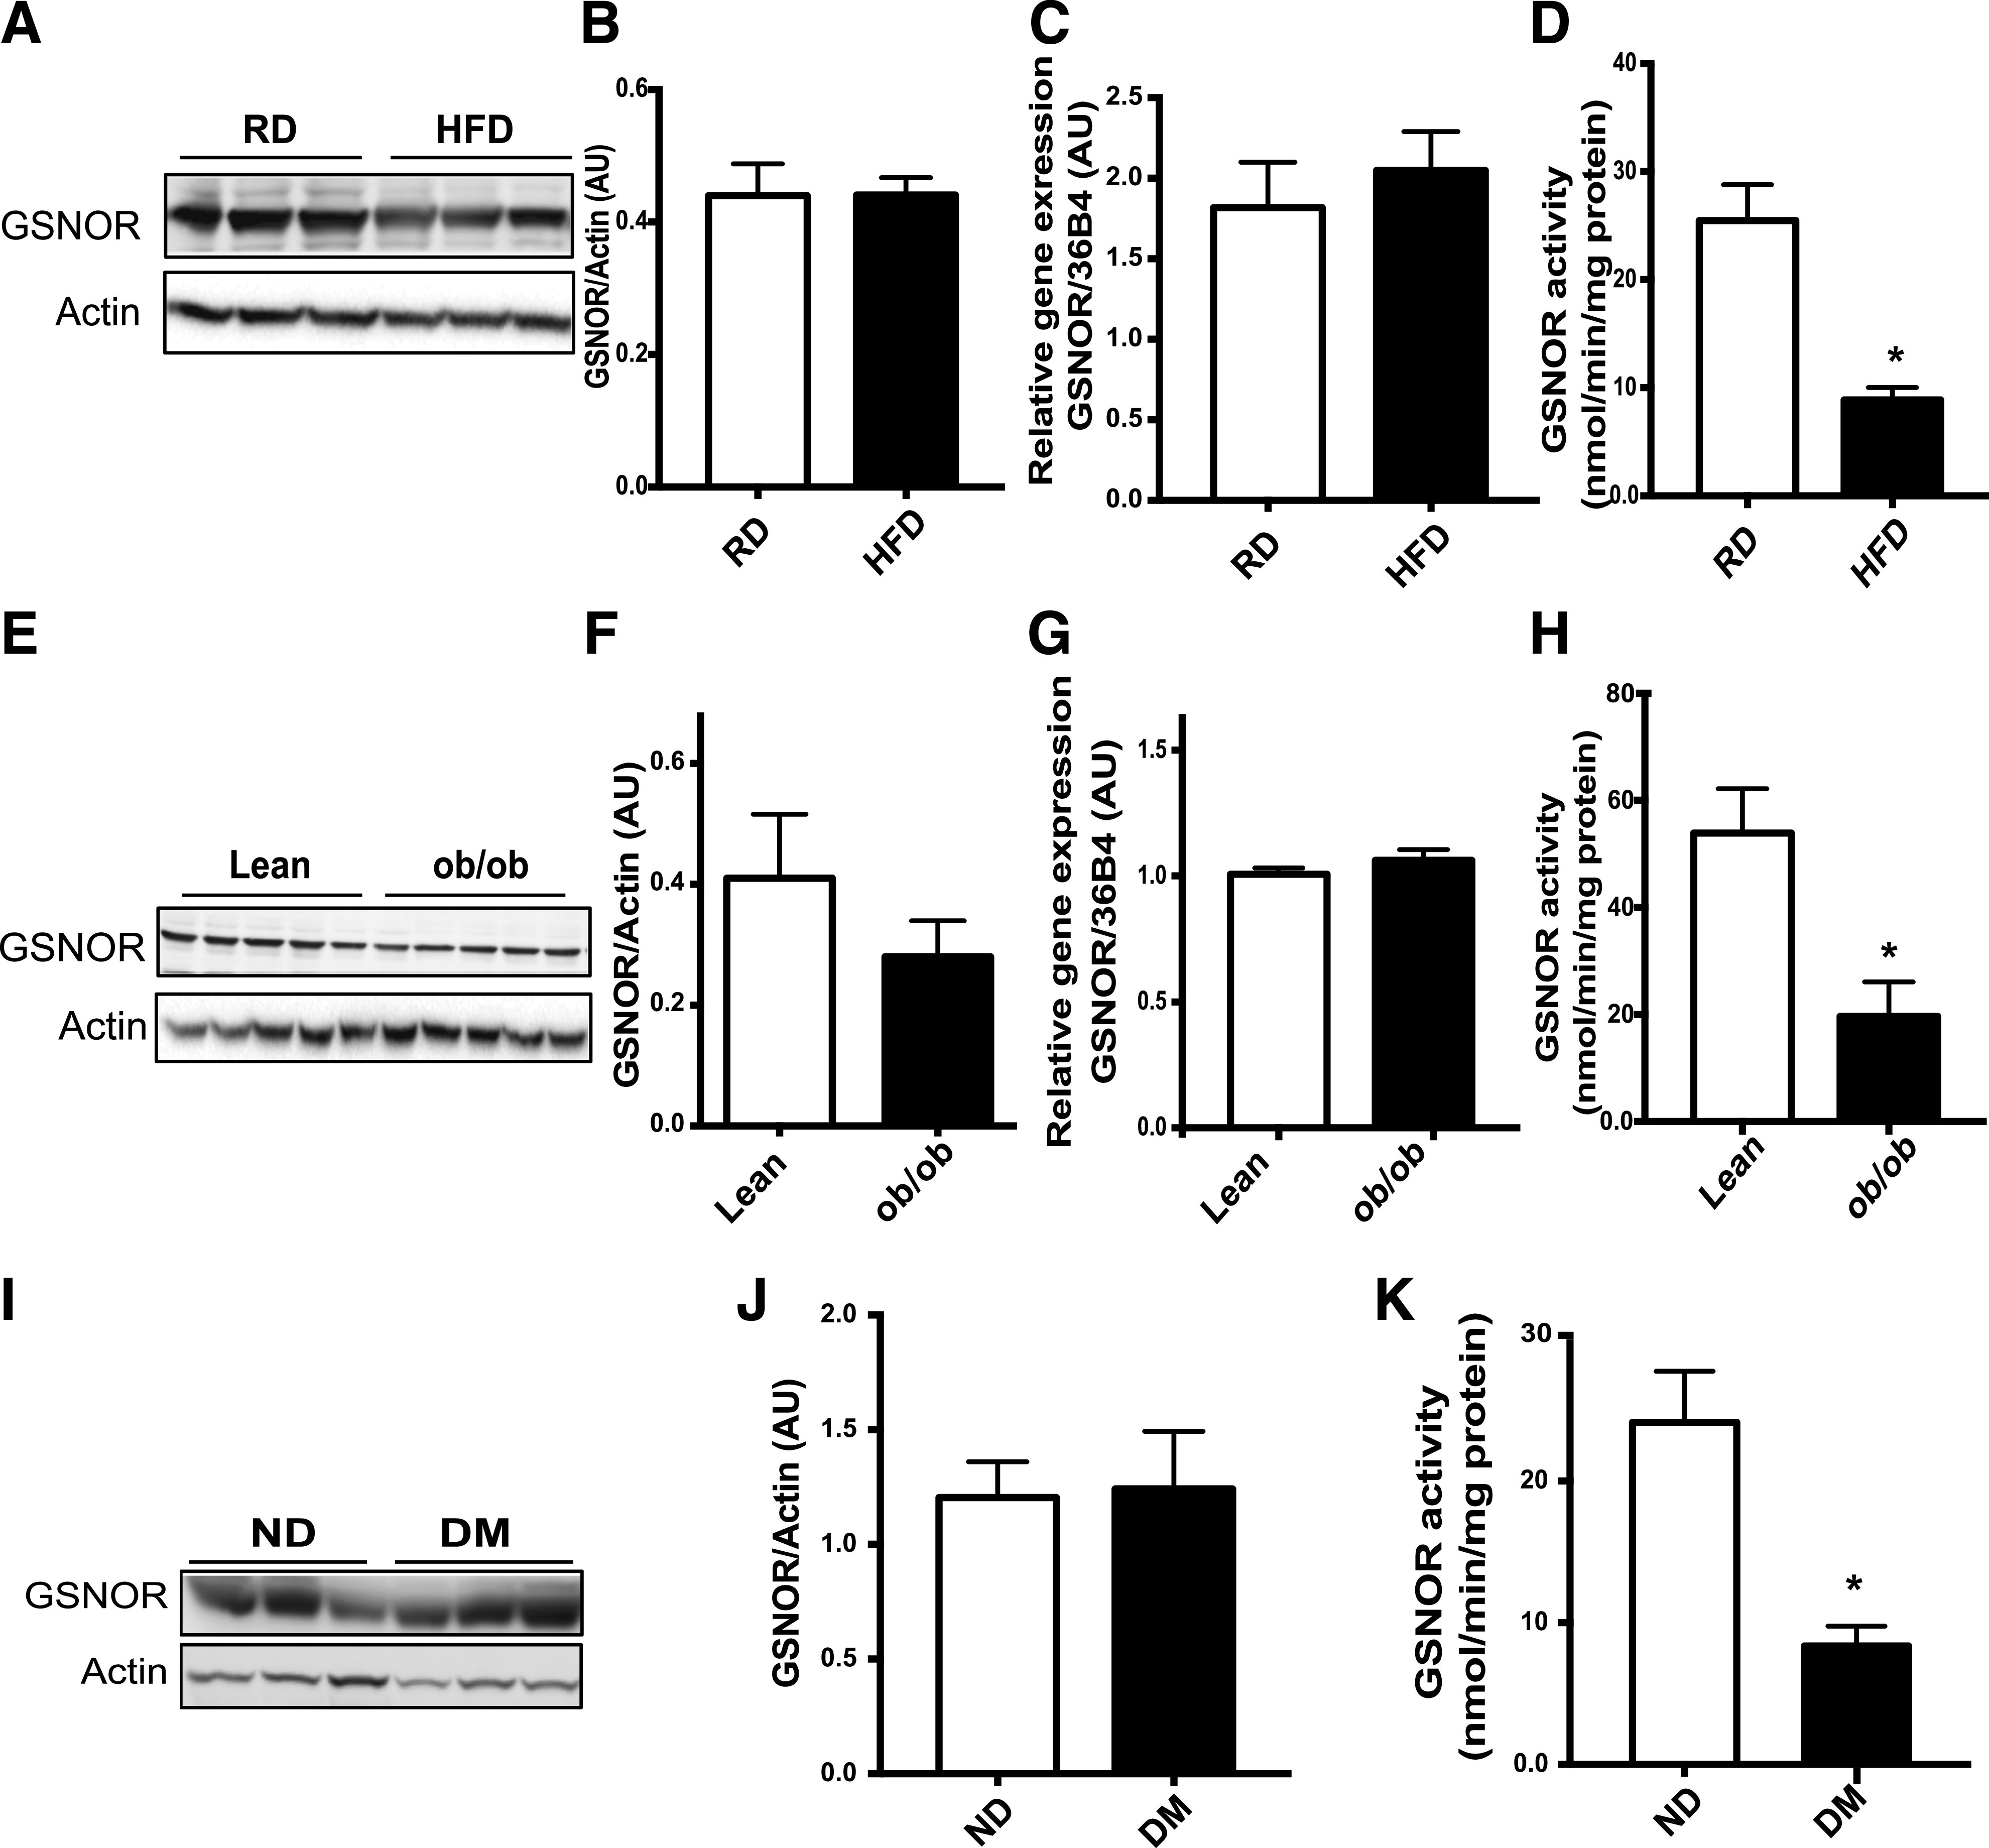
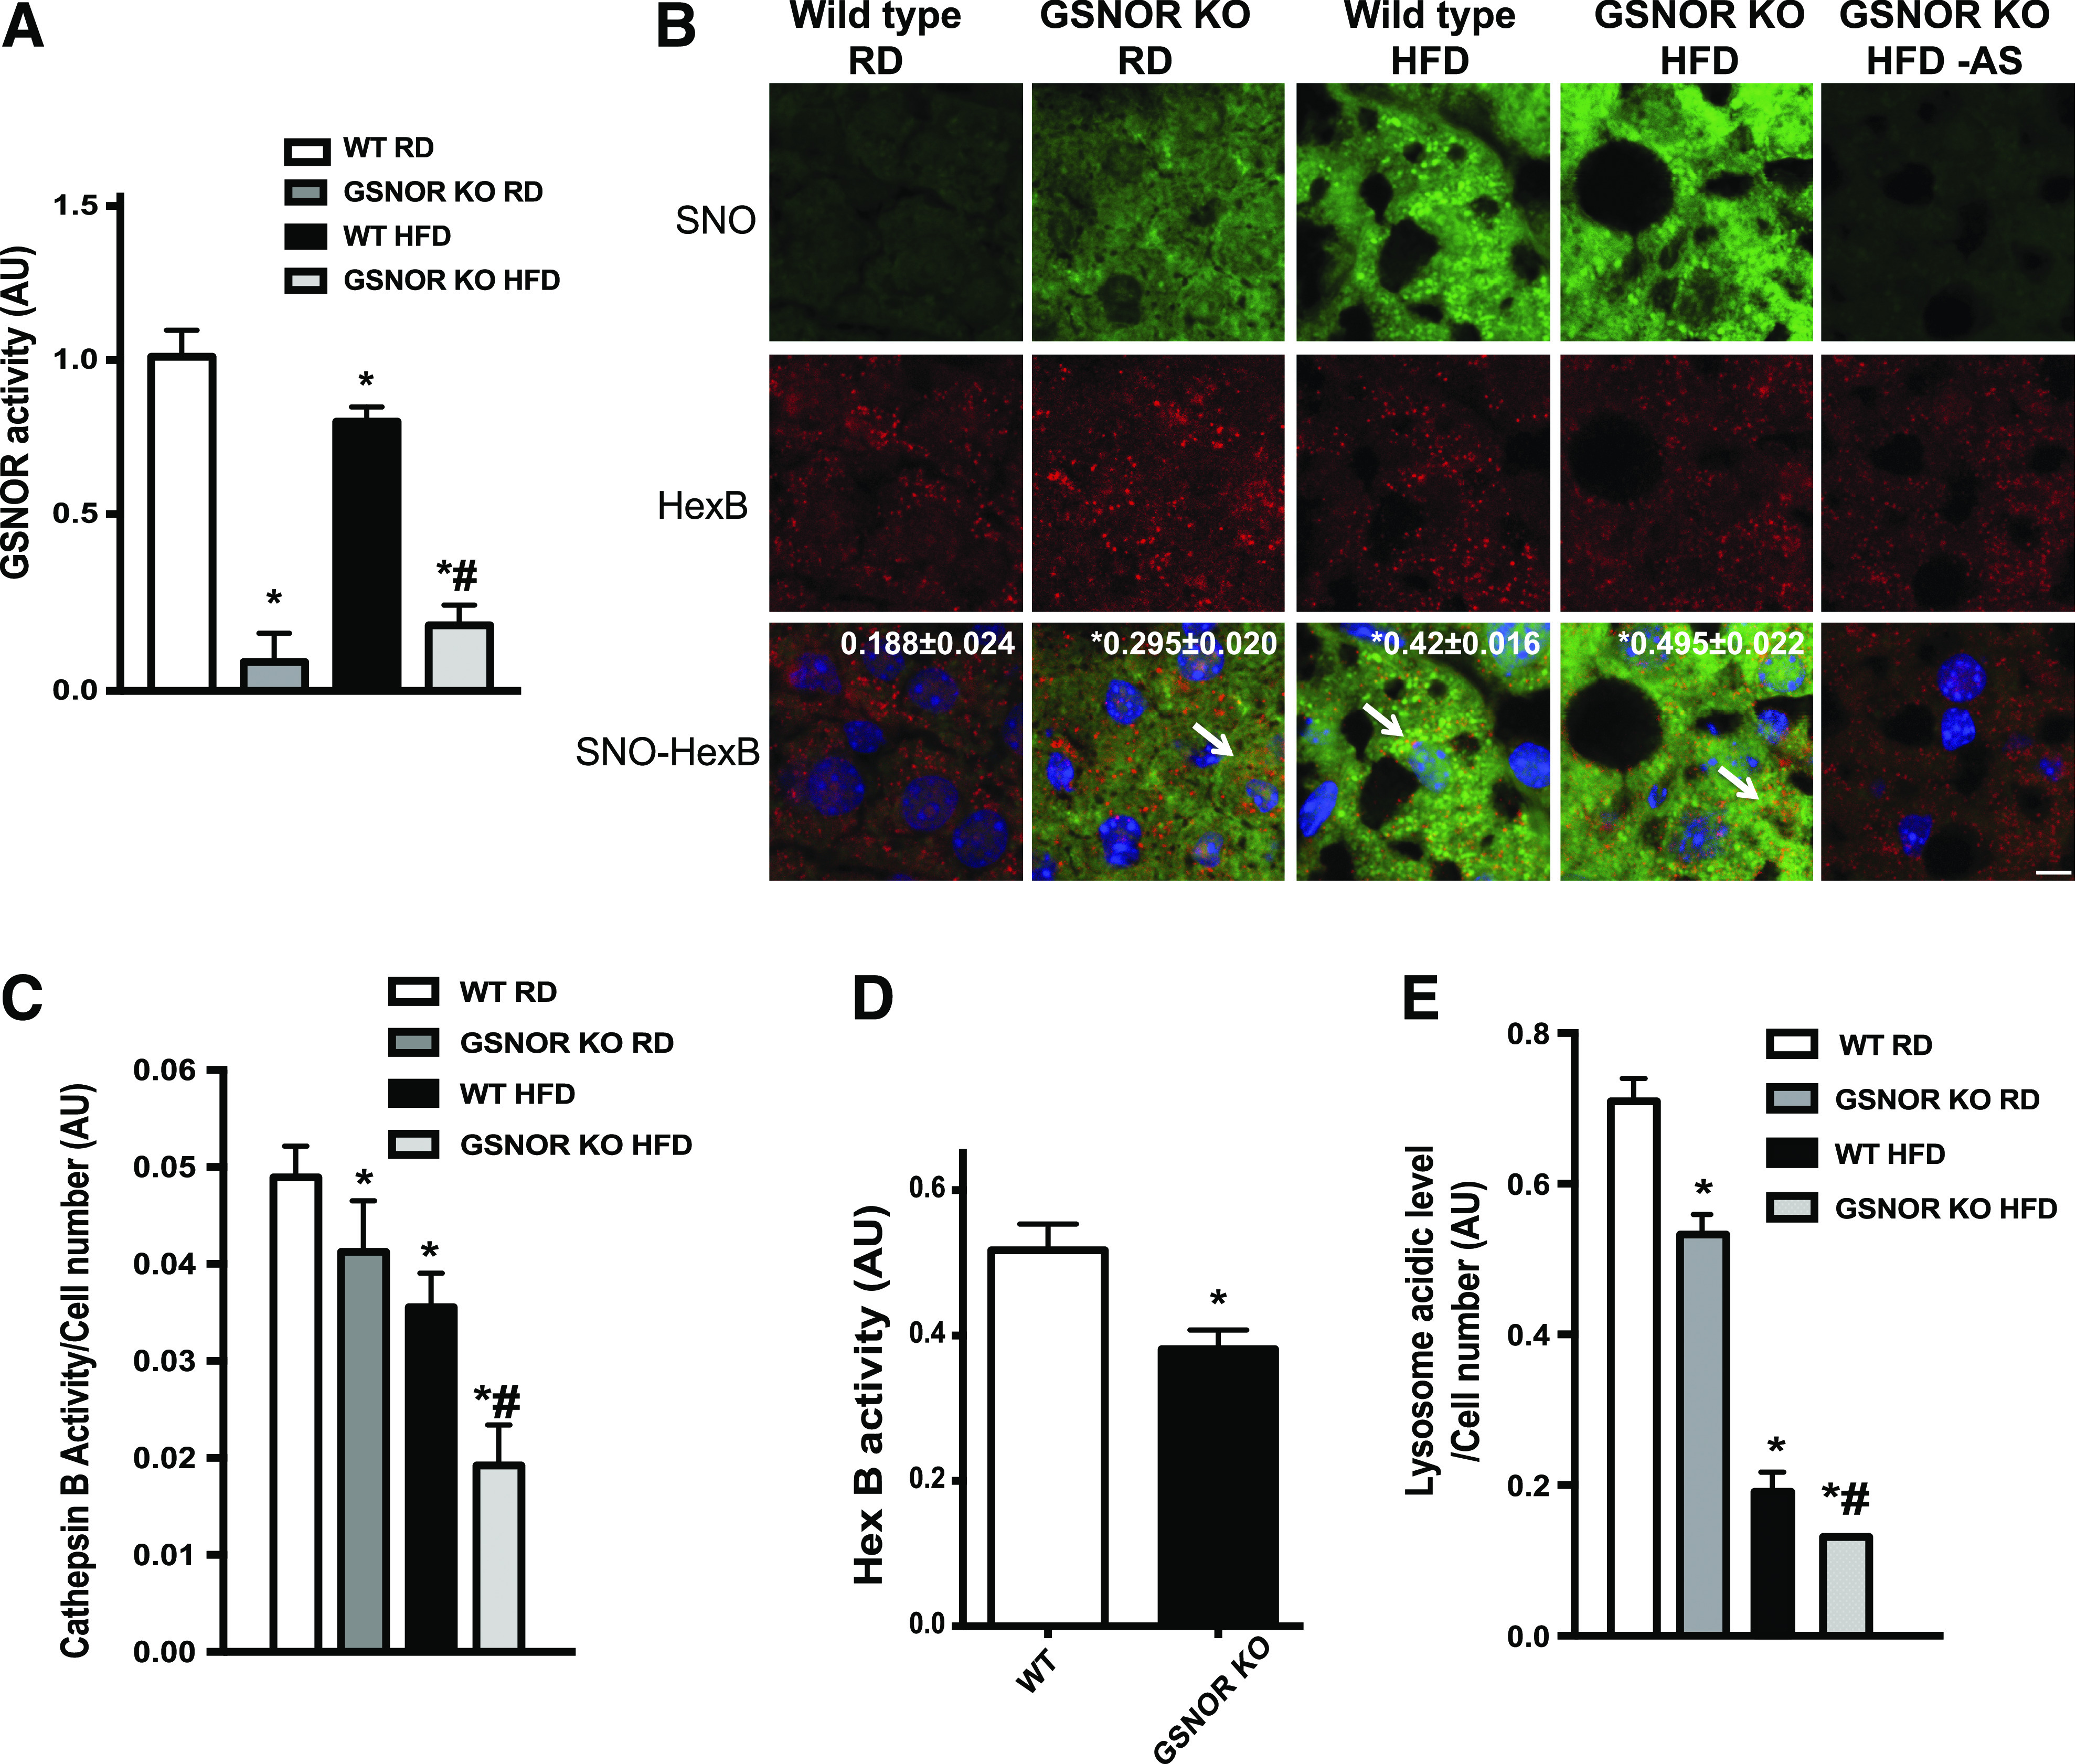
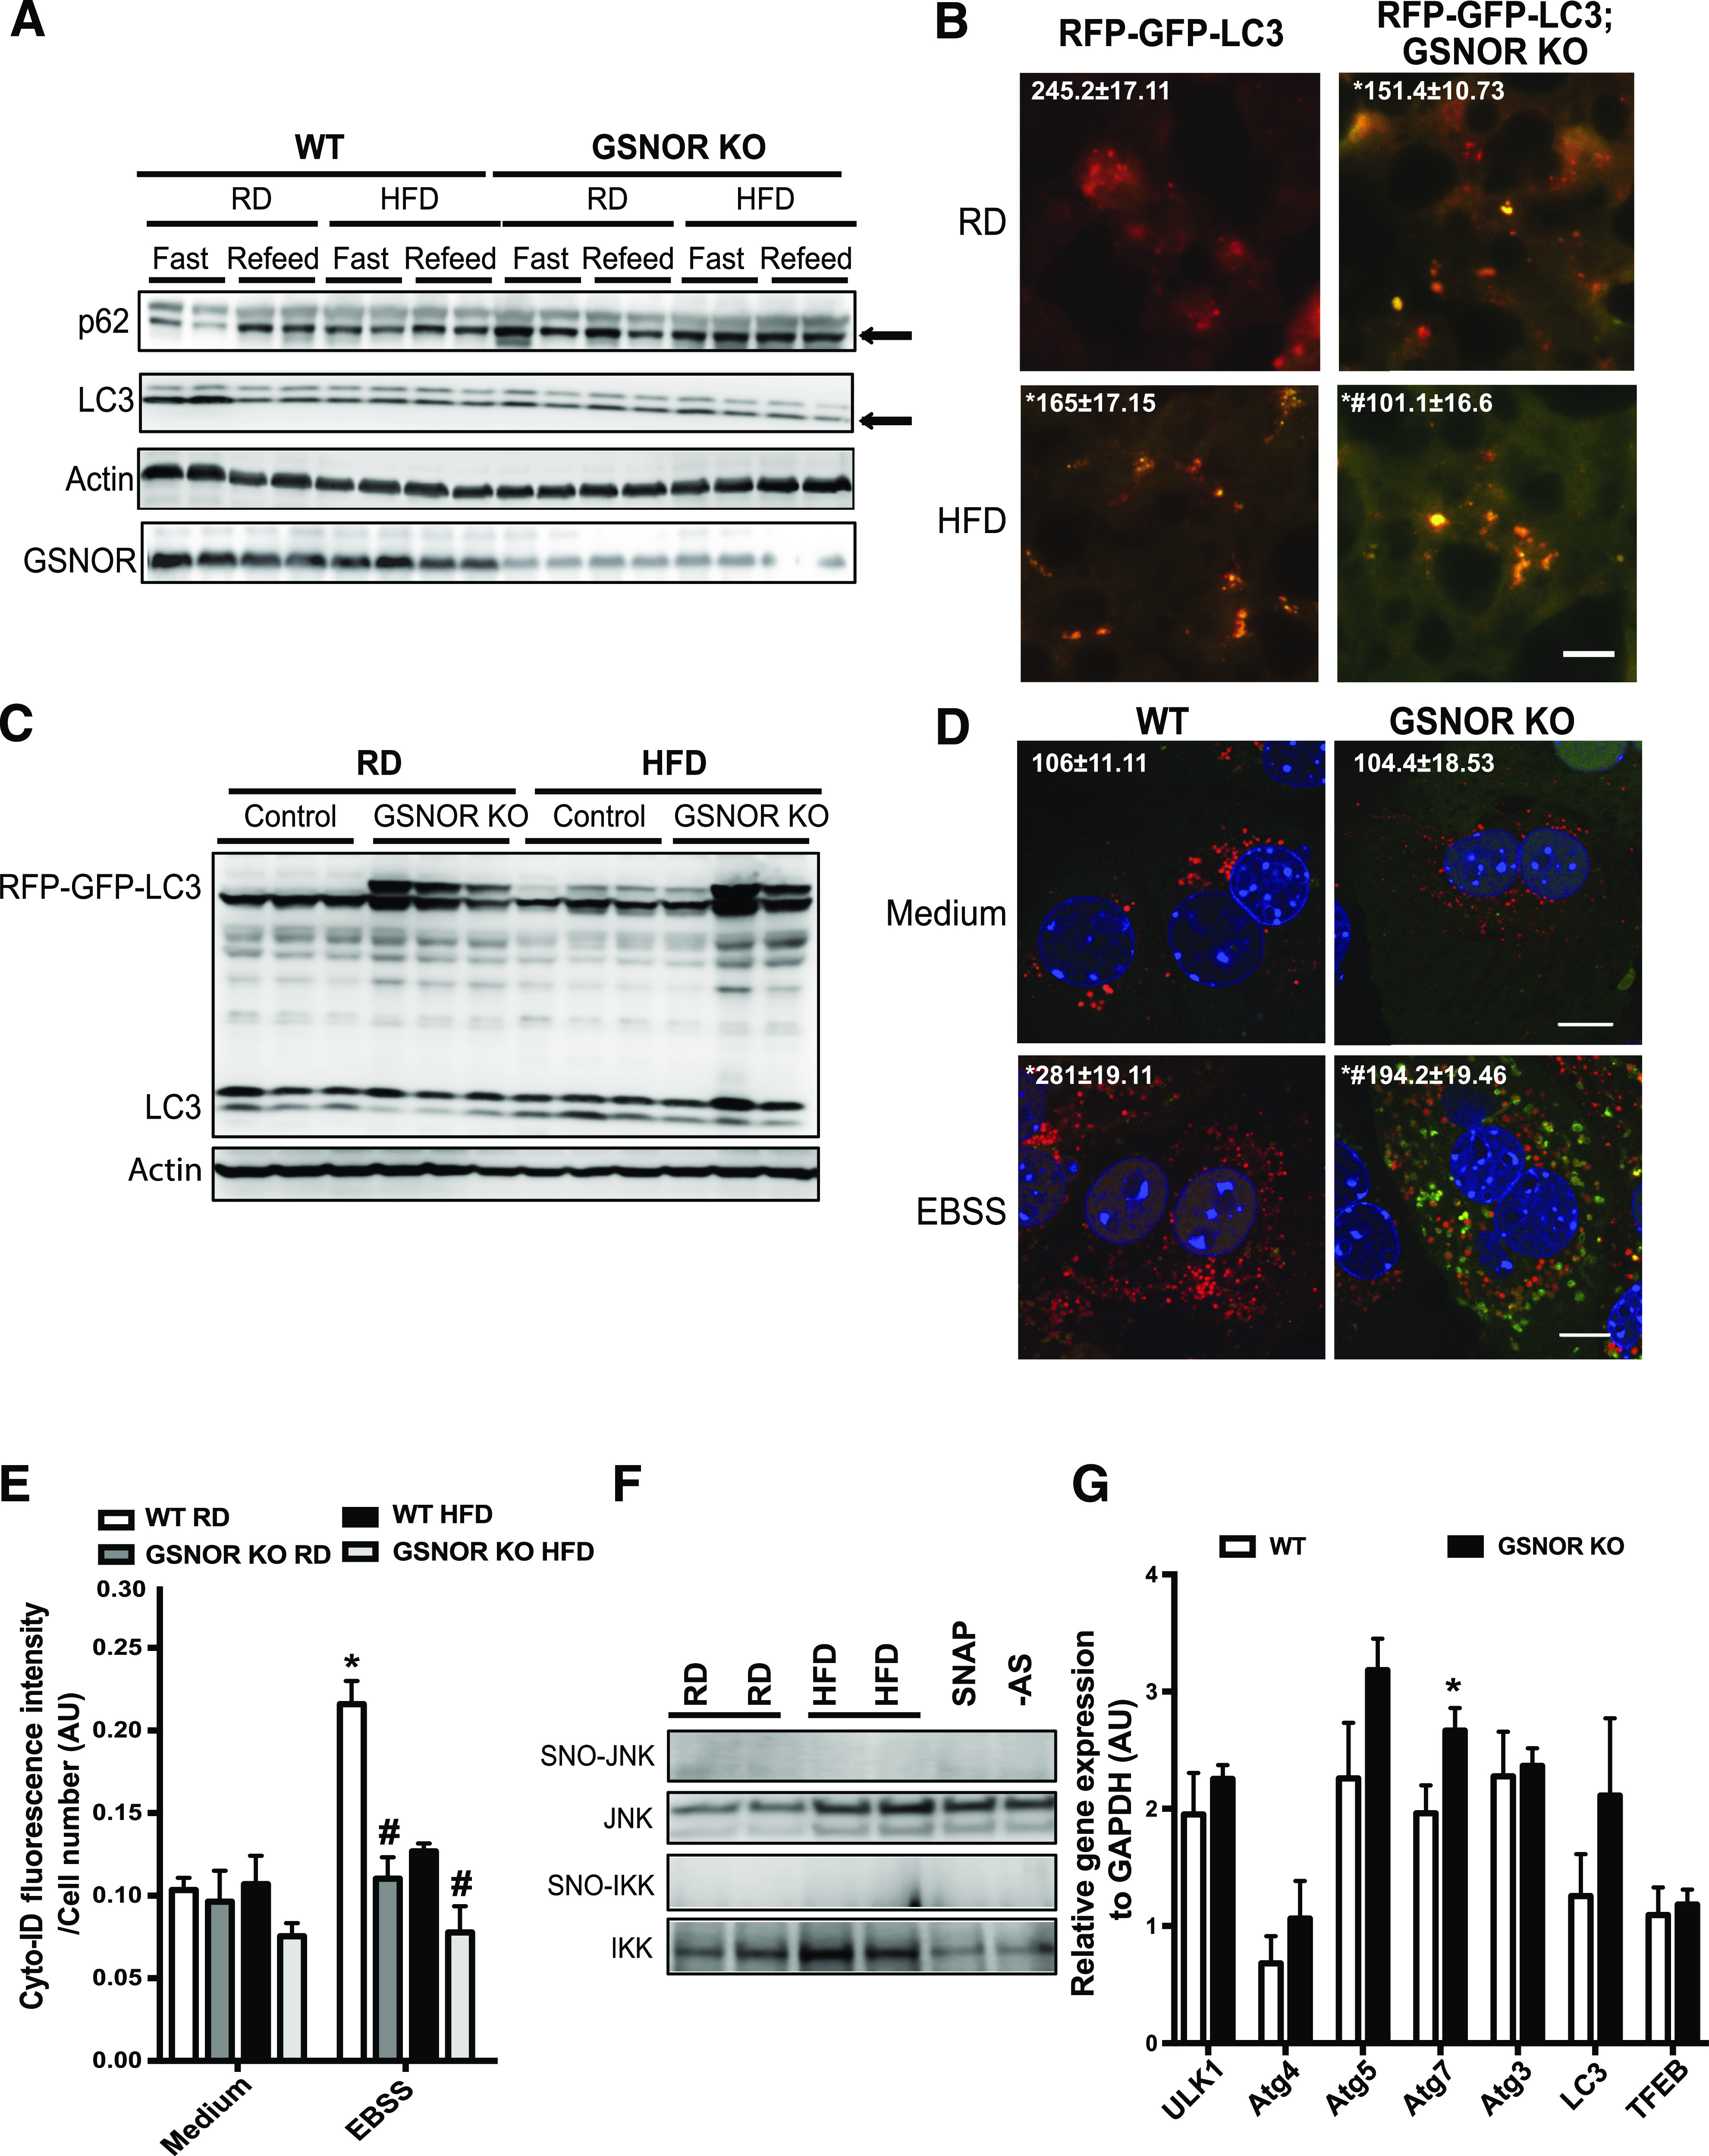
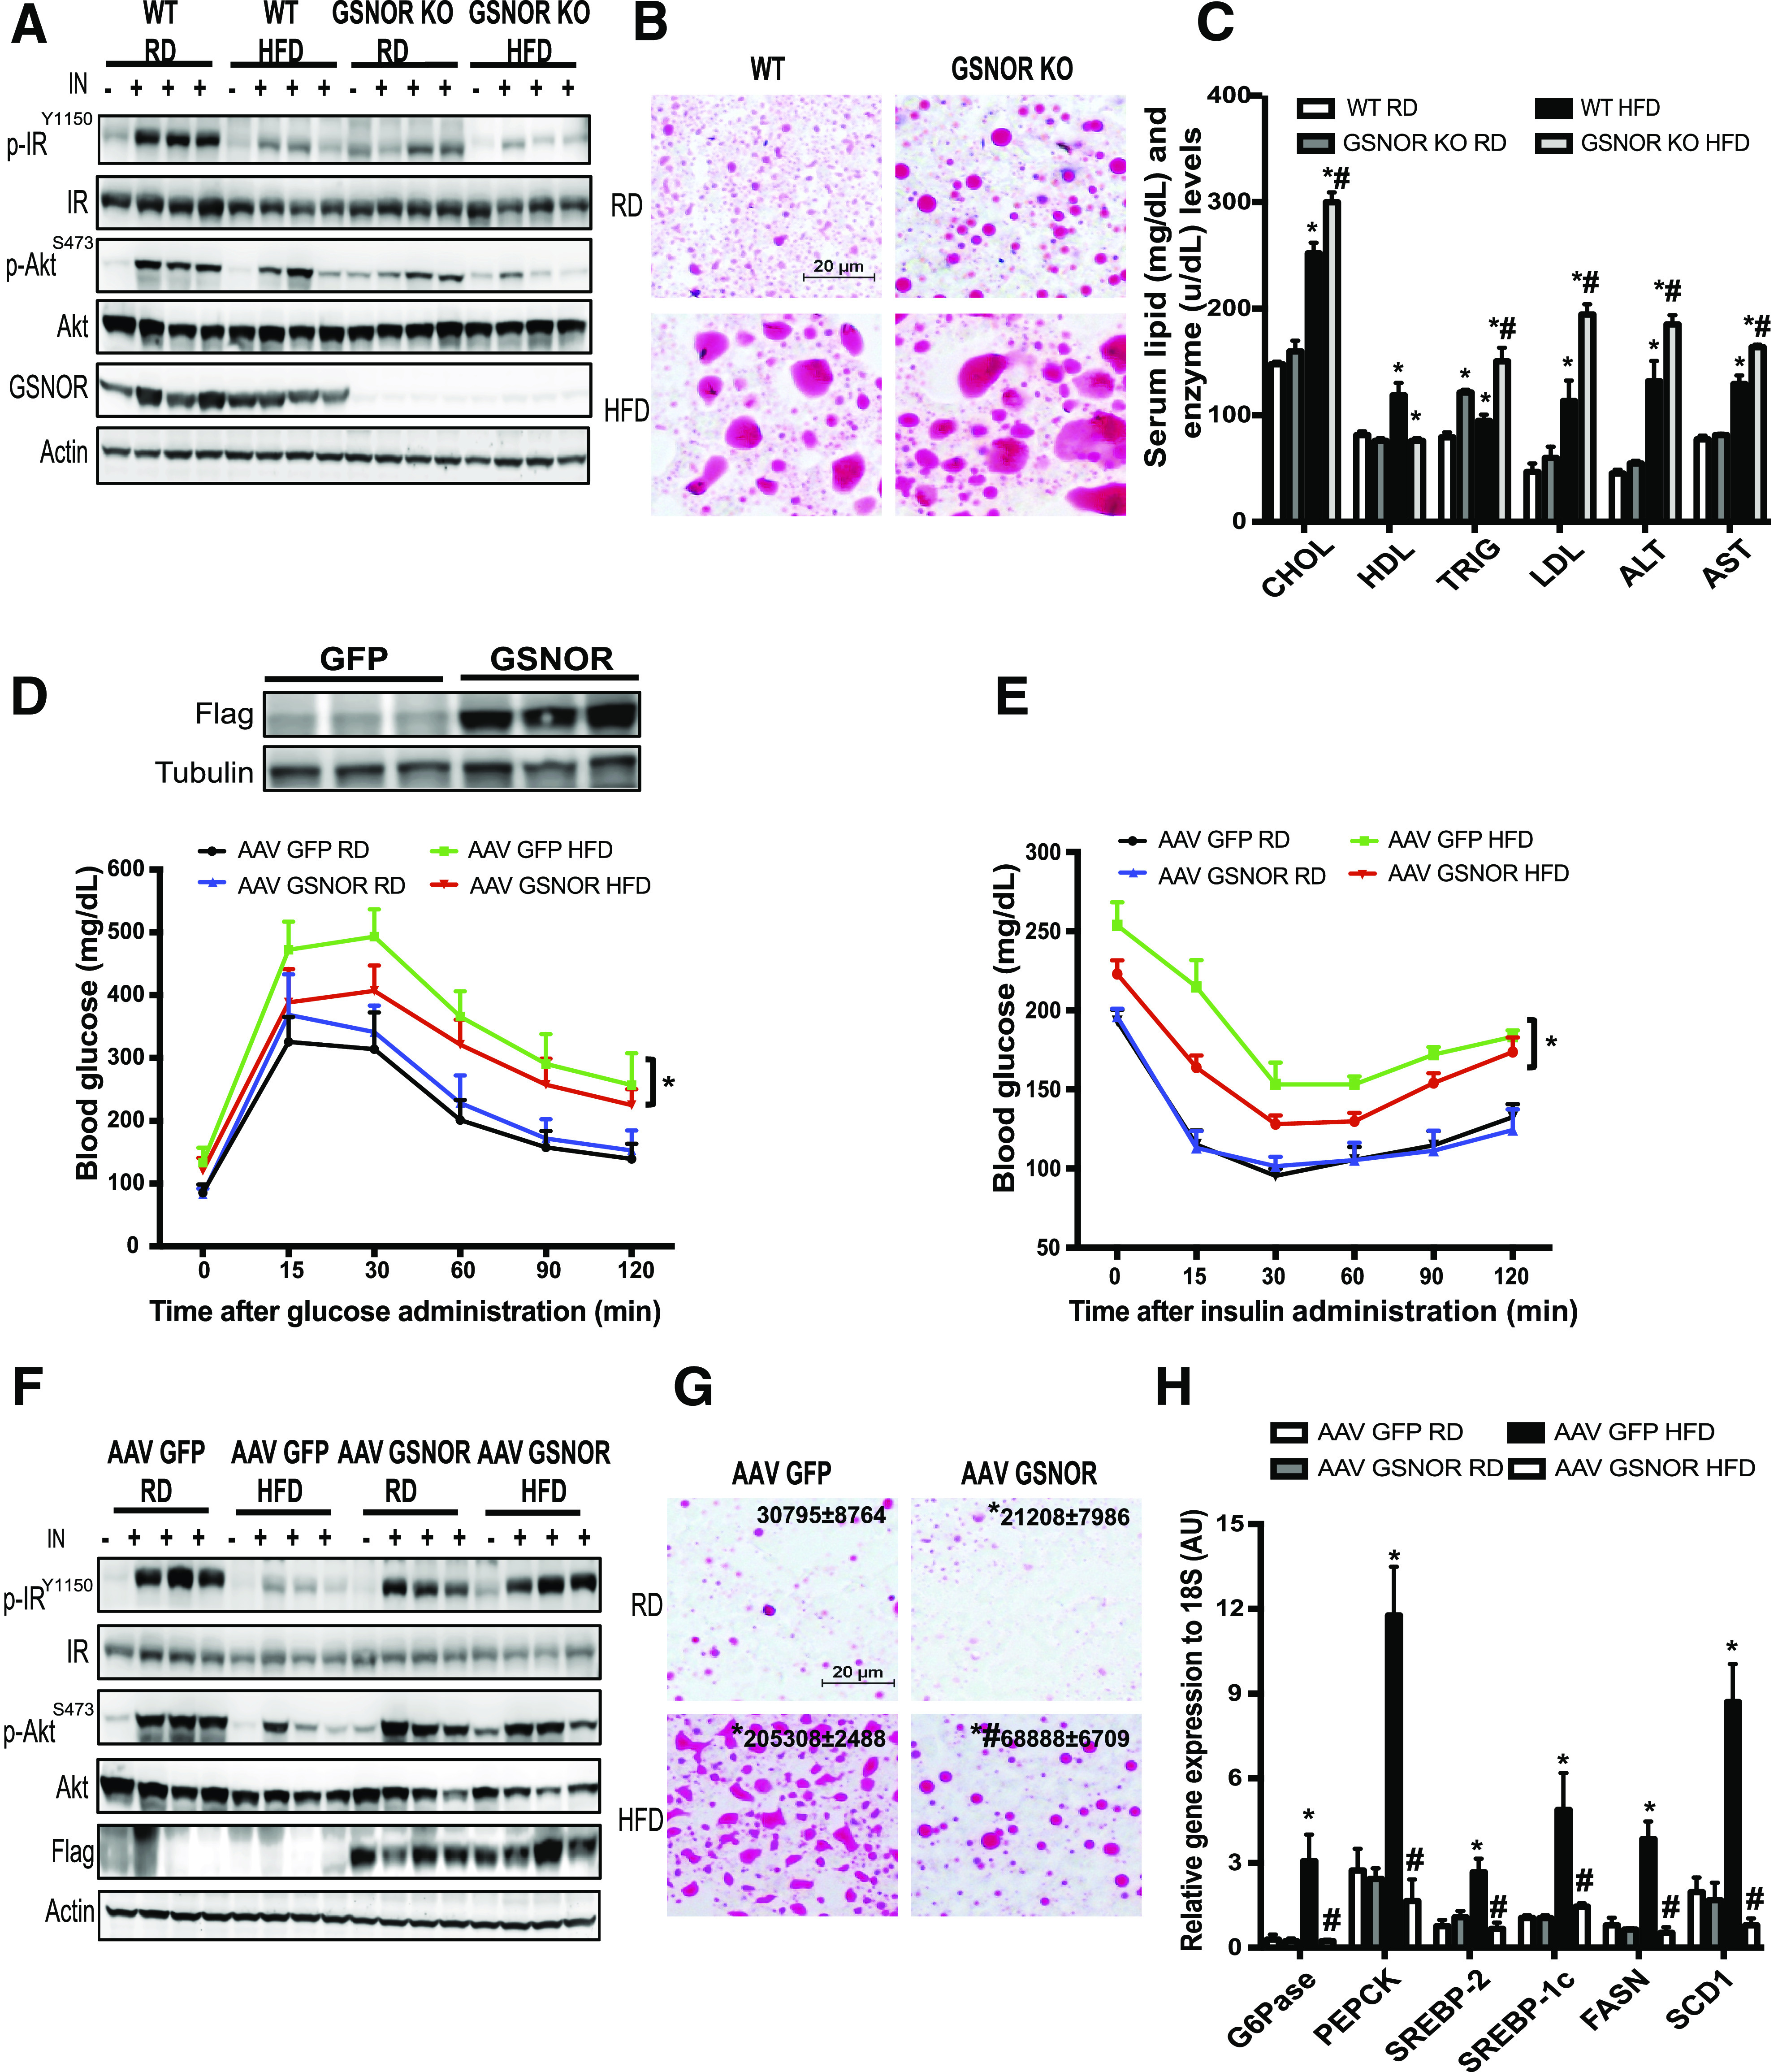
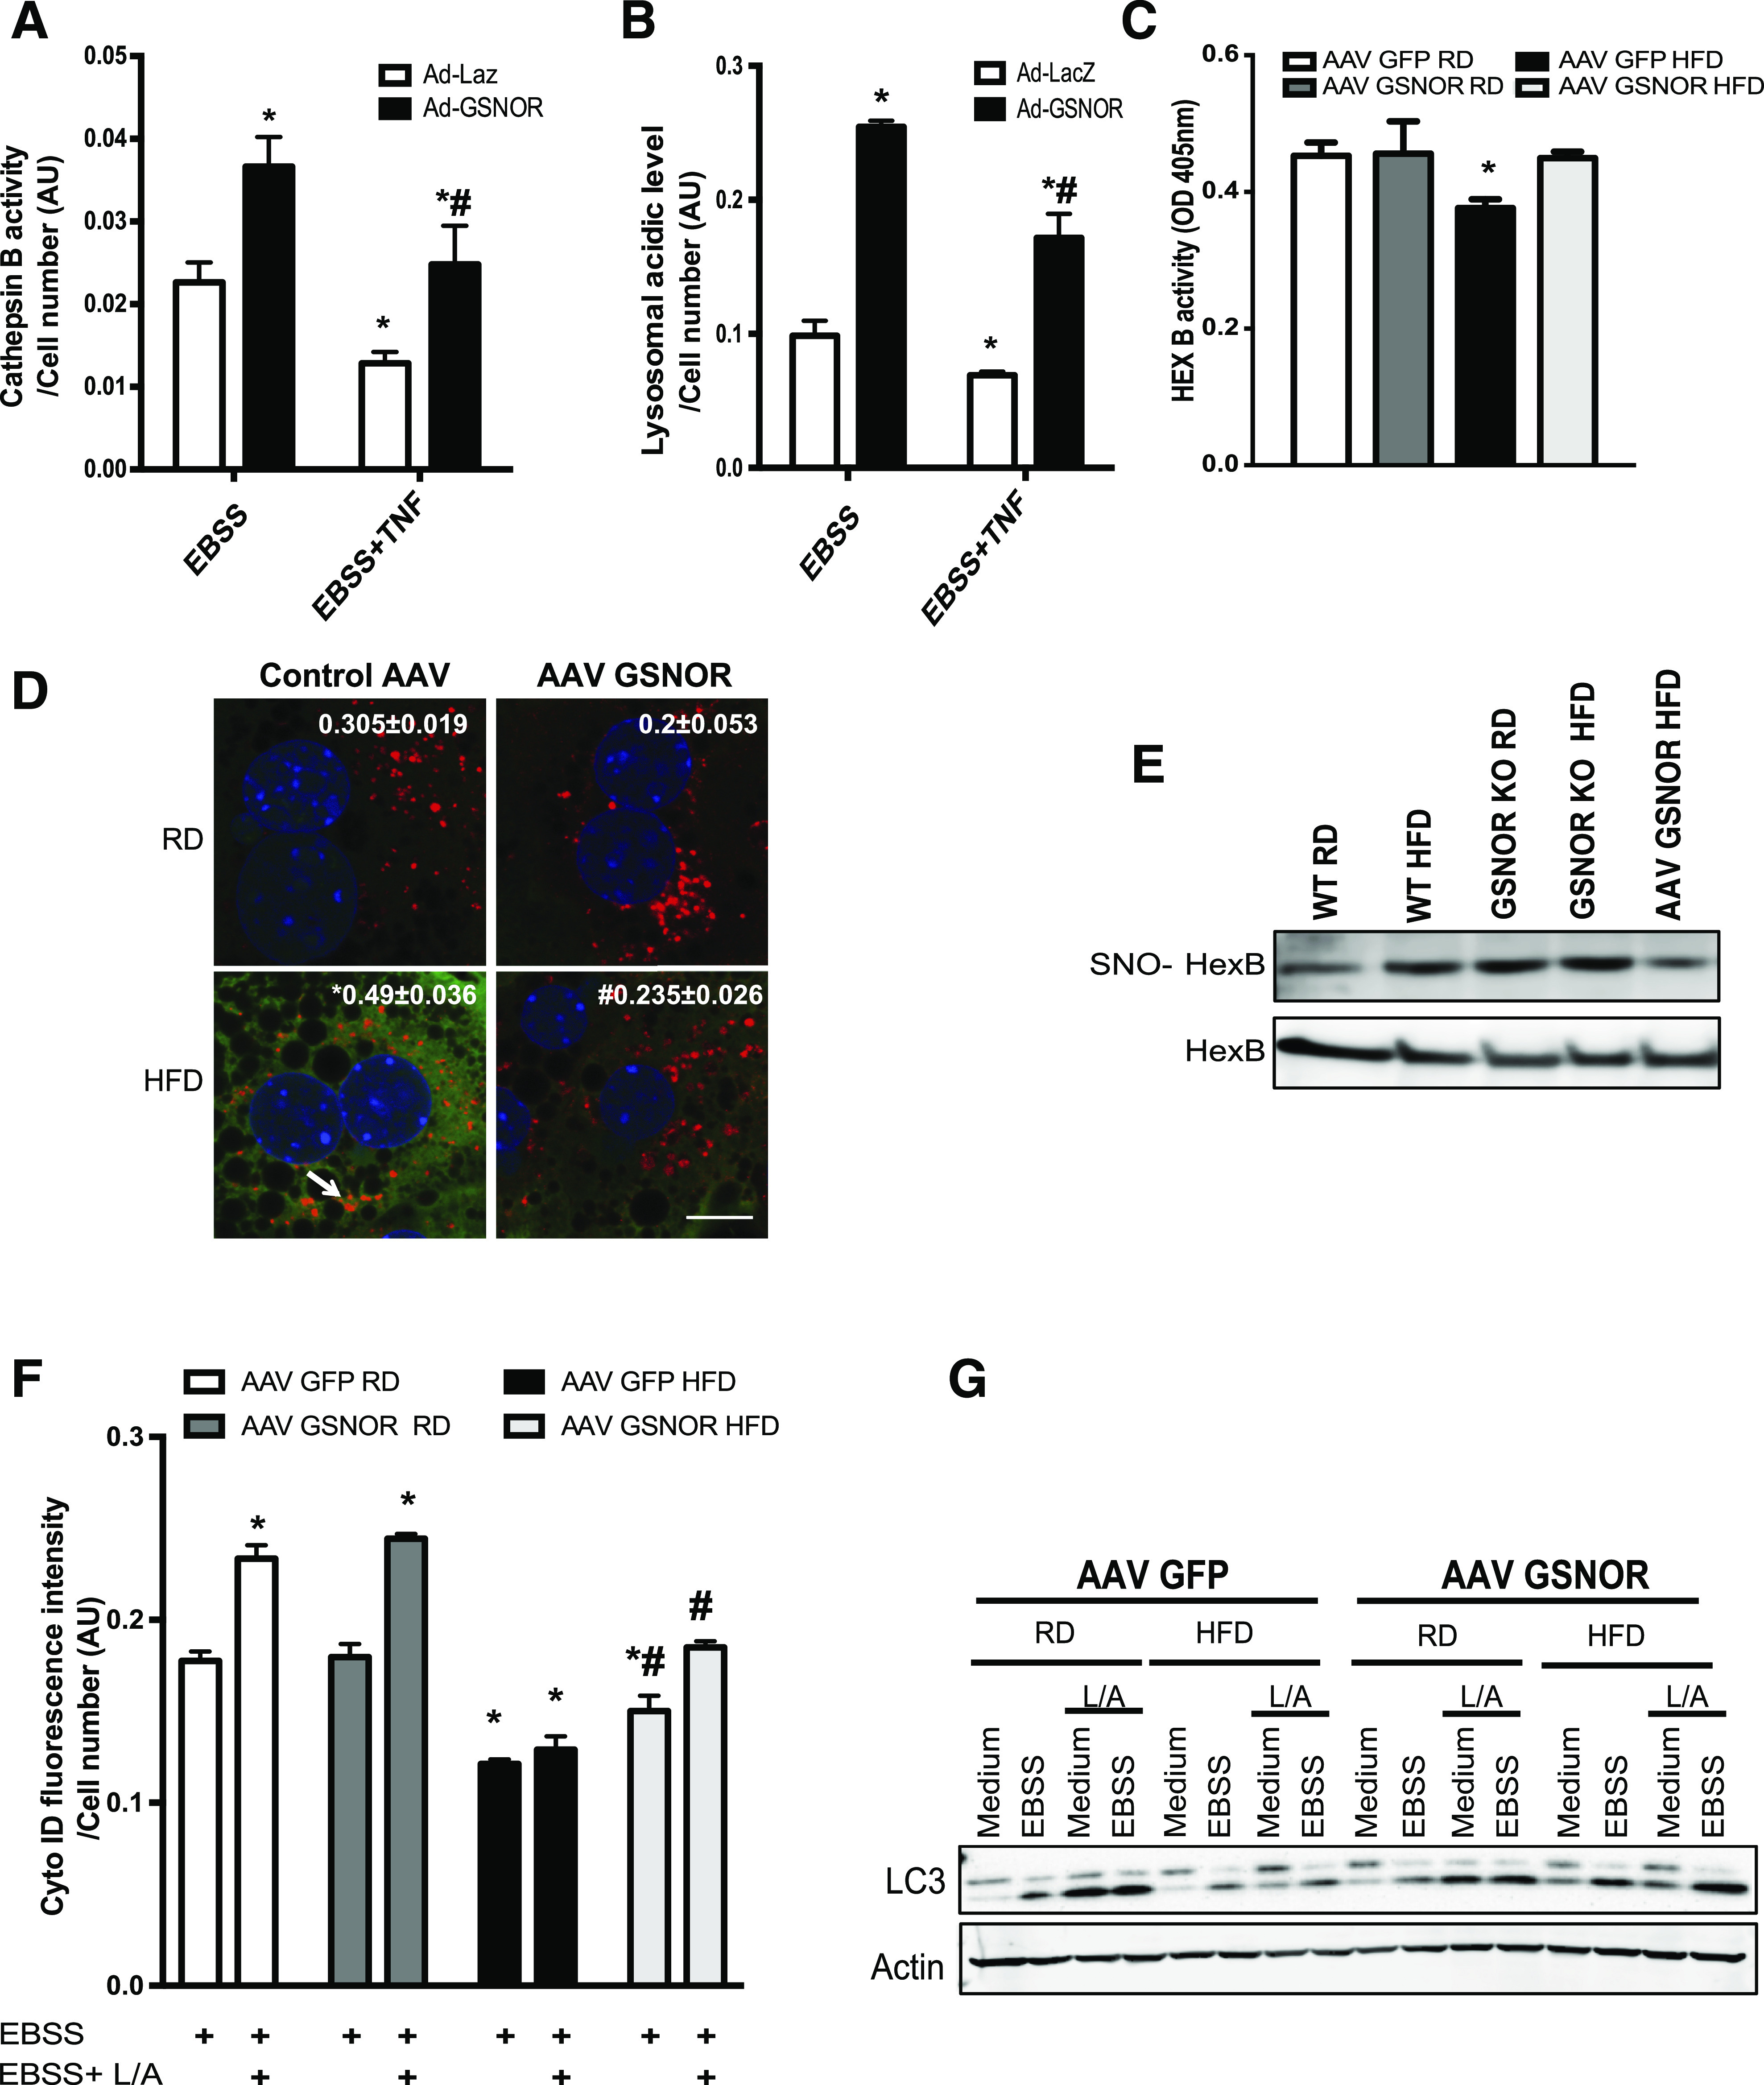
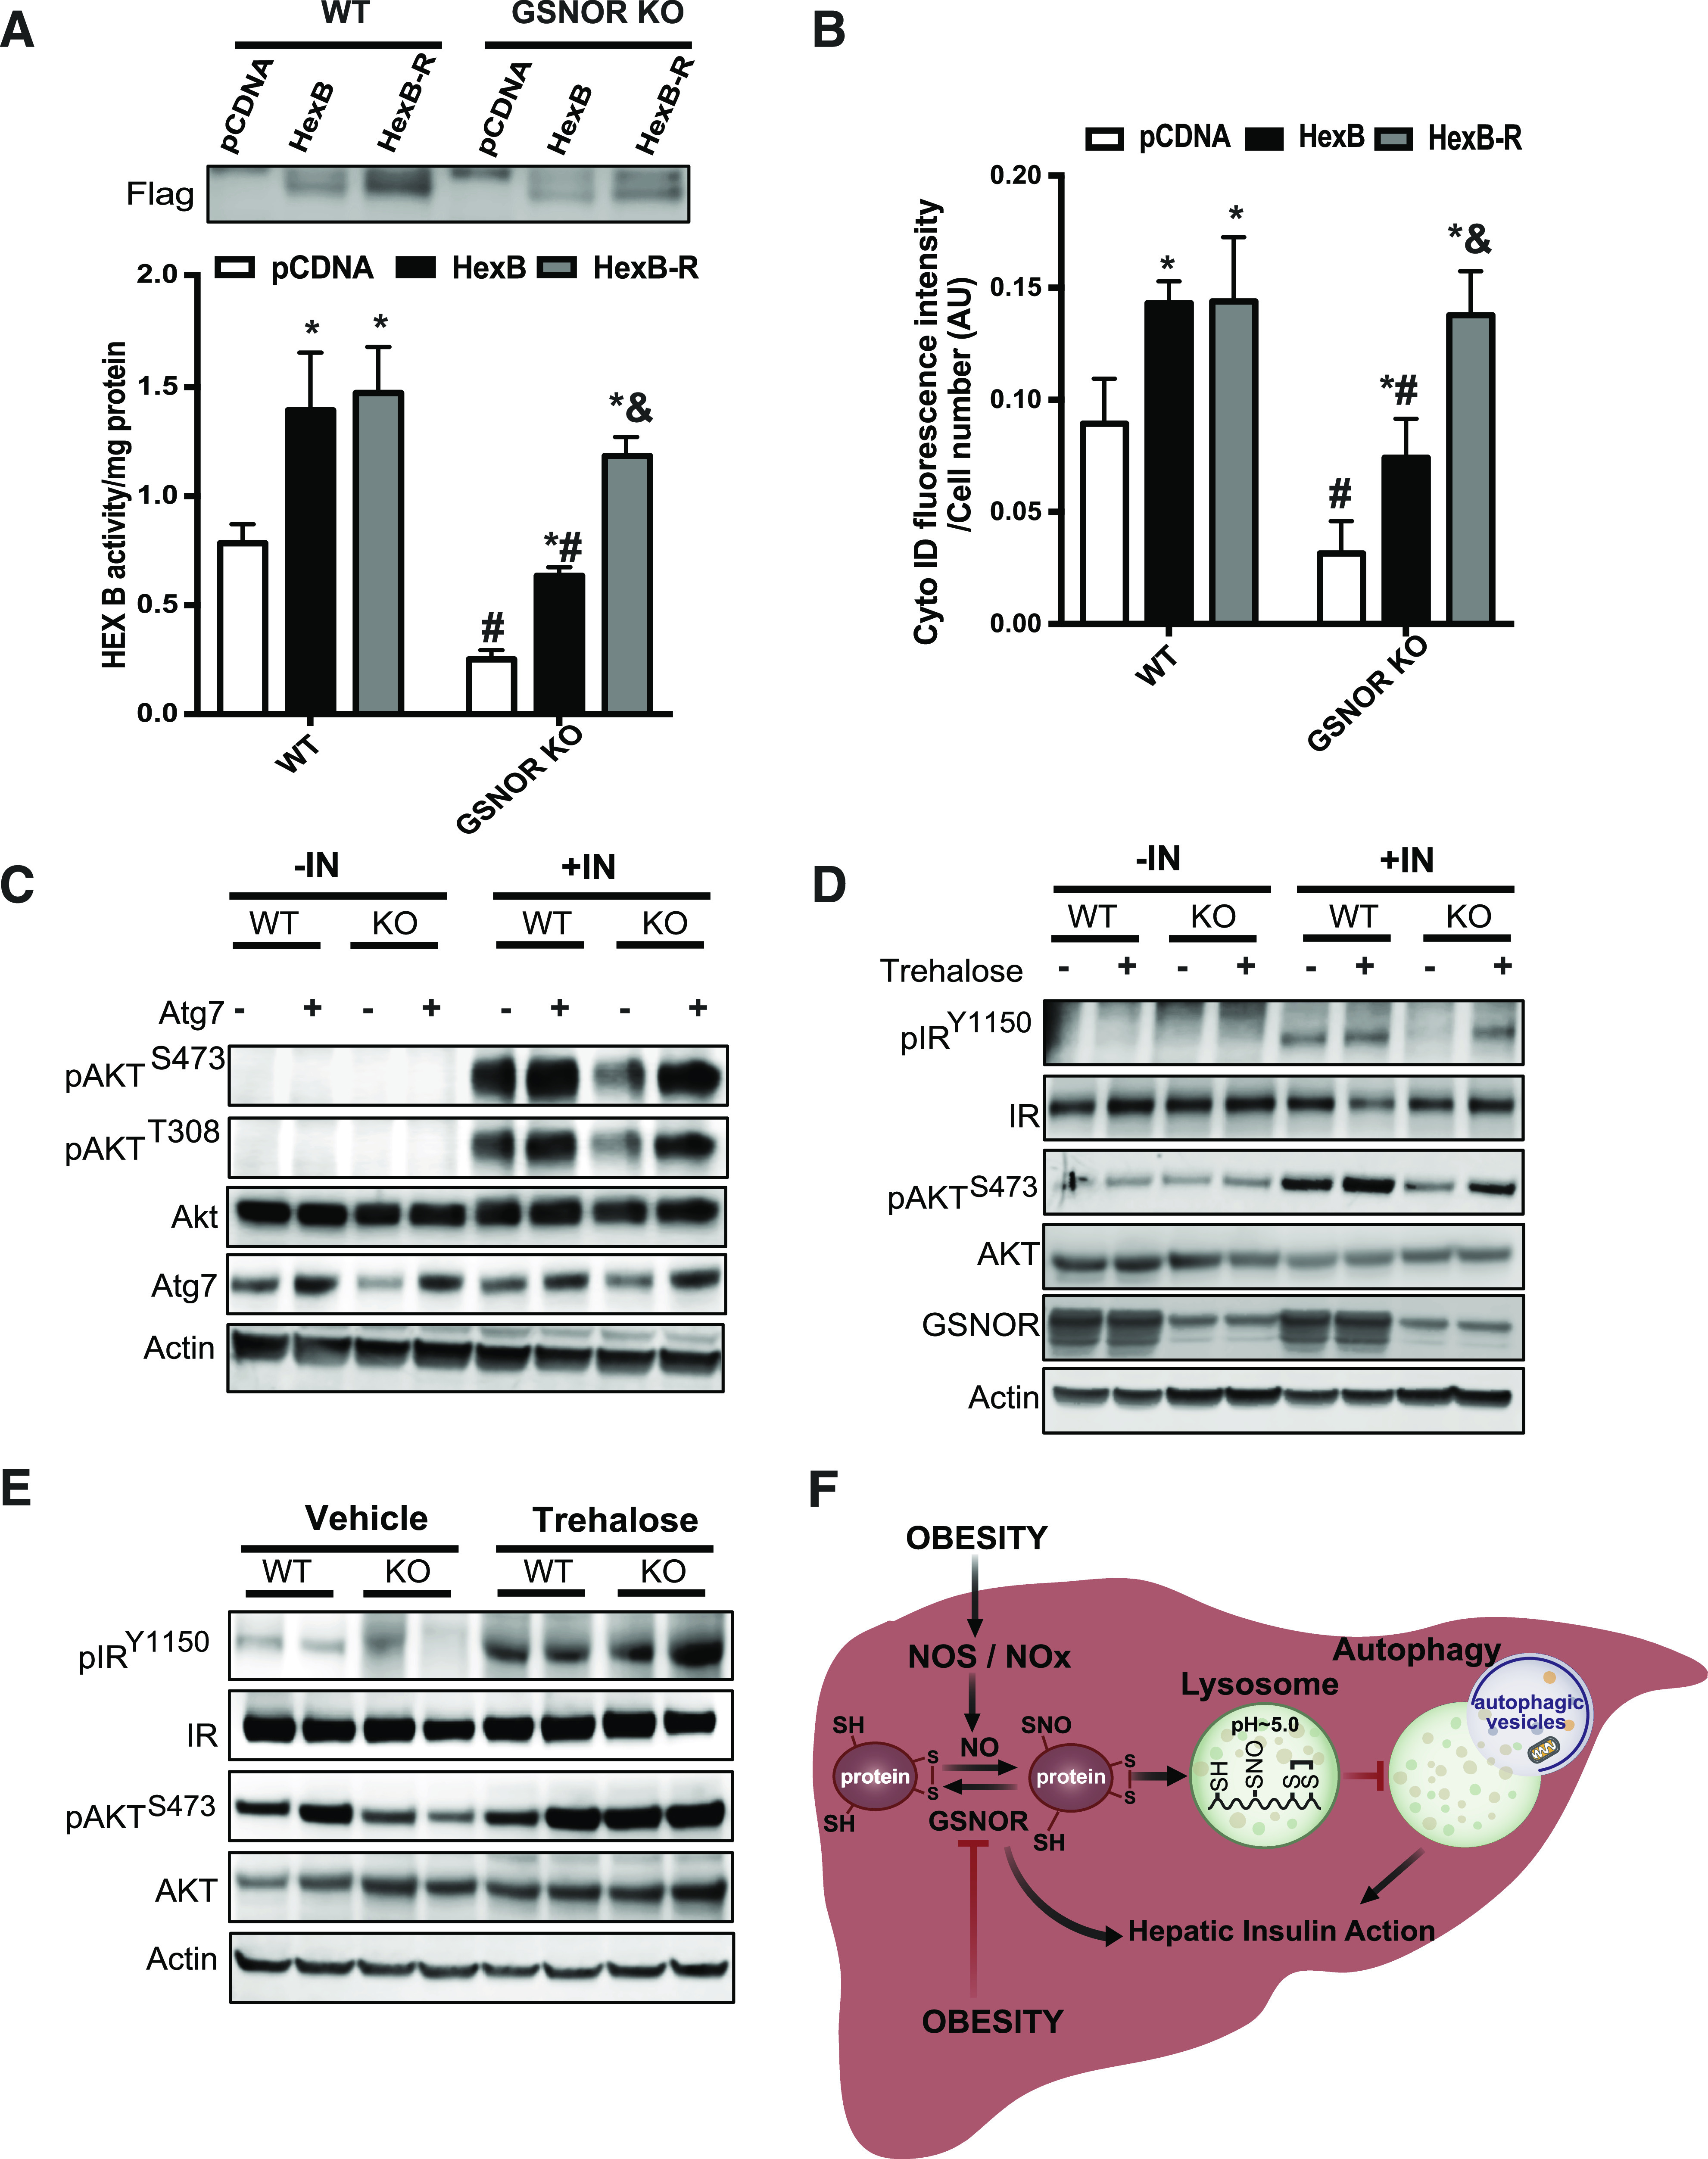
Obesity is associated with elevated intracellular nitric oxide (NO) production, which promotes nitrosative stress in metabolic tissues such as liver and skeletal muscle, contributing to insulin resistance. The onset of obesity-associated insulin resistance is due, in part, to the compromise of hepatic autophagy, a process that leads to lysosomal degradation of cellular components. However, it is not known how NO bioactivity might impact autophagy in obesity. Here, we establish that S-nitrosoglutathione reductase (GSNOR), a major protein denitrosylase, provides a key regulatory link between inflammation and autophagy, which is disrupted in obesity and diabetes. We demonstrate that obesity promotes S-nitrosylation of lysosomal proteins in the liver, thereby impairing lysosomal enzyme activities. Moreover, in mice and humans, obesity and diabetes are accompanied by decreases in GSNOR activity, engendering nitrosative stress. In mice with a GSNOR deletion, diet-induced obesity increases lysosomal nitrosative stress and impairs autophagy in the liver, leading to hepatic insulin resistance. Conversely, liver-specific overexpression of GSNOR in obese mice markedly enhances lysosomal function and autophagy and, remarkably, improves insulin action and glucose homeostasis. Furthermore, overexpression of S-nitrosylation-resistant variants of lysosomal enzymes enhances autophagy, and pharmacologically and genetically enhancing autophagy improves hepatic insulin sensitivity in GSNOR-deficient hepatocytes. Taken together, our data indicate that obesity-induced protein S-nitrosylation is a key mechanism compromising the hepatic autophagy, contributing to hepatic insulin resistance.


Figures

Figure 1
Figure 1
Obesity results in S-nitrosylation of lysosomal enzymes. A: Hierarchical clustering of S-nitrosylated (SNO) proteins in the livers of mice on the RD and HFD (n = 3, 16 weeks on HFD). S-nitrosylated proteins were labeled with iodoTMT and subjected to liquid chromatography–MS/MS-based proteomics. B: Top differential expressed 100 targets were selected for hierarchical clustering and principal component analysis (PCA). C: Lysosomal targets whose S-nitrosylation is significantly increased in the livers from mice fed with an HFD and the corresponding sites of S-nitrosylation. S-nitrosylated proteins that are deferentially expressed between the RD and HFD groups were used for GO and KEGG category classification. The sites of S-nitrosylation are indicated in red and numbered. D: top panel: Representative images (63×) of staining for S-nitrosylated HexB in the livers from mice fed with an RD or HFD (16 weeks on an HFD). S-nitrosylation staining was performed by a modified in situ biotin switch method. Blue, DAPI; green, S-nitrosylation; red, HexB. Arrow points to S-nitrosylated HexB. AS, ascorbate omitted (negative control for S-nitrosylation). Scale bar, 10 μm. Quantified colocalizations of S-nitrosylated HexB are shown on the top of each image. Data are shown as a Pearson correlation coefficient as the mean ± SEM. *Statistically significant difference relative to lean condition determined by Student t test (n = 3, P < 0.05). D, bottom panel: Representative Western blotting for S-nitrosylated HexB and input of HexB in livers. Each lane is a sample from an individual mouse. E: Representative images (63×) of staining for S-nitroyslated HexB in the livers from patients without diabetes and patients with diabetes. Blue, DAPI; green, S-nitrosylation; red, HexB. Arrow is S-nitrosylated HexB. Scale bar, 10 μm. Quantified colocalizations of S-nitrosylated HexB are shown on the top of each image. Data are shown as Pearson correlation coefficient as the mean ± SEM. *Statistically significant difference relative to nondiabetic condition determined by Student t test (n = 3, P < 0.05). F and G: HexB and CTSB activities in lysosomal fractions from lean and ob/ob mice (obese, 10 weeks old; n = 3). Same amount of liver tissues from lean and obese mice were used. Data are presented as the mean ± SEM. *Statistically significant difference relative to lean condition determined by Student t test (P < 0.05) (F). *Statistically significant difference relative to probe alone and #statistically significant difference relative to lean condition; analysis of the area under the curve (AUC) was performed by ANOVA with post hoc test (P < 0.05) (G). In vitro enzyme activity assays for HexB (H) and CTSB (I). Recombinant HexB (0.15 ng) or CTSB (10 ng) was used in the absence or presence of SNAP (10 mmol/L, 20 min). All data are presented as the mean ± SEM. *Statistically significant difference relative to samples without SNAP treatment, as assessed by Student t test (P < 0.05) (H), and analysis of the AUC was performed by ANOVA with post hoc test (P < 0.05) (I). OD, optical density; RFU, relative fluorescence units.
Figure 2
Figure 2
Obesity and diabetes are associated with decreased GSNOR-mediated denitrosylation. A: Western blotting of GSNOR protein in the livers of mice on the RD or HFD (n = 3, 16 weeks). B: Quantification of GSNOR protein in A, normalized to actin (n = 6). GSNOR mRNA (C) and activity (D) in livers from the mice in A (n = 6). *Statistically significant difference relative to lean control mice and analysis of area under curve was performed by Student t test (P < 0.05). Ten micrograms of liver lysate was used to measure the kinetics of GSNO-dependent NADH consumption in the absence or presence of 100 μmol/L GSNO. E: Western blotting of GSNOR protein and gene expression levels in ob/ob mice (10 weeks). F: Quantification of GSNOR protein in E. Quantification of GSNOR mRNA (G) and enzyme activity (H) were examined in the livers from these mice (n = 5). All data are presented as the mean ± SEM. *Indicates statistically significant difference relative to lean control mice in each group by Student t test (P < 0.05). Western blotting of GSNOR protein expression level (I), quantification of GSNOR protein (G), and enzyme activity (K) were examined in the livers from patients without diabetes (ND) and with diabetes (DM) (n = 4). All data are presented as the mean ± SEM. *Indicates statistically significant difference relative to the nondiabetic condition determined by Student t test (P < 0.05). AU, arbitrary units.
Figure 3
Figure 3
GSNOR deficiency results in impaired lysosomal function. A: GSNOR activities in the livers (n = 3) of WT and GSNOR KO mice on the RD or HFD (16 weeks). The resulting GSNOR activity was first normalized to the area under the curve of samples without GSNO then was normalized to those for the WT RD group; and results are presented as the mean ± SEM. *Significant difference relative to WT RD; #statistically significant difference between WT and GSNOR KO groups on the HFD determined by ANOVA followed by post hoc test (P < 0.05). B: Representative confocal images (63×) of staining for S-nitrosylation in liver sections from WT and GSNOR KO mice. Blue, DAPI; green, S-nitrosylation; red, HexB. Arrows are S-nitrosylated (SNO) HexB. Scale bar, 10 μm. Quantified colocalizations of S-nitrosylated HexB are shown on the top of each image. Data are shown as a Pearson correlation coefficient as the mean ± SEM. *Indicates statistically significant difference relative to WT RD determined by ANOVA followed by post hoc test (P < 0.05). C: CTSB activity measured in primary hepatocytes isolated from WT and GSNOR KO mice (n = 3; 16 weeks on HFD). Autophagy was induced by EBSS (4 h). *Indicates statistical significance compared with EBSS treatment in WT RD; #indicates statistical significance within WT and GSNOR KO groups on the HFD (determined by ANOVA followed by post hoc test) (P < 0.05). D: HexB activities in the primary hepatocytes isolated from WT and GSNOR KO mice on the RD (n = 3). All data are presented as the mean ± SEM. *Indicates statistical significance compared with WT group by Student t test (P < 0.05). E: Lysosomal acidity in live primary hepatocytes from WT and GSNOR KO mice on the RD or HFD (n = 3; 16 weeks on the HFD). Autophagy was induced by EBSS (4 h). *Indicates statistical significance compared with EBSS treatment in WT mice on the RD; #indicates statistical significance within WT and GSNOR KO groups on the HFD determined by ANOVA followed by post hoc test (P < 0.05). AU, arbitrary units; AS, ascorbate omitted.
Figure 4
Figure 4
GSNOR deficiency contributes to defective autophagy. A: LC3 conversion (arrow indicated LC3-II) and p62 expression (arrow) in livers of WT and GSNOR KO HFD or RD mice (16 weeks). Mice were fasted for 16 h with or without refeeding for 4 h before being sacrificed. B: Representative images (40×) of RFP-GFP-LC3 puncta in the livers of RFP-GFP-LC3 and RFP-GFP-LC3;GSNOR KO mice fed the RD or HFD (16 weeks on HFD, fasted for 16 h). Quantified numbers of the red LC3 puncta/field are shown on the top of each image. Data are shown as the mean ± SEM. *Indicates statistically significant difference relative to RFP-GFP-LC3 RD. #Indicates statistical significance between HFD groups determined by ANOVA followed by post hoc test (P < 0.05). Scale bar, 10 μm. C: LC3 expression in livers from RFP-GFP-LC3 and RFP-GFP-LC3;GSNOR KO mice fed the RD or HFD (16 weeks on HFD, fasted for 16 h). D: Representative confocal images (63×) of primary hepatocytes isolated from WT or GSNOR KO mice (n = 3) transduced with ade-mRFP-GFP-LC3 (multiplicity of infection = 2). Cells were treated with EBSS (4 h), with the number of the red LC3 puncta/field on the top of image. All data are presented as the mean ± SEM. *Indicates statistical significance compared with WT medium; #indicates statistical significance between EBSS groups determined by ANOVA followed by post hoc test (P < 0.05). Scale bar, 10 μm. E: Quantification of autophagic vacuoles in live primary hepatocytes from WT and GSNOR KO mice (n = 3) using a Cyto-ID kit. Cells were treated with EBSS (4 h). All data are presented as the mean ± SEM. *Indicates statistical significance compared with WT RD group in medium treatment; #indicates statistical significance within WT and GSNOR KO groups on same diet determined by ANOVA followed by post hoc test (P < 0.05). F: Representative Western blots of S-nitrosylated (SNO) JNK and IKKβ in livers of mice fed with RD and HFD. AS, ascorbate omitted (negative control for biotin switch assay); SNAP, sample treated with SNAP, positive control. G: Levels of mRNAs encoding genes involved in autophagy regulation in livers of WT mice and GSNOR KO mice (fasted for 16 h), as assessed by quantitative RT-PCR. Data are presented as the mean ± SEM. *Indicates statistical significance compared with WT group, determined by Student t test (P < 0.05). AU, arbitrary units.
Figure 5
Figure 5
GSNOR regulates hepatic insulin sensitivity. A: Hepatic insulin action in the livers from WT and GSNOR KO mice (16 weeks on HFD). IN, insulin (0.75 IU/kg for 3 min); p-AKT, Aktser473; p-IR, IRtyr1150/1151. Data are representative of two individual cohorts of mice. B: Representative images (20×) of Oil Red O staining of liver sections of WT and GSNOR KO mice, as in A. C: Serum lipid profiles and levels of AST and ALT in these WT and GSNOR KO mice reared on the RD and HFD (n = 3, samples were collected after 6 h of food withdrawal). Data are presented as the mean ± SEM. *Indicates statistically significant difference relative to WT RD group; #indicates statistically significant difference between HFD groups determined by ANOVA followed by post hoc test (P < 0.05). D: Glucose tolerance in WT mice transduced with AAV8-TBG-GFP or AAV8-TBG-GSNOR and fed with RD or HFD (n = 10; on HFD for 8 weeks). GSNOR expression in the liver is shown in embedded panel. Data are representative of two individual cohorts of mice. E: Insulin tolerance in the mice shown in D. Data are presented as the mean ± SEM. *Indicates statistical analysis of the area under the curve between HFD groups performed by two-way ANOVA with post hoc test (P < 0.05). F: Hepatic insulin action in livers from WT mice transduced with AAV8-TBG eGFP or AAV8-TBG GSNOR (12 weeks on HFD). Each lane represents a mouse. Data are representative of two individual cohorts of mice. G: Representative images (20×) of Oil Red O staining of liver sections of WT mice transduced with AAV8-TBG-GFP or AAV8-TBG-GSNOR and fed with RD or HFD. *Indicates statistically significant difference relative to AAV GFP RD; #indicates statistical significance between the HFD groups determined by ANOVA followed by post hoc test (P < 0.05). H: Levels of mRNAs encoding gluconeogenesis and lipogenesis genes in livers of WT mice transduced with AAV GSNOR or control virus (n = 4–6), as assessed by quantitative RT-PCR. Data are presented as the mean ± SEM. *Indicates statistical significance compared with AAV GFP RD group; #indicates statistical significance between HFD groups determined by ANOVA followed by post hoc test (P < 0.05). AU, arbitrary units; CHOL, cholesterol; p, phosphorylated; TRIG, triglycerides.
Figure 6
Figure 6
Amelioration of nitrosative stress by GSNOR improves hepatic lysosomal function and autophagy in obesity. CTSB activity (A) and lysosomal acidity (B) in live primary hepatocytes isolated from GSNOR KO mice (n = 3, fed on RD) transduced with control (Ad-LacZ) or Ad-GSNOR. Cells were treated with EBSS with or without pretreatment of tumor necrosis factor (10 ng/mL, 16 h). All data are presented as the mean ± SEM. *Indicates statistical significance compared with Ad-LacZ group determined by ANOVA followed by post hoc test (P < 0.05); #indicates statistical significance between Ad-GSNOR groups determined by ANOVA followed by post hoc test (P < 0.05). C: HexB activity in the primary hepatocytes isolated from WT mice transduced with AAV GSNOR vs. control virus and raised on an RD or an HFD (n = 3, 12 weeks on HFD). All data are presented as the mean ± SEM. *Indicates statistical significance compared with AAV GFP RD, determined by ANOVA with post hoc test (P < 0.05). D: Representative confocal images (63×) of staining for S-nitrosylation in primary hepatocytes from WT mice transduced with AAV GSNOR. Red, HexB; green, S-nitrosylation; blue, DAPI. Arrow points to S-nitrosylated HexB. Scale bar, 10 μm. Quantified colocalizations of S-nitrosylated (SNO) HexB are shown on the top of each image. Data are shown as Pearson correlation coefficient as the mean ± SEM. *Indicates statistically significant difference relative to AAV GFP RD; #indicates statistical significance between HFD groups determined by ANOVA followed by post hoc test (P < 0.05). E: S-nitrosylation of HexB in livers from WT mice, GSNOR KO mice, and WT overexpressing GSNOR and raised on the RD or HFD. Each lane used a mixture of protein lysates from three mice. F: Autophagic vacuoles in live primary hepatocytes from WT mice transduced with AAV GSNOR or AAV GFP and raised on the RD or HFD (n = 3) for 12 weeks, as detected using a Cyto-ID Kit. Cells were treated with EBSS (4 h); 20 mmol/L ammonium chloride and 100 mmol/L leupeptin (L/A; 4 h) were used to inhibit lysosomal degradation. All data are presented as the mean ± SEM. *Indicates statistical significance compared with AAV GFP RD in EBSS treatment; #indicates statistical significance between HFD groups determined by ANOVA followed by post hoc test (P < 0.05). G: LC3 conversion (arrow, LC3-II) in the primary hepatocytes from livers from WT mice with GSNOR overexpression. EBSS (4 h) was used to induce autophagy; 20 mmol/L ammonium chloride and 100 mmol/L leupeptin (4 h) were used to inhibit lysosomal degradation. Each lane contains a mixture of protein lysates from three mice. AU, arbitrary units; OD, optical density.
Figure 7
Figure 7
GSNOR-mediated lysosomal nitrosative stress contributes to impaired hepatic autophagy and insulin resistance. HexB activity (A) and autophagic vacuoles (B) in primary hepatocytes from WT and GSNOR KO mice (n = 3; 8 weeks on the RD) with EBSS treatment (4 h). HexB-R, S-nitrosylation (SNO)–resistant HexB; pcDNA, control plasmid. Data are presented as the mean ± SEM. *Indicates statistical significance compared with pcDNA in same mouse line; #indicates statistical significance between the WT and GSNOR KO groups with the same treatment; &indicates statistical significance between HexB and HexB-R groups in the same mouse line, determined by ANOVA followed by post hoc test (P < 0.05). C: Hepatic insulin action in primary hepatocytes isolated from WT and GSNOR KO mice transduced with Ad-Atg7 or control virus (Ad-lacZ). Each lane contains a mixture of protein lysates from 3 mice. IN, insulin, 5 nmol/L for 10 min. D: Hepatic insulin action in primary hepatocytes isolated from WT and GSNOR KO mice treated with trehalose (16 h, 100 mmol/L). For each lane, a mixture of protein lysates from three mice was used. E: Hepatic insulin signaling in the livers from WT and GSNOR KO mice (8 weeks on RD) treated with trehalose (2 g/kg, daily for 1 week). F: Working model of this study. Obesity results in impaired GSNOR-mediated denitrosylation of proteins in the liver, leading to elevated S-nitrosylation of lysosomal enzymes, defective autophagy, and impaired hepatic insulin action. AU, arbitrary units; NOx: nitrogen oxides; SH: free thiols.

Comment in

References

    1. Choi AM, Ryter SW, Levine B. Autophagy in human health and disease. N Engl J Med 2013;368:1845–1846 - PubMed
    1. Kaushik S, Rodriguez-Navarro JA, Arias E, et al. . Autophagy in hypothalamic AgRP neurons regulates food intake and energy balance. Cell Metab 2011;14:173–183 - PMC - PubMed
    1. Yang L, Li P, Fu S, Calay ES, Hotamisligil GS. Defective hepatic autophagy in obesity promotes ER stress and causes insulin resistance. Cell Metab 2010;11:467–478 - PMC - PubMed
    1. Singh R, Kaushik S, Wang Y, et al. . Autophagy regulates lipid metabolism. Nature 2009;458:1131–1135 - PMC - PubMed
    1. Jung HS, Chung KW, Won Kim J, et al. . Loss of autophagy diminishes pancreatic beta cell mass and function with resultant hyperglycemia. Cell Metab 2008;8:318–324 - PubMed

Publication types

MeSH terms

Substances