

Deletion of the Akt/mTORC1 Repressor REDD1 Prevents Visual Dysfunction in a Rodent Model of Type 1 Diabetes
- PMID: 29074598
- PMCID: PMC5741149
- DOI: 10.2337/db17-0728
Deletion of the Akt/mTORC1 Repressor REDD1 Prevents Visual Dysfunction in a Rodent Model of Type 1 Diabetes
Abstract
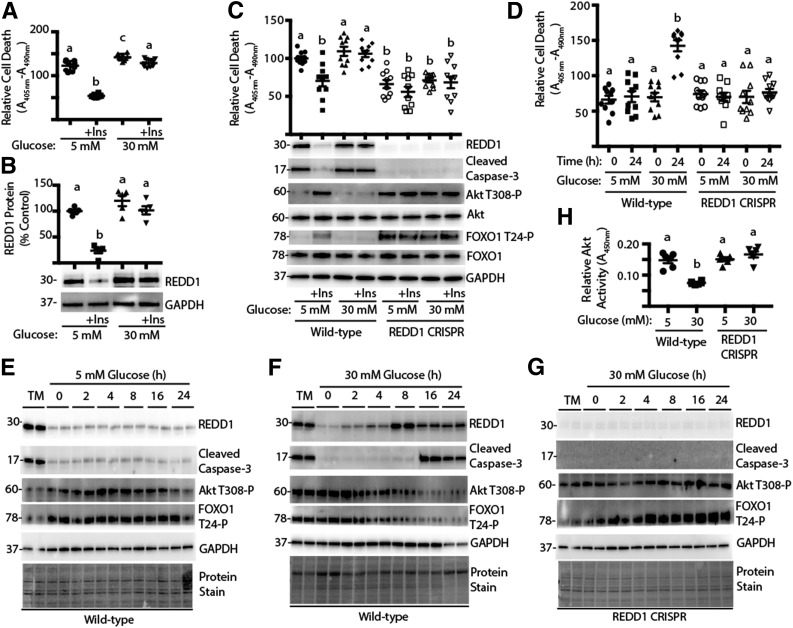
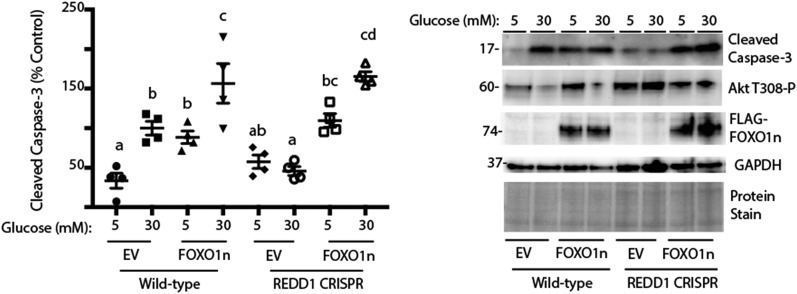
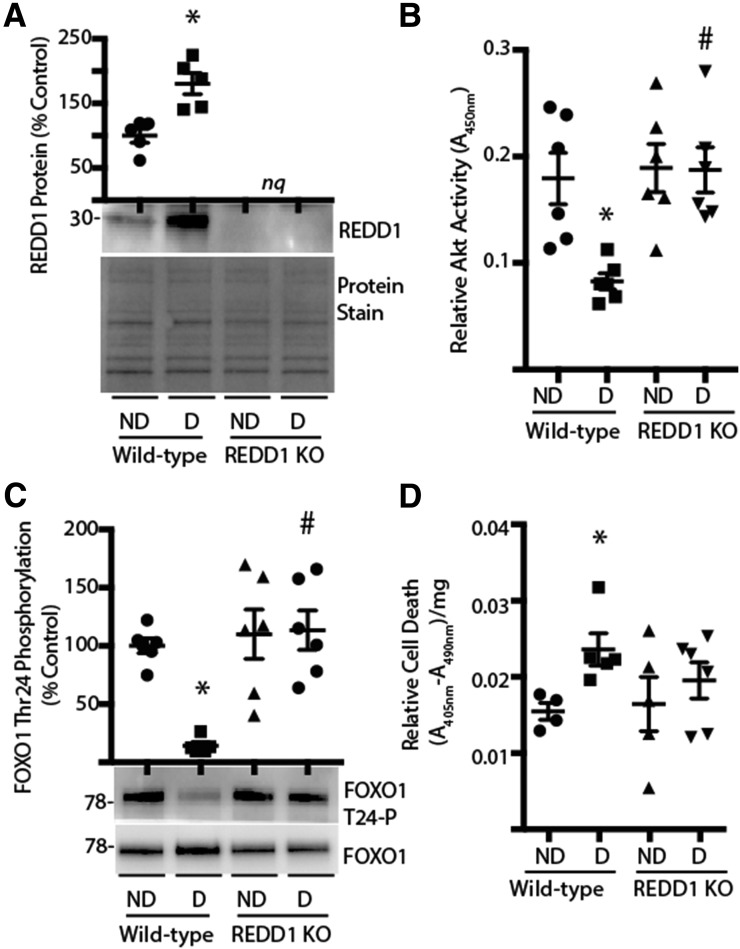
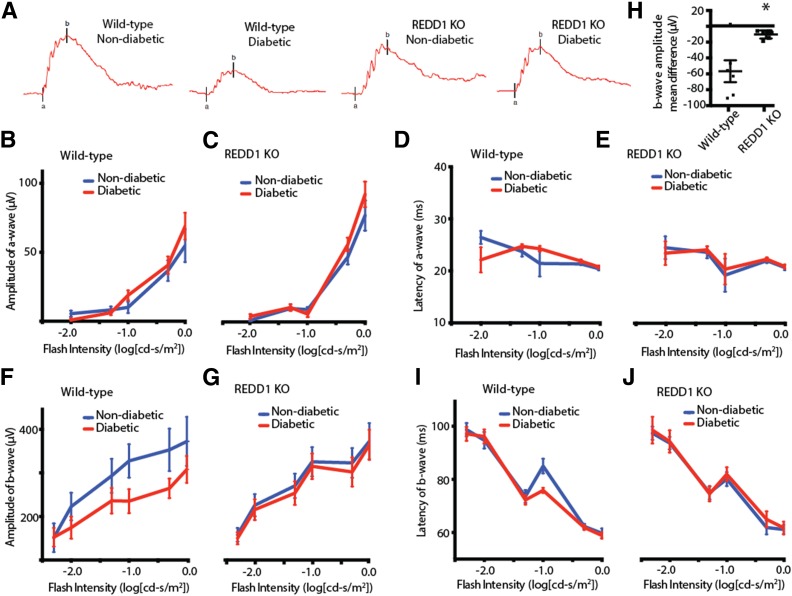
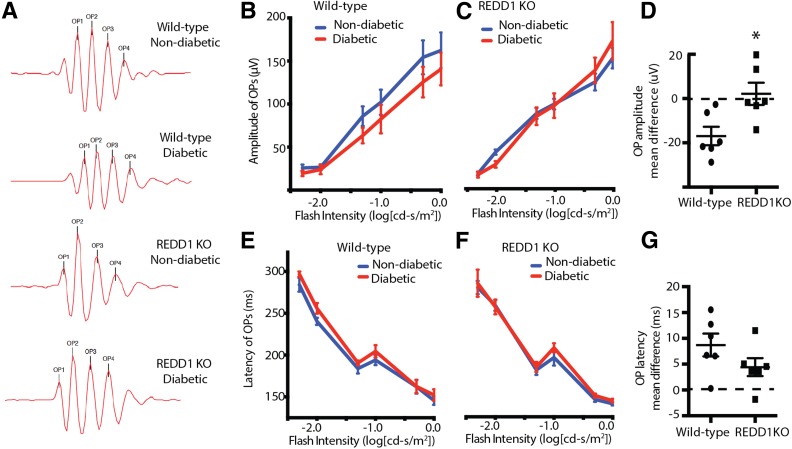
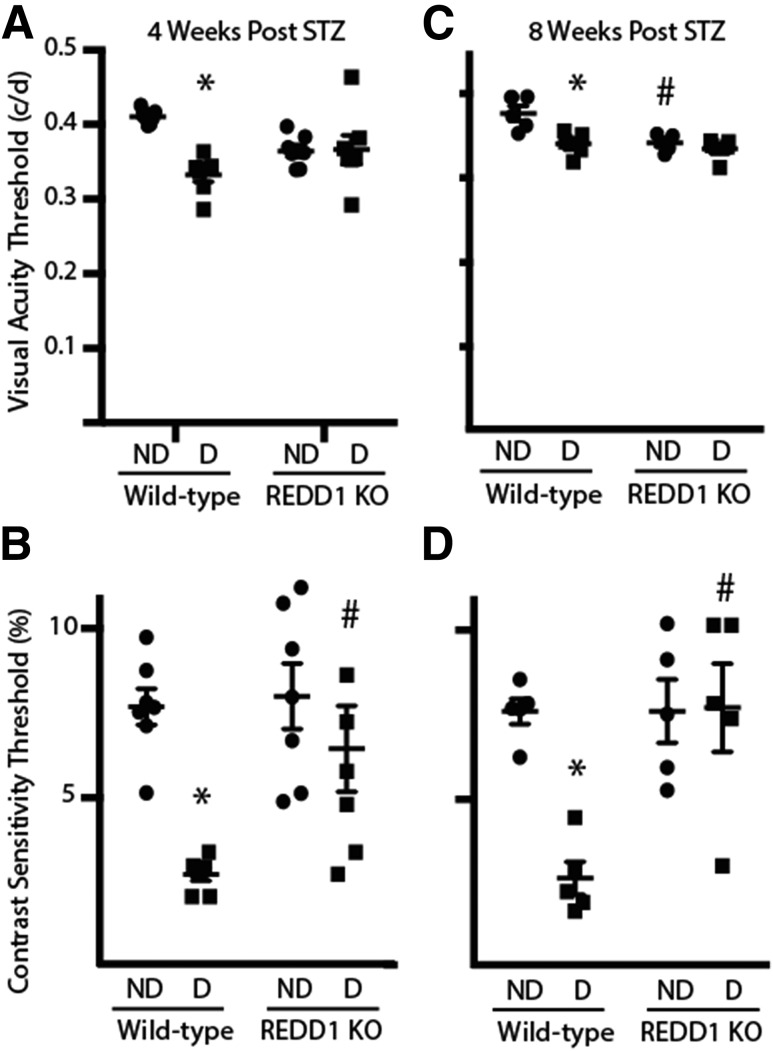
Diabetes-induced visual dysfunction is associated with significant neuroretinal cell death. The current study was designed to investigate the role of the Protein Regulated in Development and DNA Damage Response 1 (REDD1) in diabetes-induced retinal cell death and visual dysfunction. We recently demonstrated that REDD1 protein expression was elevated in response to hyperglycemia in the retina of diabetic rodents. REDD1 is an important regulator of Akt and mammalian target of rapamycin and as such plays a key role in neuronal function and survival. In R28 retinal cells in culture, hyperglycemic conditions enhanced REDD1 protein expression concomitant with caspase activation and cell death. By contrast, in REDD1-deficient R28 cells, neither hyperglycemic conditions nor the absence of insulin in culture medium were sufficient to promote cell death. In the retinas of streptozotocin-induced diabetic mice, retinal apoptosis was dramatically elevated compared with nondiabetic controls, whereas no difference was observed in diabetic and nondiabetic REDD1-deficient mice. Electroretinogram abnormalities observed in b-wave and oscillatory potentials of diabetic wild-type mice were also absent in REDD1-deficient mice. Moreover, diabetic wild-type mice exhibited functional deficiencies in visual acuity and contrast sensitivity, whereas diabetic REDD1-deficient mice had no visual dysfunction. The results support a role for REDD1 in diabetes-induced retinal neurodegeneration.
© 2017 by the American Diabetes Association.
Figures
Similar articles
-
Regulated in development and DNA damage 1 is necessary for hyperglycemia-induced vascular endothelial growth factor expression in the retina of diabetic rodents.J Biol Chem. 2015 Feb 6;290(6):3865-74. doi: 10.1074/jbc.M114.623058. Epub 2014 Dec 29. J Biol Chem. 2015. PMID: 25548280 Free PMC article.
-
REDD1 Activates a ROS-Generating Feedback Loop in the Retina of Diabetic Mice.Invest Ophthalmol Vis Sci. 2019 May 1;60(6):2369-2379. doi: 10.1167/iovs.19-26606. Invest Ophthalmol Vis Sci. 2019. PMID: 31141608 Free PMC article.
-
The stress response protein REDD1 promotes diabetes-induced oxidative stress in the retina by Keap1-independent Nrf2 degradation.J Biol Chem. 2020 May 22;295(21):7350-7361. doi: 10.1074/jbc.RA120.013093. Epub 2020 Apr 15. J Biol Chem. 2020. PMID: 32295843 Free PMC article.
-
The stress response protein REDD1 as a causal factor for oxidative stress in diabetic retinopathy.Free Radic Biol Med. 2021 Mar;165:127-136. doi: 10.1016/j.freeradbiomed.2021.01.041. Epub 2021 Jan 29. Free Radic Biol Med. 2021. PMID: 33524531 Free PMC article. Review.
-
Is REDD1 a Metabolic Éminence Grise?Trends Endocrinol Metab. 2016 Dec;27(12):868-880. doi: 10.1016/j.tem.2016.08.005. Epub 2016 Sep 6. Trends Endocrinol Metab. 2016. PMID: 27613400 Free PMC article. Review.
Cited by
-
mTORC1 and mTORC2 expression in inner retinal neurons and glial cells.Exp Eye Res. 2020 Aug;197:108131. doi: 10.1016/j.exer.2020.108131. Epub 2020 Jul 2. Exp Eye Res. 2020. PMID: 32622801 Free PMC article.
-
Activation of Disulfide Redox Switch in REDD1 Promotes Oxidative Stress Under Hyperglycemic Conditions.Diabetes. 2022 Dec 1;71(12):2764-2776. doi: 10.2337/db22-0355. Diabetes. 2022. PMID: 36170669 Free PMC article.
-
Blueberry Anthocyanins from Commercial Products: Structure Identification and Potential for Diabetic Retinopathy Amelioration.Molecules. 2022 Nov 2;27(21):7475. doi: 10.3390/molecules27217475. Molecules. 2022. PMID: 36364301 Free PMC article.
-
Transcriptome analysis of peripheral blood mononuclear cells in patients with type 1 diabetes mellitus.Endocrine. 2022 Nov;78(2):270-279. doi: 10.1007/s12020-022-03163-z. Epub 2022 Aug 17. Endocrine. 2022. PMID: 35976509
-
Visual Dysfunction in Diabetes.Annu Rev Vis Sci. 2023 Sep 15;9:91-109. doi: 10.1146/annurev-vision-111022-123810. Epub 2023 May 10. Annu Rev Vis Sci. 2023. PMID: 37164027 Free PMC article. Review.
References
-
- Ghirlanda G, Di Leo MA, Caputo S, Cercone S, Greco AV. From functional to microvascular abnormalities in early diabetic retinopathy. Diabetes Metab Rev 1997;13:15–35 - PubMed
-
- Han Y, Bearse MA Jr, Schneck ME, Barez S, Jacobsen CH, Adams AJ. Multifocal electroretinogram delays predict sites of subsequent diabetic retinopathy. Invest Ophthalmol Vis Sci 2004;45:948–954 - PubMed
-
- Barber AJ, Nakamura M, Wolpert EB, et al. . Insulin rescues retinal neurons from apoptosis by a phosphatidylinositol 3-kinase/Akt-mediated mechanism that reduces the activation of caspase-3. J Biol Chem 2001;276:32814–32821 - PubMed
Publication types
MeSH terms
Substances
Grants and funding
LinkOut - more resources
Full Text Sources
Other Literature Sources
Medical
Molecular Biology Databases
Research Materials
