. 2017 Oct 26;7(1):14167.
doi: 10.1038/s41598-017-14326-8.

Methods to Evaluate Cell Growth, Viability, and Response to Treatment in a Tissue Engineered Breast Cancer Model

Affiliations

Methods to Evaluate Cell Growth, Viability, and Response to Treatment in a Tissue Engineered Breast Cancer Model

Kayla F Goliwas et al. Sci Rep. .

Abstract

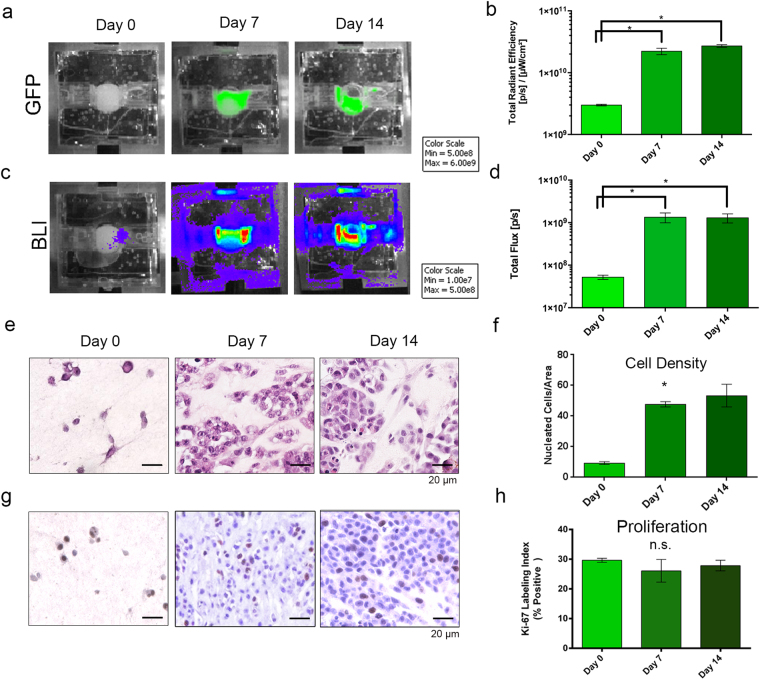
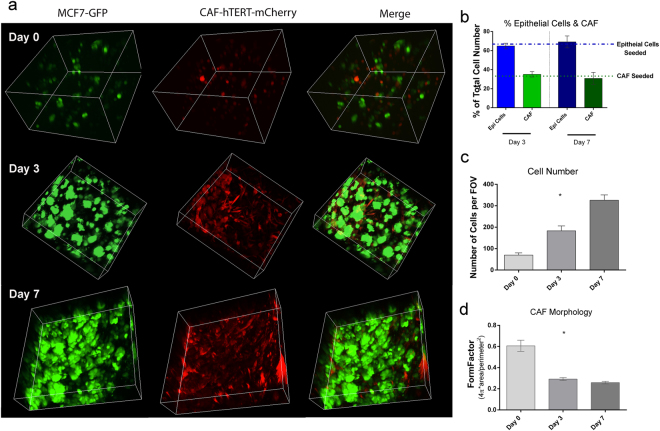
The use of in vitro, engineered surrogates in the field of cancer research is of interest for studies involving mechanisms of growth and metastasis, and response to therapeutic intervention. While biomimetic surrogates better model human disease, their complex composition and dimensionality make them challenging to evaluate in a real-time manner. This feature has hindered the broad implementation of these models, particularly in drug discovery. Herein, several methods and approaches for the real-time, non-invasive analysis of cell growth and response to treatment in tissue-engineered, three-dimensional models of breast cancer are presented. The tissue-engineered surrogates used to demonstrate these methods consist of breast cancer epithelial cells and fibroblasts within a three dimensional volume of extracellular matrix and are continuously perfused with nutrients via a bioreactor system. Growth of the surrogates over time was measured using optical in vivo (IVIS) imaging. Morphologic changes in specific cell populations were evaluated by multi-photon confocal microscopy. Response of the surrogates to treatment with paclitaxel was measured by optical imaging and by analysis of lactate dehydrogenase and caspase-cleaved cytokeratin 18 in the perfused medium. Each method described can be repeatedly performed during culture, allowing for real-time, longitudinal analysis of cell populations within engineered tumor models.


Conflict of interest statement

The authors declare that they have no competing interests.

Figures

Figure 1
Figure 1
Description of Tissue Engineered Models of Breast Cancer using a Perfusion Bioreactor System. (a) Image of the previous bioreactor showing PDMS flow channel containing PDMS foam backbone that hindered non-invasive imaging. (b) Top-view photograph of the current bioreactor system showing the optical clarity provided by the coverslips. (c) Cartoon representation of the updated breast cancer surrogate containing breast cancer epithelial cells (orange) and cancer associated fibroblasts (green) within a 3D volume of ECM (light pink), all housed within a PDMS bioreactor fabricated to include glass coverslips on the top and bottom surfaces (side view and top view showing microchannels). Surrogate volume (bottom) approximates the sizes of many human breast cancers. (d) Photomicrographs of H&E stained histologic sections (200x magnification) from an ER + surrogate (left, culture day 4), a TNBC surrogate (middle, culture day 7) and a human invasive breast cancer (right) demonstrating histologic similarity.
Figure 2
Figure 2
Correlation of Optical Imaging with Cell Concentration within Engineered TNBC Surrogates. (a,c) Fluorescence (GFP) & bioluminescence imaging (BLI) of increasing cell concentrations (TNBC model) on day 0. (b,d) Graphical representation of region of interest measurements (ROI) from GFP and BLI completed on the day of surrogate setup (day 0). R2 value obtained from correlation analysis of cell concentration seeded and imaging signal shows a strong correlation for both imaging methods (GFP: R2 = 0.974 (p = 0.013), BLI: R2 = 0.939 (p = 0.031), Pearson correlation coefficient). n = 3–6 replicate surrogates per cell concentration. Data in b & d represent mean ± SE.
Figure 3
Figure 3
Optical Imaging to Measure Cell Growth over Time. (a,c) Representative images of fluorescence (GFP) (a) and bioluminescence (c) imaging (BLI) over 14 days of culture (TNBC model). (b,d) ROI measurements from GFP and BLI images, respectively, showing increases in signals from day 0 to day 7 or 14 (Kruskal-Wallis test, p = 0.0002 (GFP) & p = 0.0003 (BLI)). (e) Photomicrographs of H&E-stained histologic sections from surrogates following 0 (left), 7 (middle), or 14 (right) days growth showing increased cell density after day 0 (200x magnification). (g) Photomicrographs of Ki-67 immunostaining (brown nuclei) following 0 (left), 7 (middle), and 14 (right) days growth indicating stable proliferation (200x magnification). (f) Measurement of cell density (number of nucleated cells per cross-sectional area) from H&E-stained histologic cross-sections of surrogates imaged for global GFP and BLI levels showing a similar trend as the optical imaging methods, with the majority of cell growth occurring over the first 7 days of culture (Kruskal-Wallis test, p = 0.039). (h) Ki-67 labeling index from surrogates imaged for global GFP and BLI levels show stable proliferation over the culture period (Kruskal-Wallis test, not significant). For optical imaging, n = 3–9 replicate surrogates per time point. Histologic analyses were completed on 3 replicate surrogates per time point. Data in b, d, f, & h represent mean ± SE.
Figure 4
Figure 4
Optical Imaging of Growth over Time in Primary Culture Models (IR-783). (a) Schematic of surrogate setup utilizing primary murine mammary tumors (MMTV-neu), including dissociation of 0.5 g of tumor with a sieve, incorporation of dissociated cells into ECM, and placement into the perfusion bioreactor system. (b) Representative images from IVIS imaging of IR-783 signal in two surrogates - at days 3 and 7, or days 3 and 12 of culture - showing a stable signal over the culture period. Some variability in signal between the two surrogates at day 3 can be explained by a difference in cellularity and cell distribution in the volume of tumor incorporated into each. (c) Photomicrographs of H&E stained sections (200x magnification) from imaged surrogates containing murine primary tumors demonstrating an epithelial morphology. (d) ROI measurements of near-IR signal on days 3, 7, and 12 indicating no significant change over time (Kruskal-Wallis test, p = 0.71). (e) Measurement of histologic cell density evaluated as the number of nucleated cells per cross-sectional area showing maintenance of cell number over time (Kruskal-Wallis test, p = 0.22). n = 6 surrogates per time point (obtained from 3 murine tumors, 2 surrogates per murine tumor. Data in d & e represent mean ± SE.
Figure 5
Figure 5
Confocal Microscopy to Evaluate Cellular Morphology and Population Dynamics. (a) Multiphoton confocal images (3D renderings) of ER+ tumor surrogates at days 0, 3, & 7, showing the GFP positive MCF-7 cells alone (green, left panels), the mCherry positive CAF-hTERT (red, middle panels), and both cell types together (merge, right panels) (250x magnification, 3D reconstructions are between 150 and 400 μm in thickness). (b) Epithelial to fibroblast ratio (green: red) was calculated from confocal maximum projections using CellProfiler and showed no significant change over time (Kruskal-Wallis test). The percentage of each cell population seeded (initial E:F = 2:1) is indicated by the dashed lines. (c) Total cell number (epithelial cells and CAF) was calculated from confocal maximum projections using CellProfiler and demonstrated an increase over time (Kruskal-Wallis test, p < 0.001, n = 4–7 FOV). (d) FormFactor, a measure of cellular circularity was calculated from confocal images using CellProfiler, with changes in CAF over time indicating cellular elongation (Kruskal-Wallis test, p < 0.0001, n = 4–7 FOV). Data in (bd) represent mean ± SEM.
Figure 6
Figure 6
Measurement of Cell Death in Response to Therapeutic Intervention: (a) Treatment schematic utilized in TNBC surrogates. (b) Representative images of IVIS imaging (GFP (left) and BLI (right)), on days 1, 3, 9, and 11 of culture with lower signals in treated surrogates compared to control surrogates on days 9 and 11. Images obtained using the same color scale (minimum and maximum epi-fluoresence or bioluminescence measurements) at each time point. (c) ROI measurement of GFP in treated and control surrogates (signal in treated surrogates is normalized to the average signal of control surrogates at each time point) over time confirming lower signals at days 9 and 11 in treated surrogates (Kruskal-Wallis test, p = 0.0009 at days 9 and 11. n = 5–10 replicate surrogates per time point per condition). (d) ROI measurement of BLI in treated and control surrogates (signal in treated surrogates is normalized to the average signal of control surrogates at each time point) confirming lower signals at days 9 and 11 in treated surrogates (Kruskal-Wallis test, p = 0.0188 at days 9 and 11. n = 5–10 replicate surrogates per time point per condition). (e) Photomicrographs of H&E stained histologic sections from day 11, control (top) and treated (bottom) demonstrating cell enlargement, atypical mitotic figures and multinucleation (arrows) in treated surrogates consistent with the effect of paclitaxel (200x magnification). (f) Photomicrographs of cleaved caspase 3 immunohistochemical staining (brown nuclei) at day 11, control (top) and treated (bottom), showing more apoptosis in treated surrogates (200x magnification). (g) Measurement of cell density from histologic cross-sections shows decreased cellularity in treated versus control surrogates at day 11 (Kruskal-Wallis test, p = 0.0159, n = 4 per condition). (h) Measurement of apoptotic index, determined from cleaved caspase 3 staining, is greater in treated than control surrogates at day 11 (Kruskal-Wallis test, p = 0.0006, n = 4 per condition). Data in (c,d,g,h) represent mean ± SE.
Figure 7
Figure 7
Perfusate Measurements of Cell Death in Response to Paclitaxel Treatment. (a) LDH assay results (total cytotoxicity) following treated and control TNBC surrogates over 24 hours (following the third treatment) showing an increase in cell death in treated surrogates compared to controls 24 hours post treatment. Data are the value at time 0 (T0) subtracted from all other time points (Tx) (Kruskal-Wallis test, p = 0.0009, n = 4 per condition). (b) CCK18 ELISA results show increased epithelial apoptotic cell death at day 9 (following the third treatment) in treated compared to control TNBC surrogates (data for treated surrogates is normalized to controls) (Kruskal-Wallis test, p < 0.0001, n = 5–9 per condition, per time point). Data represent mean ± SE.

Similar articles

Cited by

References

    1. Benam KH, et al. Engineered in vitro disease models. Annual Review of Pathology. 2015;10:195–262. doi: 10.1146/annurev-pathol-012414-040418. - DOI - PubMed
    1. Levinger I, Ventura Y, Vago R. Life is three dimensional-as in vitro cancer cultures should be. Adv Cancer Res. 2014;121:383–414. doi: 10.1016/B978-0-12-800249-0.00009-3. - DOI - PubMed
    1. Lovitt CJ, Shelper TB, Avery VM. Advanced cell culture techniques for cancer drug discovery. Biology (Basel) 2014;3:345–367. - PMC - PubMed
    1. Burdett E, Kasper FK, Mikos AG, Ludwig JA. Engineering tumors: a tissue engineering perspective in cancer biology. Tissue Eng Part B Rev. 2010;16:351–359. doi: 10.1089/ten.teb.2009.0676. - DOI - PubMed
    1. Nam KH, Smith AS, Lone S, Kwon S, Kim DH. Biomimetic 3D Tissue Models for Advanced High-Throughput Drug Screening. J Lab Autom. 2015;20:201–215. doi: 10.1177/2211068214557813. - DOI - PMC - PubMed

Publication types

MeSH terms