. 2017 Oct 26;8(1):1133.
doi: 10.1038/s41467-017-01270-4.

Examining the human infectious reservoir for Plasmodium falciparum malaria in areas of differing transmission intensity

Affiliations

Examining the human infectious reservoir for Plasmodium falciparum malaria in areas of differing transmission intensity

Bronner P Gonçalves et al. Nat Commun. .

Abstract

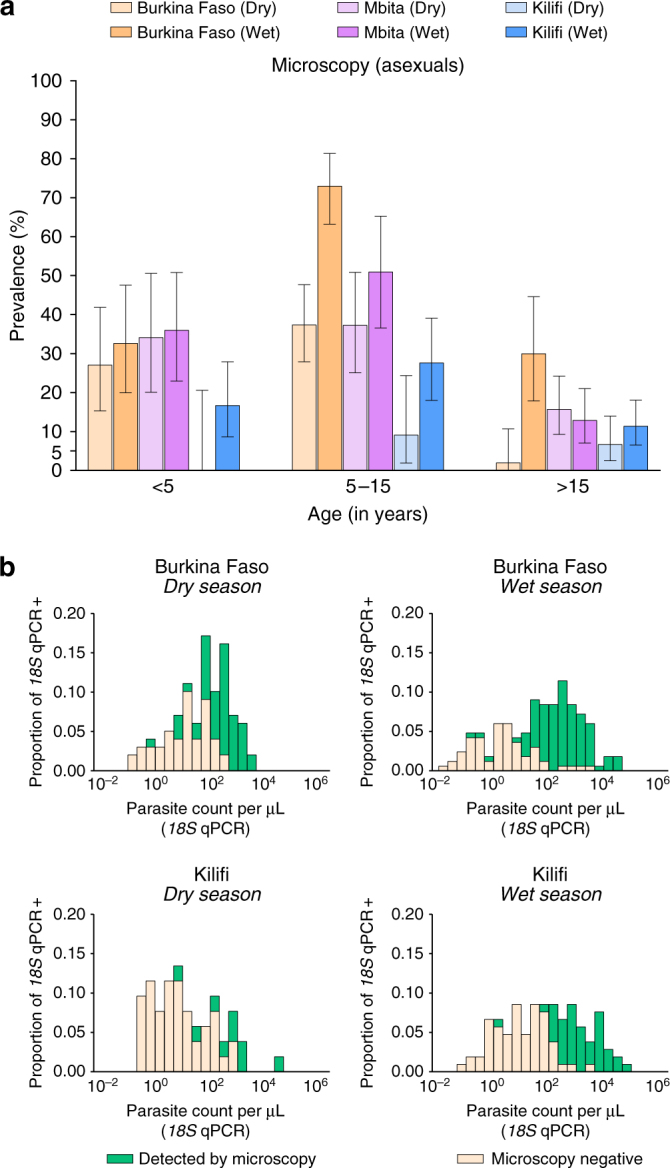
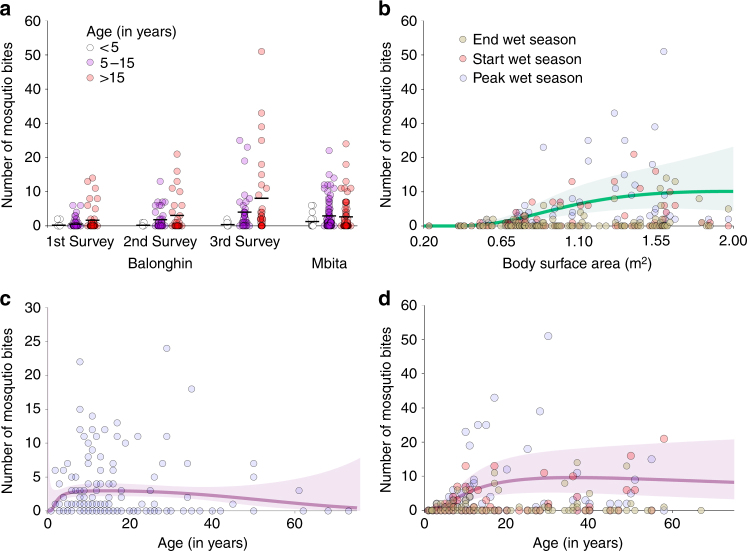
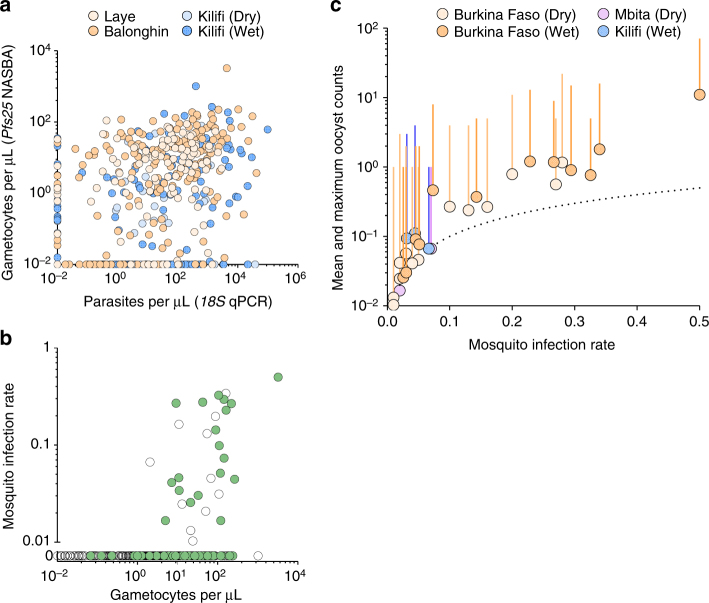
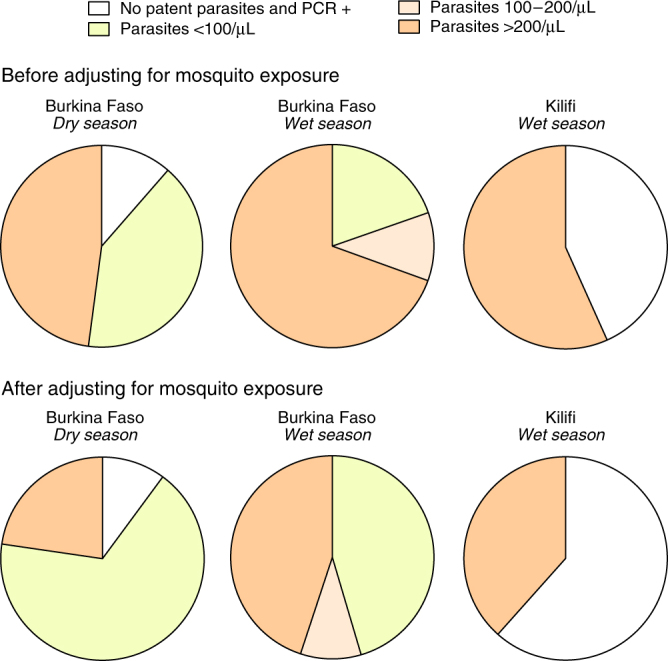
A detailed understanding of the human infectious reservoir is essential for improving malaria transmission-reducing interventions. Here we report a multi-regional assessment of population-wide malaria transmission potential based on 1209 mosquito feeding assays in endemic areas of Burkina Faso and Kenya. Across both sites, we identified 39 infectious individuals. In high endemicity settings, infectious individuals were identifiable by research-grade microscopy (92.6%; 25/27), whilst one of three infectious individuals in the lowest endemicity setting was detected by molecular techniques alone. The percentages of infected mosquitoes in the different surveys ranged from 0.05 (4/7716) to 1.6% (121/7749), and correlate positively with transmission intensity. We also estimated exposure to malaria vectors through genetic matching of blood from 1094 wild-caught bloodfed mosquitoes with that of humans resident in the same houses. Although adults transmitted fewer parasites to mosquitoes than children, they received more mosquito bites, thus balancing their contribution to the infectious reservoir.


Conflict of interest statement

The authors declare no competing financial interests.

Figures

Fig. 1
Fig. 1
Age-specific asexual stage parasites prevalence by microscopy (a) and distributions of parasite densities (b) by study site. In a, 95% exact binomial confidence intervals are presented for microscopy-based parasite prevalence estimates. All participants, except three children in Laye and one in Balonghin, had microscopy results available; numbers of study subjects by age group and survey are presented in Table 1. In b, parasite densities quantified by DNA-based 18S qPCR are presented (log10 scale) for both patent and subpatent infections. This panel only includes 18S qPCR-positive samples (100, 166, 52 and 105 in Burkina Faso dry and wet season surveys, and Kilifi dry and wet season surveys, respectively)
Fig. 2
Fig. 2
Mosquito exposure by age and body surface area. In a, the number of mosquito bites for each age group and survey is presented; each circle represents a study participant, and the mean number of mosquito bites per individual by age group is represented by horizontal black lines. In bd, fractional polynomials were used to determine the models that best describe the relationships between mosquito bites and age in Mbita (c) and Balonghin (d) and mosquito bites and body surface area calculated using Dubois equation (b, data from Balonghin). The lines in bd represent predicted numbers of mosquito bites per individual based on selected models (see ‘Methods’ section). The green (b) and purple (c, d) areas represent 95% confidence intervals
Fig. 3
Fig. 3
Associations between gametocyte and parasite densities, gametocyte density and infectivity, and mosquito infection prevalence and infection burden. In a, the association between gametocyte and parasite densities is shown; the y axis is on log10 scale and parasite (18S qPCR) and gametocyte (Pfs25 mRNA quantitative nucleic acid sequence-based amplification (QT-NASBA)) densities were set to 0.01 parasites (or gametocytes) per µL for negative samples to be included in this panel. In b, the proportion of mosquitoes infected in individual feeding experiments (y axis) and gametocytes densities (x axis) are shown. Data from all surveys are presented: gametocytes densities were quantified by Pfs25 mRNA QT-NASBA in samples collected in Burkina Faso and Kilifi, and by microscopy for Mbita participants. Green circles correspond to samples with patent gametocytes. Both the x axis and the segment of the y axis that ranges from 0.01 to 1 are in log10-scale. Individuals who did not infect mosquitoes are presented in a separate segment of y axis that only includes the 0 y coordinate. One infectious individual from Mbita who infected 4/60 mosquitoes had no gametocytes detected by microscopy and no available sample for molecular assays and is therefore not represented in the graph. In c, mean and maximum (vertical line) oocyst counts per assay in experiments with at least one mosquito infection are presented. The dotted line represents the hypothetical situation if all infected mosquitoes in an experiment would have exactly one oocyst. In b, c, feeding experiments where participants had evidence of non-falciparum malaria infections were excluded
Fig. 4
Fig. 4
Proportion of infected mosquitoes by parasite density. Age-specific prevalences of falciparum malaria parasites by microscopy and PCR and infectiousness prevalences by microscopy-defined parasite density were used to estimate the proportions of P. falciparum infected mosquitoes in each community; demographic age structure in Sub-Saharan Africa populations was used to standardise estimates. Individuals with evidence of non-falciparum malaria infections were excluded (N = 2). The top panels represent the contributions of human infections with different parasite densities to local mosquito infections, after adjusting for population age structure and age-and-parasite density-specific probabilities of mosquito infection in feeding assays; in the bottom panels, age-specific relative mosquito exposure data were used. These calculations were based on 13, 12 and 3 infectious individuals and 108, 104 and 4 infected mosquitoes in the Burkina Faso dry and wet season surveys and in the Kilifi wet season survey, respectively. Data from Mbita are not presented as most infectious individuals in this setting had P. malariae co-infections

References

    1. Lloyd-Smith JO, Schreiber SJ, Kopp PE, Getz WM. Superspreading and the effect of individual variation on disease emergence. Nature. 2005;438:355–359. doi: 10.1038/nature04153. - DOI - PMC - PubMed
    1. Galvani AP, May RM. Epidemiology: dimensions of superspreading. Nature. 2005;438:293–295. doi: 10.1038/438293a. - DOI - PMC - PubMed
    1. Bhattarai A, et al. Impact of artemisinin-based combination therapy and insecticide-treated nets on malaria burden in Zanzibar. PLoS Med. 2007;4:e309. doi: 10.1371/journal.pmed.0040309. - DOI - PMC - PubMed
    1. Barnes KI, et al. Effect of artemether-lumefantrine policy and improved vector control on malaria burden in KwaZulu-Natal, South Africa. PLoS Med. 2005;2:e330. doi: 10.1371/journal.pmed.0020330. - DOI - PMC - PubMed
    1. Ashley EA, et al. Spread of artemisinin resistance in Plasmodium falciparum malaria. N. Engl. J. Med. 2014;371:411–423. doi: 10.1056/NEJMoa1314981. - DOI - PMC - PubMed

Publication types