. 2017 Sep 22:11:82.
doi: 10.3389/fnana.2017.00082. eCollection 2017.

The Role of Functional Neuroanatomy of the Lumbar Spinal Cord in Effect of Epidural Stimulation

Affiliations

The Role of Functional Neuroanatomy of the Lumbar Spinal Cord in Effect of Epidural Stimulation

Carlos A Cuellar et al. Front Neuroanat. .

Abstract

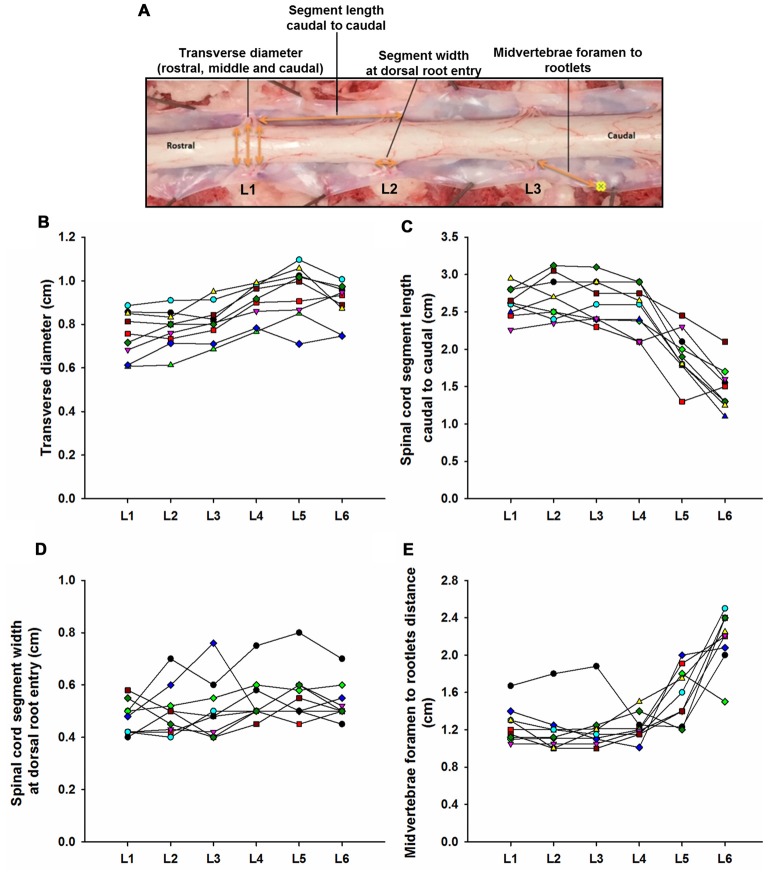
In this study, the neuroanatomy of the swine lumbar spinal cord, particularly the spatial orientation of dorsal roots was correlated to the anatomical landmarks of the lumbar spine and to the magnitude of motor evoked potentials during epidural electrical stimulation (EES). We found that the proximity of the stimulating electrode to the dorsal roots entry zone across spinal segments was a critical factor to evoke higher peak-to-peak motor responses. Positioning the electrode close to the dorsal roots produced a significantly higher impact on motor evoked responses than rostro-caudal shift of electrode from segment to segment. Based on anatomical measurements of the lumbar spine and spinal cord, significant differences were found between L1-L4 to L5-L6 segments in terms of spinal cord gross anatomy, dorsal roots and spine landmarks. Linear regression analysis between intersegmental landmarks was performed and L2 intervertebral spinous process length was selected as the anatomical reference in order to correlate vertebral landmarks and the spinal cord structures. These findings present for the first time, the influence of spinal cord anatomy on the effects of epidural stimulation and the role of specific orientation of electrodes on the dorsal surface of the dura mater in relation to the dorsal roots. These results are critical to consider as spinal cord neuromodulation strategies continue to evolve and novel spinal interfaces translate into clinical practice.

Keywords: epidural stimulation; functional neuroanatomy; neuromodulation; spinal cord; swine.


Figures

Figure 1
Figure 1
Swine’s lumbar spinal cord anatomy. (A) Depiction of the spinal cord anatomical landmarks identified in this study: transverse diameter, segment length caudal to caudal, segment width at dorsal root entry and midvertebrae foramen to rootlets. Data per specimen (n = 9) across lumbar segments is shown for (B) spinal cord transverse diameter, (C) segment length (caudal to caudal root distance), (D) segment width at dorsal root entry zone and (E) midvertebrae foramen to rootlets distance.
Figure 2
Figure 2
Dorsal root anatomy of the swine’s lumbar spinal cord. (A) Dorsal roots orientation in the swine lumbar spinal cord (Th14/15-L6 segments). Note the changes in orientation of angles, from rostral to caudal segments, denoted by dotted lines. Changes in dorsal root caudal angles are more evident in L4-L6. (B) Dorsal spinal cord anatomical measurements and dorsal rootlets count (inset). (C) Rostral (black dots) and caudal (white dots) dorsal root angles (mean ± SD; n = 5). (D) Rostral (black dots) and caudal (white dots) root lengths (Mean ± SD; n = 5). Data per specimen across lumbar segments is shown for: (E) number of dorsal rootlets (n = 9), (F) root width from bone (n = 6), (G) width across dorsal columns (n = 7) and (H) rostral root-caudal root length (n = 6).
Figure 3
Figure 3
Swine’s lumbar spine anatomy. (A) Vertebral landmark measurements. Data per specimen (n = 9) across Th14/Th15-L1 to L5-L6 intersegments is shown for: (B) intervertebral length, (C) intervertebral spinous process lengths, (D) midvertebrae foramen length and (E) vertebral bone length.
Figure 4
Figure 4
Intersegmental relationship between the spine and spinal cord. (A) Ratios between the intervertebral spinous process length at L2 vertebra and the spinal cord segments lengths from L1 to L6 vertebras (black line and circles). The ratios between the intervertebral spinous process lengths across lumbar segments and the L2 intervertebral spinous process length (blue line and squares), as well as the ratios between the spinal cord segments lengths and L2 spinal cord segment length are also shown (red line and diamonds). (B) Schematic representation of intervertebral spinous process lengths (top diagram and blue palette rectangles) and spinal cord segment lengths (bottom diagram and red palette rectangles) showing the segmental correspondence between them. Mean lengths (±SD, black bars) are expressed as percentage of the L2 intervertebral spinous process length (100%). The thick red lines on the spinal cord diagram represent the segment sizes at dorsal root entries expressed as percentage respect to L2 intervertebral spinous process length. Dorsal root mean angles (rostral and caudal) are also shown (thin red lines).
Figure 5
Figure 5
Epidural electrical stimulation (EES) evoked motor responses. (A) Early response (ER) and middle response (MR) representative responses recorded in BF, TA and SOL muscles at different stimulation intensities (1.75–3.5 mA) in subject 2 using the multi-contact rod array. Each trace is the average of ten motor evoked responses. Dotted lines indicate the beginning of the first deflection corresponding to ER. Continuous lines indicate MR. Examples of the peak-to-peak amplitude measurements for both ER and MR are shown at the bottommost traces (3.5 mA). (B) Recruitment curves showing ER (black dots) and MR (white dots) responses as shown in (A). Note the different scales. Abbreviations: BF, Biceps femoris; TA, tibialis anterior and SOL, soleus.
Figure 6
Figure 6
Motor responses during EES at L1-L3/L4. (A) Upper panel shows the electrode positions (single spherical electrode) over dorsal root entries zones (at L1, L2 and L3) and between segments (at L1-L2, L2-L3 and L3-L4) in subject 1. Amplitude of the motor evoked potentials is expressed as % (±SEM). Responses were recorded in proximal (upper plot) and distal muscles (bottom plot). (B) Representative averaged traces of motor potentials (gray rectangles, 10 ms time window) evoked at 1.4 mA. Each trace represents the average of ten motor responses. The electrode was placed on dorsal roots (L3, left traces) and between segments (L3-L4, right traces). Mean latencies (±SD) of the first (red bar) and second peak (black bar) are shown below the traces on left for each muscle. (See “Materials and Methods” Section, Electrophysiological Recordings, for details). Abbreviations: TA, tibialis anterior; GAS, medial gastrocnemius; SOL, soleus; GLU, gluteus; RF, rectus femoris and BF, biceps femoris.
Figure 7
Figure 7
Motor responses during EES at L4-L6. (A) The multi-array rod electrode (8-contacts rod array, Model 3874, Medtronic, MN, USA) was placed on the midline of the spinal cord at the dorsal rootlets entry levels (L4, L5 and L6) and in approximate locations between the segments (L4-L5 and L5-L6) in subject 2. Gray rectangles in the upper diagram represent the relative position of the multi-array rod electrode. Amplitude of the motor evoked responses is expressed as % (±SEM). Responses were recorded in proximal (upper plot) and distal muscles (bottom plot). (B) Representative averaged traces of motor responses (gray rectangles, 10 ms time window) evoked at 1.4 mA. The electrode was located proximal to L6 dorsal root entry zone (left traces) and in the intersegmental location L4-L5 (right traces). Electromyography (EMG)’s of distal and proximal muscles were recorded. Each trace represents the average of ten motor responses. Mean latencies (±SD) of the first (red bar) and second peak (black bar) are shown below traces on left for each muscle. (See “Materials and Methods” Section, Electrophysiological Recordings, for details). Abbreviations: TA, tibialis anterior; GAS, medial gastrocnemius; SOL, soleus; GLU, gluteus; RF, rectus femoris and BF, biceps femoris.

References

    1. Angeli C. A., Edgerton V. R., Gerasimenko Y. P., Harkema S. J. (2014). Altering spinal cord excitability enables voluntary movements after chronic complete paralysis in humans. Brain 137, 1394–1409. 10.1093/brain/awu038 - DOI - PMC - PubMed
    1. Barolat G. (1998). Epidural spinal cord stimulation: anatomical and electrical properties of the intraspinal structures relevant to spinal cord stimulation and clinical correlations. Neuromodulation 1, 63–71. 10.1111/j.1525-1403.1998.tb00019.x - DOI - PubMed
    1. Bozkus H., Crawford N. R., Chamberlain R. H., Valenzuela T. D., Espinoza A., Yüksel Z., et al. . (2005). Comparative anatomy of the porcine and human thoracic spines with reference to thoracoscopic surgical techniques. Surg. Endosc. 19, 1652–1665. 10.1007/s00464-005-0159-9 - DOI - PubMed
    1. Busscher I., Ploegmakers J. J. W., Verkerke G. J., Veldhuizen A. G. (2010). Comparative anatomical dimensions of the complete human and porcine spine. Eur. Spine J. 19, 1104–1114. 10.1007/s00586-010-1326-9 - DOI - PMC - PubMed
    1. Capogrosso M., Wenger N., Raspopovic S., Musienko P., Beauparlant J., Luciani L. B., et al. . (2013). Computational model for epidural electrical stimulation of spinal sensorimotor circuits. J. Neurosci. 33, 19326–19340. 10.1523/jneurosci.1688-13.2013 - DOI - PMC - PubMed

LinkOut - more resources