. 2017 Oct 12:8:703.
doi: 10.3389/fphar.2017.00703. eCollection 2017.

High Yield of Adult Oligodendrocyte Lineage Cells Obtained from Meningeal Biopsy

Affiliations

High Yield of Adult Oligodendrocyte Lineage Cells Obtained from Meningeal Biopsy

Sissi Dolci et al. Front Pharmacol. .

Abstract

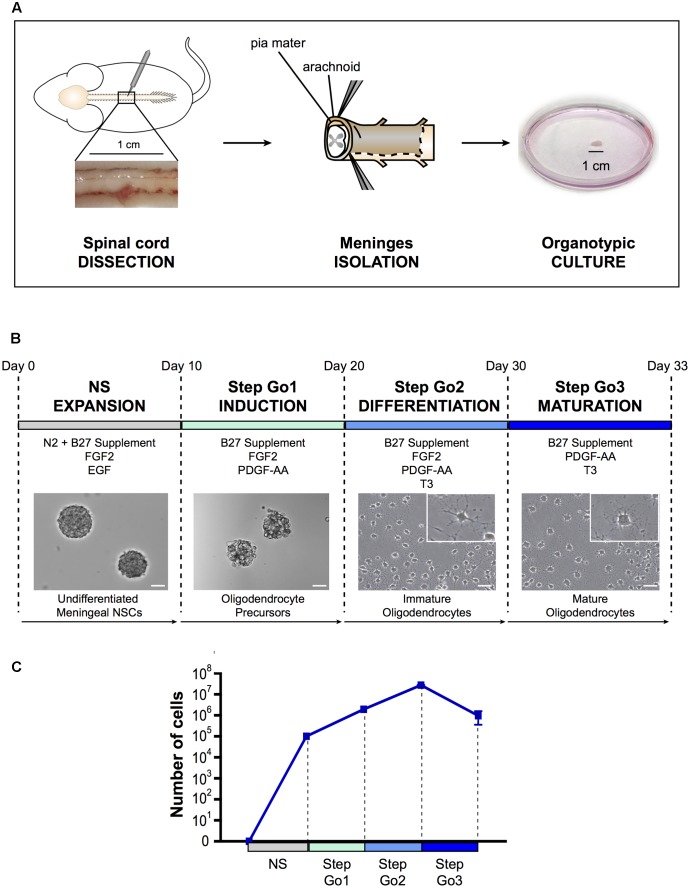
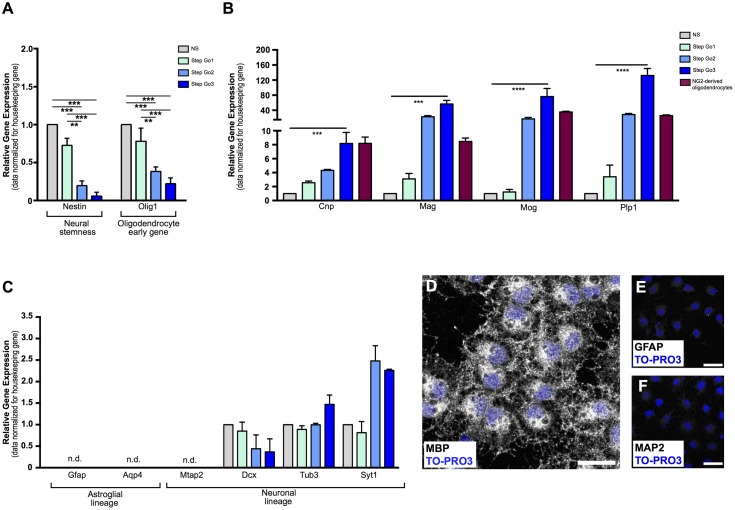
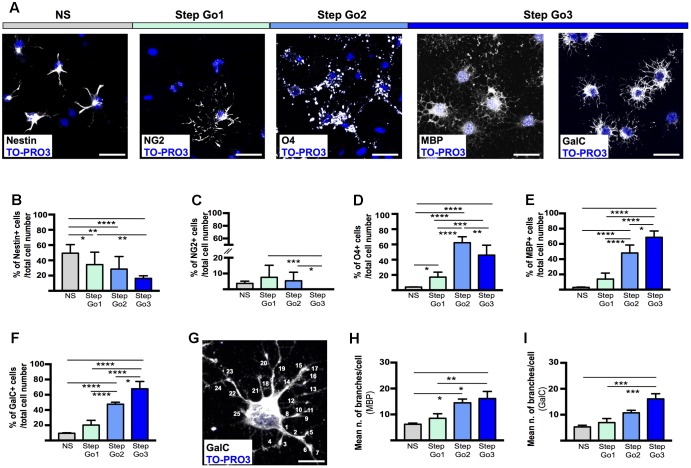
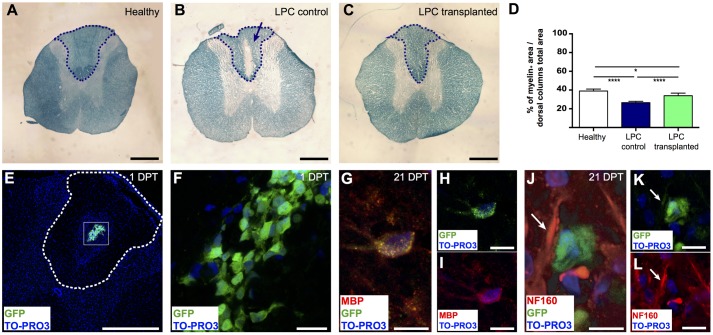
Oligodendrocyte loss can lead to cognitive and motor deficits. Current remyelinating therapeutic strategies imply either modulation of endogenous oligodendrocyte precursors or transplantation of in vitro expanded oligodendrocytes. Cell therapy, however, still lacks identification of an adequate source of oligodendrocyte present in adulthood and able to efficiently produce transplantable cells. Recently, a neural stem cell-like population has been identified in meninges. We developed a protocol to obtain high yield of oligodendrocyte lineage cells from one single biopsy of adult rat meningeal tissue. From 1 cm2 of adult rat spinal cord meninges, we efficiently expanded a homogenous culture of 10 millions of meningeal-derived oligodendrocyte lineage cells in a short period of time (approximately 4 weeks). Meningeal-derived oligodendrocyte lineage cells show typical mature oligodendrocyte morphology and express specific oligodendrocyte markers, such as galactosylceramidase and myelin basic protein. Moreover, when transplanted in a chemically demyelinated spinal cord model, meningeal-derived oligodendrocyte lineage cells display in vivo-remyelinating potential. This oligodendrocyte lineage cell population derives from an accessible and adult source, being therefore a promising candidate for autologous cell therapy of demyelinating diseases. In addition, the described method to differentiate meningeal-derived neural stem cells into oligodendrocyte lineage cells may represent a valid in vitro model to dissect oligodendrocyte differentiation and to screen for drugs capable to promote oligodendrocyte regeneration.

Keywords: adult neural stem cells; meningeal neural stem cells; meninges; myelin; oligodendrocyte differentiation; oligodendrocyte precursor cells; spinal cord.


Figures

FIGURE 1
FIGURE 1
Oligodendrocyte differentiation protocol. (A) Schematic representation of spinal cord meningeal biopsy isolation for organotypic culture. Spinal cord was dissected from adult SD rat and 1 cm of meningeal tissue was isolated and plated in neurosphere expansion medium (NS, day 0). (B) Time course representation of the oligodendrocyte differentiation protocol from spinal cord meningeal biopsy. From day 0 to day 10: neurosphere expansion (NS), from day 10 to day 20: oligosphere culture (Step Go1); from day 20 to day 30: oligodendrocyte differentiation (Step Go2); from day 30 to day 33: oligodendrocyte maturation (Step Go3). Images show meningeal-derived differentiating oligodendrocyte morphology at each stage of the protocol. Insets in (B) are higher magnification images of representative cells in the boxes. Pictures in (B) are brightfield images. (C) Number of meningeal-derived cells in culture, calculated for every experimental replicate (n = 4), present at each stage of the differentiation protocol. Data are presented as mean ± SEM. NSCs: neural stem cells; FGF2: human basic fibroblast growth factor; EGF: epidermal growth factor; PDGF-AA: platelet-derived growth factor type AA; T3: 3,3′,5-triiodo-L-thyronine. Scale bars: 50 μm.
FIGURE 2
FIGURE 2
Gene and protein analysis confirms differentiation of meningeal-derived NSCs into oligodendrocytes. (A) Relative gene expression analysis of meningeal-derived oligodendrocyte lineage cells shows significant decrease of the neural-stemness-related gene Nestin and the oligodendrocyte-specification gene Olig1 through the oligodendrocyte differentiation protocol. (B) Relative gene expression analysis of oligodendrocytes specific genes Cnp, Mag, Mog, and Plp1 in meningeal-derived differentiating oligodendrocytes at each step of the differentiation protocol and in NG2-derived oligodendrocytes. As expected, Step Go3 meningeal-derived oligodendrocyte lineage cells show significant increase of oligodendrocyte specific genes compared to meningeal-derived cells in NS. (C) Gene expression analysis of specific astroglial lineage genes (Gfap and Aqp4) and neuronal lineage genes, (Mtap2, Dcx, Tub3, and Syt1) in meningeal-derived differentiation oligodendrocytes at each step of the differentiation protocol. Gfap, Aqp4, and Mtap2 were not expressed at any step of the differentiation protocol, and were detected only after a high number of cycles (mean ΔCt: 17.2 ± 2.13 Gfap, 14.7 ± 1.66 Aqp4, and 13.89 ± 0.7 Mtap2). Dcx, Tub3, and Syt1 were expressed at lower level during all steps of the differentiation protocol. Gene expression levels were normalized to those of the housekeeping gene β-actin and are expressed as normalized to basal conditions (NS). (D–F) Immunofluorescence analysis, showing that by the end of the protocol the majority of the meningeal-derived oligodendrocytes express the specific marker of mature oligodendrocyte MBP (D), while none or rare cells express the specific astrocyte [GFAP, (E)] or neuronal [MAP2, (F)] markers. Data are presented as mean ± SEM; ∗∗∗∗p < 0.0001; ∗∗∗p < 0.001; ∗∗p < 0.01; p < 0.05; n.d., not detectable. Images are single plane confocal images. Cell nuclei are visualized by TO-PRO3 nuclear staining (blue). Scale bars: 25 μm.
FIGURE 3
FIGURE 3
Stage-specific oligodendrocyte differentiating marker expression. (A) Representative immunostaining images of meningeal-derived differentiating oligodendrocytes (white) at each stage of the differentiation protocol. In NS stage, meningeal-derived cells express the specific marker of stemness, nestin; in Step Go1, meningeal-derived cells express the specific marker of oligodendrocyte precursors, NG2; in Step Go2, meningeal-derived cells express the specific marker of immature oligodendrocytes, O4 and finally in Step Go3 meningeal-derived cells express specific markers of mature oligodendrocytes, MBP and GalC. (B–F) Graphs representing the percentage number of nestin+ (B), NG2+ (C), O4+ (D), MBP+ (E), and GalC+ (F) cells among the total counted cells at each stage of the oligodendrocyte differentiation protocol. In (B), nestin+ cells significantly decrease along the oligodendrocyte differentiation protocol (NS vs. Step Go1, NS vs. Step Go2, NS vs. Step Go3). In (C), NG2+ cells, increase from NS to Step Go1 and decrease in the following steps. In (D), O4+ cells peak at Step Go2 (Step Go2 vs. NS and Step Go2 vs. Step Go1). In (E,F), MBP+ and GalC+ cells significantly increase in Step Go3. (G–I) Representative immunostaining image (G) and quantification graphs of the mean number of cellular branches per cells (H,I) in Step Go3 cells, stained with specific markers for mature oligodendrocytes, MBP (H), and GalC (G,I). These data show that the number of branches significantly increases along the oligodendrocyte differentiation protocol and highlight the maturation of meningeal-derived oligodendrocytes obtained at Step Go3 (MBP: Step Go2 vs. NS, Step Go3 vs. NS, Step Go3 vs. Step Go1; GalC: Step Go3 vs. NS, Step Go3 vs. Step Go1). Quantitative data are mean ± SEM; ∗∗∗∗p < 0.0001; ∗∗∗p < 0.001; ∗∗p < 0.01; p < 0.05. All the images single plane confocal images. Cell nuclei are visualized by TO-PRO3 nuclear staining (blue). Scale bars: 25 μm.
FIGURE 4
FIGURE 4
Remyelinating potential of transplanted meningeal-derived oligodendrocytes. (A–C) Brightfield images of spinal cord transversal sections of healthy, LPC-control, and LPC-transplanted rats stained with specific myelin staining LFB. LFB allows the identification of the myelin content of the tissue (blue) from the demyelinated area (white). While spinal cord sections of healthy rat did not show any evidence of demyelination (A), spinal cord sections of LPC-control rats showed a focal demyelination in the injection sites, as indicated by the blue arrow (B). (C) Spinal cord sections of LPC-transplanted rats showed an higher intensity of the LFB staining around the injection site compared to LPC-control rat sections. (D) The graph represents the percentage of the myelin content in the dorsal column of the spinal cord sections of healthy (38.94% ± 1.2%), LPC-control (26.42% ± 0.6%), and LPC-transplanted (33.97% ± 1.1%) rats, calculated as myelin positive pixels in the dorsal column among the pixels of the total area of the dorsal column. The blue dashed lines in (A–C) indicate the dorsal column areas of the spinal cord sections of healthy, LPC-control, and LPC-transplanted rats, that represent the LPC-lesioned area considered for the myelin content quantification. The analysis shows that transplantation of meningeal-derived oligodendrocytes resulted in a significantly increased myelin content percentage in LPC-transplanted sections compared to LPC-controls sections. Quantitative data are expressed as means ± SEM; n = 3 in healthy animals, n = 6 in LPC animals; p ≤ 0.05, ∗∗∗∗p ≤ 0.0001. The average value was calculated for healthy control, LPC-control and LPC-transplanted rats (n ≥ 20 slices/animal). (E,F) Immunostaining for GFP (green) and TO-PRO3 nuclei (blue) in a spinal cord section of a LPC-transplanted rat at 1 DPT, showing that eGFP+ meningeal-derived oligodendrocytes were localized inside the spinal cord parenchyma close to the LPC lesion site. The white dashed line in (E) indicates the dorsal columns of the spinal cord, (F) is a higher magnification of the box in (E). (G-I) Immunostaining of a spinal cord section of a LPC-transplanted rat at 21 DPT, showing that eGFP+ meningeal-derived oligodendrocytes (green) co-express the specific marker for mature oligodendrocytes, MBP (red). Merged image in (G); GFP (green) and TO-PRO3 (blue) in (H); MBP (red) and TO-PRO3 (blue) in (I). (J–L) Immunostaining of a spinal cord section of a LPC-transplanted rat at 21 DPT, showing that eGFP+ meningeal-derived oligodendrocytes (green) are in close contact to the neuron neurofilament, stained with NF160 (white arrows in (J–L). Merged image in (J); GFP (green) and TO-PRO3 (blue) in (K); NF160 (red) and TO-PRO3 (blue) in (L). (E) and (F) are maximum Z-projection images of confocal images. Scale bars: 1 mm (A–C), 500 μm (E), 20 μm (F,H,I,K,L), 40 μm (G,J).

References

    1. Allen D. D., Caviedes R., Cárdenas A. M., Shimahara T., Segura-Aguilar J., Caviedes P. A. (2005). Cell lines as in vitro models for drug screening and toxicity studies. Drug Dev. Ind. Pharm. 31 757–768. 10.1080/03639040500216246 - DOI - PubMed
    1. Almazan G., Honegger P. F., Matthieu J. M. (1985). Triiodothyronine stimulation of oligodendroglial differentiation and myelination. A developmental study. Dev. Neurosci. 7 45–54. 10.1159/000112275 - DOI - PubMed
    1. Alsanie W. F., Niclis J. C., Petratos S. (2013). Human embryonic stem cell-derived oligodendrocytes: protocols and perspectives. Stem Cells Dev. 22 2459–2476. 10.1089/scd.2012.0520 - DOI - PMC - PubMed
    1. Baumann N., Pham-Dinh D. (2001). Biology of oligodendrocyte and myelin in the mammalian central nervous system. Physiol. Rev. 81 871–927. - PubMed
    1. Ben-David U., Benvenisty N. (2011). The tumorigenicity of human embryonic and induced pluripotent stem cells. Nat. Rev. Cancer 11 268–277. 10.1038/nrc3034 - DOI - PubMed