

Type 2 diabetes, socioeconomic status and life expectancy in Scotland (2012-2014): a population-based observational study
- PMID: 29075822
- PMCID: PMC6448945
- DOI: 10.1007/s00125-017-4478-x
Type 2 diabetes, socioeconomic status and life expectancy in Scotland (2012-2014): a population-based observational study
Abstract
Aims/hypothesis: The aim of this study was to assess the role of socioeconomic status (SES) in the associations between type 2 diabetes and life expectancy in a complete national population.
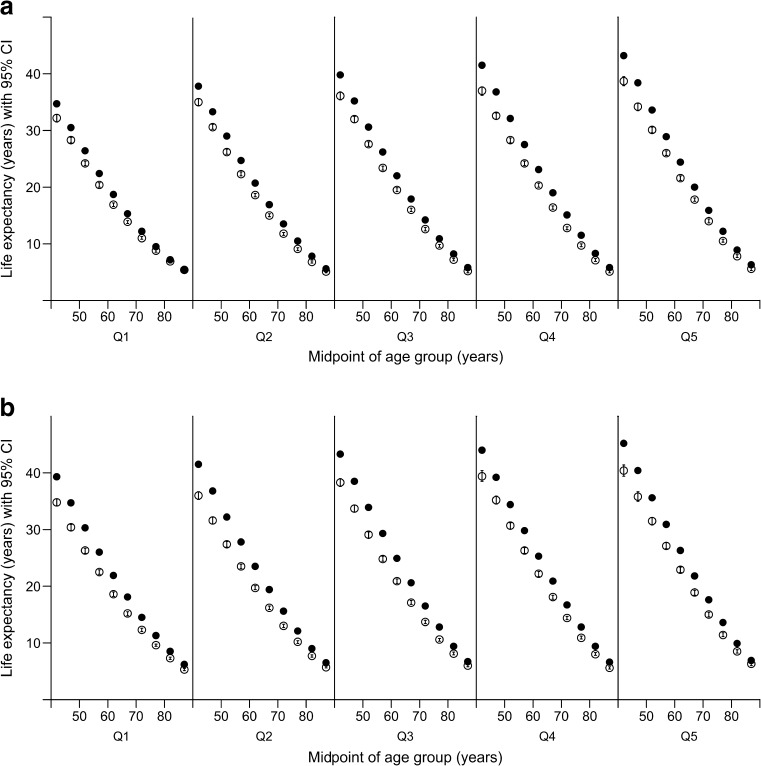
Methods: An observational population-based cohort study was performed using the Scottish Care Information - Diabetes database. Age-specific life expectancy (stratified by SES) was calculated for all individuals with type 2 diabetes in the age range 40-89 during the period 2012-2014, and for the remaining population of Scotland aged 40-89 without type 2 diabetes. Differences in life expectancy between the two groups were calculated.
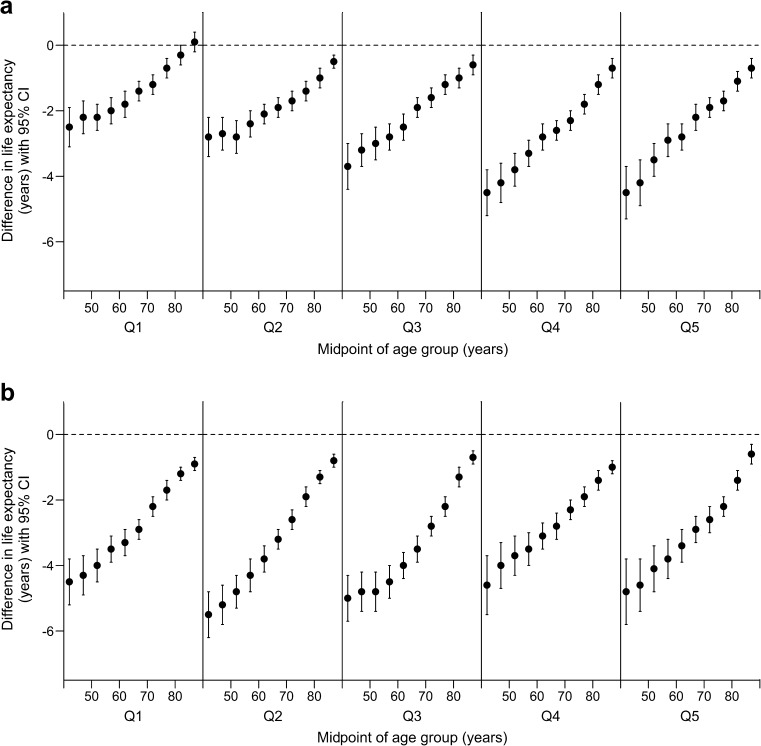
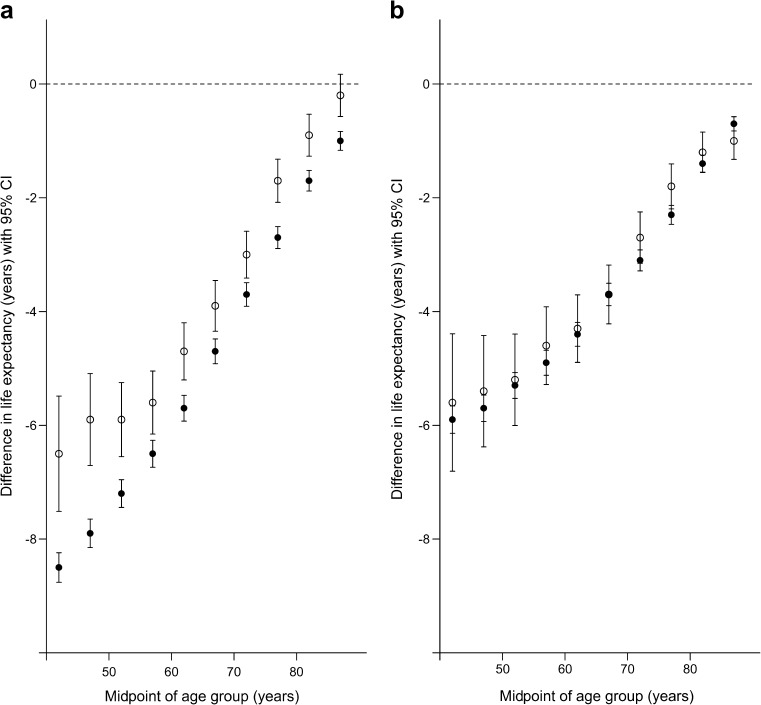
Results: Results were based on 272,597 individuals with type 2 diabetes and 2.75 million people without type 2 diabetes (total for 2013, the middle calendar year of the study period). With the exception of deprived men aged 80-89, life expectancy in people with type 2 diabetes was significantly reduced (relative to the type 2 diabetes-free population) at all ages and levels of SES. Differences in life expectancy ranged from -5.5 years (95% CI -6.2, -4.8) for women aged 40-44 in the second most-deprived quintile of SES, to 0.1 years (95% CI -0.2, 0.4) for men aged 85-89 in the most-deprived quintile of SES. Observed life-expectancy deficits in those with type 2 diabetes were generally greater in women than in men.
Conclusions/interpretation: Type 2 diabetes is associated with reduced life expectancy at almost all ages and levels of SES. Elimination of life-expectancy deficits in individuals with type 2 diabetes will require prevention and management strategies targeted at all social strata (not just deprived groups).
Keywords: Epidemiology; Life expectancy; Socioeconomic status; Type 2 diabetes.
Conflict of interest statement
Data availability
Diabetes data are available from the Health Informatics Centre at the University of Dundee but restrictions apply to the availability of these data, which were used under license for the current study, and so are not publicly available. Data are, however, available with permission of the Public Benefit and Privacy Panel for Health and Social Care of National Health Service National Services Scotland (NHSNSS).
Duality of interest
JW, SL and JP have no relationships or activities that could appear to have influenced the submitted work. HC reports grants and personal fees from Eli Lilly & Company, grants from Roche Pharmaceuticals, grants from Pfizer Inc., grants from Boehringer Ingelheim, and grants from AstraZeneca LP, outside the submitted work; HC is also a shareholder in Eli Lilly and Bayer. RM reports personal fees from NovoNordisk and from Sanofi, outside the submitted work. NS reports personal fees from Amgen, Sanofi, AstraZeneca, Merck, Boehringer Ingelheim, Eli Lilly, Janssen and from Novo Nordisk, outside the submitted work. SW reports grants from the Scottish Government during the conduct of the study, and an honorarium from Global MedEd/AstraZeneca, outside the submitted work.
Contribution statement
The overall design of the study was conceived by SW, based on a similar approach used previously by SL and HC. All authors provided critical input in the writing of the manuscript, contributed to the interpretation of findings and provided final approval for the version to be published. JW carried out the analysis and coordinated writing of the manuscript. SW is the guarantor of this work and, as such, had full access to all the data in the study and takes responsibility for the integrity of the data and the accuracy of the data analysis.
Figures
References
-
- Nwaneri C, Cooper H, Bowen-Jones D. Mortality in type 2 diabetes mellitus: magnitude of the evidence from a systematic review and meta-analysis. Br J Diabetes Vasc Dis. 2013;13:192–207. doi: 10.1177/1474651413495703. - DOI
Publication types
MeSH terms
LinkOut - more resources
Full Text Sources
Other Literature Sources
Medical
