Review
. 2018 Mar;125(3):565-574.
doi: 10.1007/s00702-017-1793-9. Epub 2017 Oct 26.

Reward and value coding by dopamine neurons in non-human primates

Affiliations
Review

Reward and value coding by dopamine neurons in non-human primates

Aydin Alikaya et al. J Neural Transm (Vienna). 2018 Mar.

Abstract

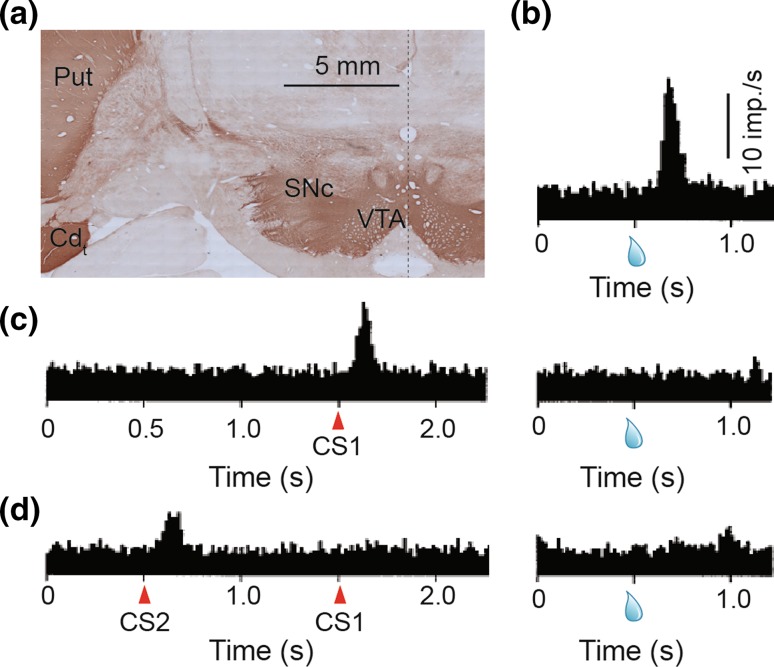
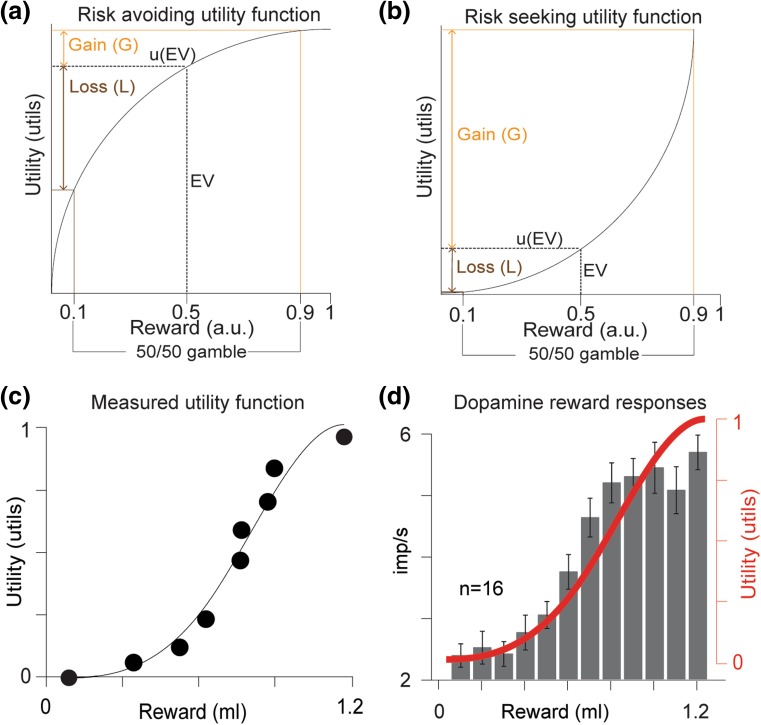
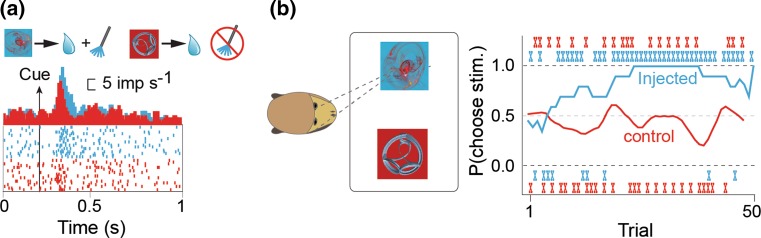
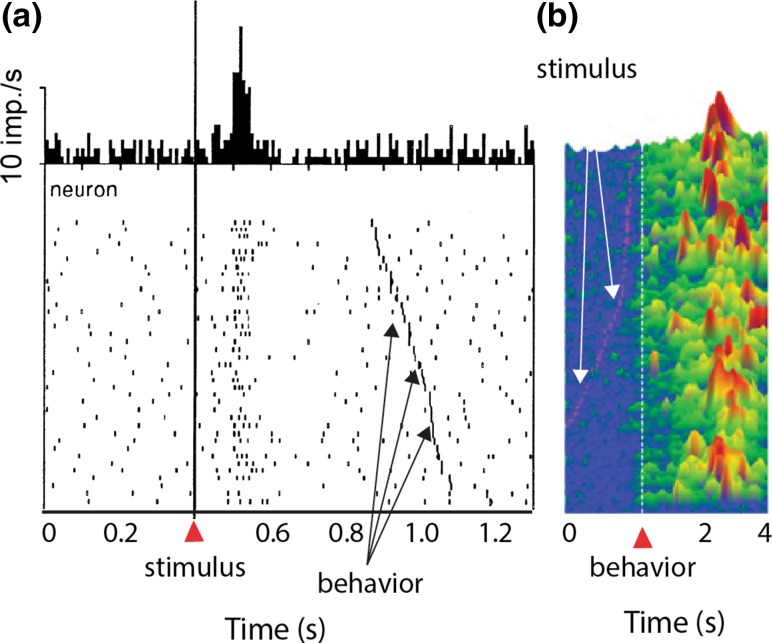
Rewards are fundamental to everyday life. They confer pleasure, support learning, and mediate decisions. Dopamine-releasing neurons in the midbrain are critical for reward processing. These neurons receive input from more than 30 brain areas and send widespread projections to the basal ganglia and frontal cortex. Their phasic responses are tuned to rewards. Specifically, dopamine signals code reward prediction error, the difference between received and predicted rewards. Decades of research in awake, behaving non-human primates (NHP), have shown the importance of these neural signals for learning and decision making. In this review, we will provide an overview of the bedrock findings that support the reward prediction error hypothesis and examine evidence that this signal plays a role in learning and decision making. In addition, we will highlight some of the conceptual challenges in dopamine neurophysiology and identify future areas of research to address these challenges. Keeping with the theme of this special issue, we will focus on the role of NHP studies in understanding dopamine neurophysiology and make the argument that primate models are essential to this line of research.

Keywords: Decision making; Dopamine; Learning; Monkey; NHP; Optogenetics; Reward prediction error; Value.


Figures

Fig. 1
Fig. 1
Dopamine anatomy and physiology. a Dopamine cell bodies in the VTA and SNc and dopamine terminals in the putamen and caudate tail are marked by brown DAB staining. Cd t caudate tail, Put putamen, SNc substantia nigra pars compacta, VTA ventral tegmental area. bd Dopamine responses code for reward prediction error. b Peri-stimulus time histogram (PSTH) of dopamine activity shows a strong response to unpredicted reward (indicated by the drop of juice). c PSTH of dopamine activity when a conditioned stimulus fully predicts reward. Dopamine neurons respond to the unpredictable onset of conditioned stimulus (CS1), but not to the fully predicted reward. d PSTH of dopamine activity when a high order conditioned stimulus (CS2) predicts the temporal onset of CS1 and delivery of reward. Dopamine neurons respond to unpredictable onset of CS2, but not to the fully predicted CS1 or reward. bd Adapted from Schultz et al. (1993)
Fig. 2
Fig. 2
Phasic dopamine responses code value. ab Example utility functions predict preferences between equi-probable (50:50) two outcome gambles (0.1, 0.9, arbitrary units) and the gambles’ expected values (EV) (0.5 a.u.). a Concave utility function indicates risk avoiding. b Convex utility function indicates risk seeking. Orange and brown two-sided arrows indicate the potential utility gain (G) and loss (L), respectively, relative to the utility of the expected value (uEV). For concave (risk avoiding) functions G < L, whereas for risk seeking (convex) functions G > L. c Measured utility function shows the utility of juice rewards. Convex regions of the utility (lower reward sizes) represent reward ranges, where the monkey was risk seeking. Concave regions (larger reward sizes) represent reward ranges, where the monkey was risk avoiding. Black dots represent points of subjective equivalence—termed certainty equivalents—between risky and safe rewards, measured through binary choices between risky and safe rewards. Solid line was fitted to the certainty equivalent data using cubic splines. d Dopamine neuron action potential responses are strongly correlated with the shape of the utility function. Action potentials were measured, while unpredicted rewards were delivered to the animals (sized 0.1–1.2 ml in 0.1 ml increments). Black bars represent impulse rate in a 500 ms window following reward. Error bars are SEM across 17 neurons. Red line represents utility functions and corresponds to secondary y-axis. c, d Adapted from Stauffer et al. (2014)
Fig. 3
Fig. 3
Optical stimulation of ChR2 expressing dopamine neurons leads to neuronal and behavioral correlates of value. a Top, monkeys viewed visual stimuli that predicted liquid reward delivered with (blue) or without (red) accompanying optical stimulation. a Bottom, larger neuronal response (blue) occurred to cues that predicted optical stimulation, compared to neuronal responses (red) to cues that did not predict optical stimulation. Blue raster plot and PSTH aligned onto the appearance of cues predicting reward plus optical stimulation. Red raster plot and PSTH aligned onto the appearance of cues predicting reward alone in the same neuron. b Monkeys made saccade guided choices between two visual cues (same reward scheme as in a). When the optical fiber was placed in the channelrhodopsin-infected hemisphere, monkeys learned to choose the cue that predicted optical stimulation, over the cue that did not predict optical stimulation (blue, ‘injected’). When the optical fiber was placed in the contralateral hemisphere, where no channelrhodopsin virus was injected, the monkeys continued to choose either option with equal frequency (red, ‘control). Thus, the monkeys’ choices indicated that optical stimulation added value. Two choice sessions are shown, one with the optical fiber in the infected hemisphere (blue) and one session with the optical fiber in the control, uninfected hemisphere (red). The ‘x’ indicates trial-by-trial choices in each session. The smoothed lines represent a running average of the choices (10 trial sliding window). This figure was adapted from Stauffer et al. (2016)
Fig. 4
Fig. 4
Temporal discrepancy between dopamine action potential responses recorded in the midbrain and dopamine release monitored in the striatum. a PSTH (top) and raster plot (bottom) of dopamine response to reward predicting cues. Responses were aligned onto cue onset (solid line). The time of movement onset during each trial is indicated by the dark hatches in the raster plot. This panel was adapted from (Schultz et al. 1993). b Profile of dopamine concentration change in the striatum of a rat after reward prediction. Dopamine concentration profiles are aligned to the time when the rats inserted their nose into a center port (white dashed lines). The time of instruction cues for each trial is indicated by the red ticks. This figure panel was adapted from Hamid et al. (2016)

References

    1. Acker L, Pino EN, Boyden ES, Desimone R. FEF inactivation with improved optogenetic methods. Proc Natl Acad Sci USA. 2016;113:E7297–E7306. - PMC - PubMed
    1. Aebischer P, Schultz W. The activity of pars compacta neurons of the monkey substantia nigra is depressed by apomorphine. Neurosci Lett. 1984;50:25–29. - PubMed
    1. Alexander GE, DeLong MR. Microstimulation of the primate neostriatum. I. Physiological properties of striatal microexcitable zones. J Neurophysiol. 1985;53:1401–1416. - PubMed
    1. Alexander GE, DeLong MR. Microstimulation of the primate neostriatum. II. Somatotopic organization of striatal microexcitable zones and their relation to neuronal response properties. J Neurophysiol. 1985;53:1417–1430. - PubMed
    1. Alexander GE, DeLong MR, Strick PL. Parallel organization of functionally segregated circuits linking basal ganglia and cortex. Annu Rev Neurosci. 1986;9:357–381. - PubMed

Publication types

LinkOut - more resources