Review
. 2017 Dec 19;18(1):27-40.
doi: 10.1039/c7lc01105a.

Micro free flow electrophoresis

Affiliations
Review

Micro free flow electrophoresis

Alexander C Johnson et al. Lab Chip. .

Abstract

Micro free-flow electrophoresis (μFFE) is a continuous separation technique in which analytes are streamed through a perpendicularly applied electric field in a planar separation channel. Analyte streams are deflected laterally based on their electrophoretic mobilities as they flow through the separation channel. A number of μFFE separation modes have been demonstrated, including free zone (FZ), micellar electrokinetic chromatography (MEKC), isoelectric focusing (IEF) and isotachophoresis (ITP). Approximately 60 articles have been published since the first μFFE device was fabricated in 1994. We anticipate that recent advances in device design, detection, and fabrication, will allow μFFE to be applied to a much wider range of applications. Applications particularly well suited for μFFE analysis include continuous, real time monitoring and microscale purifications.


Conflict of interest statement

Conflicts of Interest

There are no conflicts of interest to declare.

Figures

Figure 1
Figure 1
FFE separation mechanism. A sample is continuously introduced into the separation channel where it is exposed to a perpendicular electric field. Analyte streams are deflected according to their mobility. Adapted with permission from Fonslow, B. R.; Bowser, M. T. Anal Chem 2006, 78, 8236–8244. Copyright (2006) American Chemical Society.
Figure 2
Figure 2
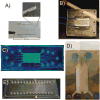
A) A Pyrex based μFFE device used for bacteria concentration. Adapted with permission from Ref. from the Royal Society of Chemistry. B) A Borofloat wafer based μFFE device created for bubble free electrophoresis. Adapted with permission from Ref. from the Royal Society of Chemistry. C) A glass slide μFFE device for the fluorescent determination of pIs in proteins. Adapted with permission from Ref. from the Royal Society of Chemistry. D) A Borofloat wafer based μFFE design for high peak capacity separations of peptides. Adapted with permission from Johnson, A. C.; Bowser, M. T. Anal. Chem. 2017, 89, 1665–1673. Copyright (2017) American Chemical Society. E) An injection molded μFFE device in cycloolefin polymer for low cost fast mass production of devices. Adapted with permission from Ref. from the Royal Society of Chemistry.
Figure 3
Figure 3
Schematic diagram of fabrication: (1) standard photolithography, wet etching and drilling; (2) fixing and alignment; (3) filling UV-curable monomer (NOA 81); (4) protecting the functional domain; (5) standard photolithography; (6) removing uncured monomer (NOA 81). Reproduced from Ref. with permission from The Royal Society of Chemistry.
Figure 4
Figure 4
Images of a (a) glass μFFE device, (b) 3D-printed μFFE device taken from the channel/detection side, and (c) 3D-printed μFFE device taken from the fluidic connection side. Labels highlight the (1) buffer inlets, (2) sample inlet, (3) electrode connections, and (4) buffer outlets. Channels were filled with food dye in panel b to demonstrate that no leaking was observed after solvent vapor bonding. Reproduced with permission from Anciaux, S. K.; Geiger, M.; Bowser, M. T. Anal. Chem. 2016, 88, 7675–7682. Copyright (2016) American Chemical Society.
Figure 5
Figure 5
(A) Side view of closed style device, where the electrodes (yellow) are segregated from the separation channel (white) by some kind of structure (purple) usually an ion-permeable membrane, insulator, or wall. (B) Side view of an open style device in which the separation channel is not segregated from the electrodes by any kind of structure.
Figure 6
Figure 6
Plots of variance (σ2) versus linear velocity. (A) and (B) are plots for rhodamine 123 and fluorescein, respectively in the presence of EOF (μeo = 3.80 ± 0.05 × 10⁻⁴ cm2/Vsec) (C) and (D) are plots for rhodamine 123 and fluorescein, respectively with EOF suppressed by PEO (μeo = 8.63 ± 2.25 × 10⁻⁵ cm2/Vsec). Variances are plotted for increasing linear velocities (v) with the electric field adjusted to keep the separation power constant: 0 (red), 100 (brown), 200 (yellow), 300 (green), 400 (blue), 500 (violet), 600 (black), 700 (maroon) Vsec/cm. Only the best-fit lines for the highest and lowest separation powers are plotted in (B), (C) and (D) for clarity. Reproduced with permission from Fonslow, B. R.; Bowser, M. T. Anal Chem 2006, 78, 8236–8244. Copyright (2006) American Chemical Society.
Figure 7
Figure 7
A) CE electropherogram of Chromeo™ P503 labeled cytochrome c and myoglobin. B) nLC chromatograms measured on-column. C) Extracted chromatograms recorded in the μFFE separation channel 12.5 mm from the sample inlet. D) Extracted μFFE linescan recorded at 4.2 minutes. Reproduced with permission from Geiger M.; Harstad, R. K; Bowser, M. T. Anal. Chem. 2015, 87, 11682-11690. Copyright (2015) American Chemical Society.
Figure 8
Figure 8
a) Layout of a microfluidic FFE-MS chip (l=left). b) The analysis principle. The separated analytes are directed towards the mass spectrometric outlet by alteration of the buffers’ hydrodynamic flow. Arrows indicate relative flow rates and the rectangle (*) labels the area visualized by fluorescence imaging. Reproduced from Ref. with permission from John Wiley and Sons.
Figure 9
Figure 9
Illustration of the μFFE device for bacteria concentration. As charged bacteria are injected, they migrate toward the electrode. The gel barrier stops the bacteria migration effectively trapping the bacteria. The polarity of the electrodes are flipped to release the bacteria, and the buffer eluent is collected at the outlet at the bottom of the device. Reproduced from Ref. with permission from the Royal Society of Chemistry.
Figure 10
Figure 10
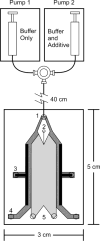
Schematic of the μFFE pumping setup used for generating a buffer additive gradient. Pump 1 and 2 were controlled using LabView to ramp the flow rates to create the gradient while keeping the flow rate constant. Reproduced with permission from Fonslow, B. R.; Bowser, M. T. Anal. Chem. 2008, 80, 3182-3189. Copyright 2008 American Chemical Society.
Figure 11
Figure 11
1D nLC chromatograms of A) Chromeo™ P503, B) NBD-F and C) Alexa Fluor® 488 labeled BSA tryptic peptides. 2D nLC × μFFE separations of D) Chromeo™ P503, E) NBD-F and F) Alexa Fluor® 488 labeled BSA tryptic peptides. Data shown are representative separations from n ≥ 3 replicates. Adapted with permission from Geiger, M.; Bowser, M. T. Anal Chem 2016, 88, 2177-2187. Copyright 2016 American Chemical Society.

References

    1. Barrollier J, Watzke E, Gibian H. Z Naturforsch B. 1958;13:754–756. - PubMed
    1. Hannig K. Fresen Z Anal Chem. 1961;181:244–254.
    1. Hannig K. J Chromatogr. 1978;159:183–191. - PubMed
    1. Křivánková L, Boček P. Electrophoresis. 1998;19:1064–1074. - PubMed
    1. Islinger M, Eckerskorn C, Völkl A. Electrophoresis. 2010;31:1754–1763. - PubMed

Publication types

LinkOut - more resources