. 2018 Jun;19(6):1480-1490.
doi: 10.1111/mpp.12631. Epub 2017 Dec 26.

Contribution of the β-glucosidase BglC to the onset of the pathogenic lifestyle of Streptomyces scabies

Affiliations

Contribution of the β-glucosidase BglC to the onset of the pathogenic lifestyle of Streptomyces scabies

Samuel Jourdan et al. Mol Plant Pathol. 2018 Jun.

Abstract

Common scab disease on root and tuber plants is caused by Streptomyces scabies and related species which use the cellulose synthase inhibitor thaxtomin A as the main phytotoxin. Thaxtomin production is primarily triggered by the import of cello-oligosaccharides. Once inside the cell, the fate of the cello-oligosaccharides is dichotomized: (i) the fuelling of glycolysis with glucose for the saprophytic lifestyle through the action of β-glucosidase(s) (BGs); and (ii) elicitation of the pathogenic lifestyle by the inhibition of CebR-mediated transcriptional repression of thaxtomin biosynthetic genes. Here, we investigated the role of scab57721, encoding a putative BG (BglC), in the onset of the pathogenicity of S. scabies. Enzymatic assays showed that BglC was able to release glucose from cellobiose, cellotriose and all other cello-oligosaccharides tested. Its inactivation resulted in a phenotype opposite to that expected, as reduced production of thaxtomin was monitored when the mutant was cultivated on medium containing cello-oligosaccharides as unique carbon source. This unexpected phenotype could be attributed to the highly increased activity of alternative intracellular BGs, probably as a compensation for bglC inactivation, which then prevented cellobiose and cellotriose accumulation to reduce the activity of CebR. In contrast, when the bglC null mutant was cultivated on medium devoid of cello-oligosaccharides, it instead constitutively produced thaxtomin. This observed hypervirulent phenotype does not fit with the proposed model of the cello-oligosaccharide-mediated induction of thaxtomin production, and suggests that the role of BglC in the route to the pathogenic lifestyle of S. scabies is more complex than currently presented.

Keywords: CebR; cello-oligosaccharides; common scab disease; thaxtomin; β-glucosidase.


Figures

Figure 1
Figure 1
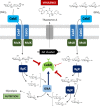
Position of β‐glucosidase activity on the modelled metabolic pathways from cellobiose [(Glc)2] and cellotriose [(Glc)3] transport to glycolysis and thaxtomin A production. When (Glc)2 and (Glc)3 are transported into the cytoplasm through the CebEFG‐MsiK transporter, they both prevent the DNA‐binding ability of the repressor CebR [(Glc)2 does this much more efficiently than (Glc)3; Francis et al., 2015], thus allowing the expression of CebR‐controlled genes, including the thaxtomin biosynthetic genes (txt cluster), cebEFG and bglC. Once expressed, BglC cleaves both the imported (Glc)2 and (Glc)3. (Glc)2 hydrolysis leads directly to two glucose molecules, whereas (Glc)3 hydrolysis generates first glucose and (Glc)2, the latter being the best allosteric effector of CebR. (Glc)3 uptake therefore inhibits CebR‐mediated repression more effectively than does (Glc)2 uptake. The glucose generated by BglC activity is further metabolized by entering glycolysis, with phosphorylation by the glucose kinase GlkA to glucose‐6‐phosphate as the first step.
Figure 2
Figure 2
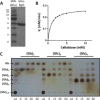
scab57721 encodes a β‐glucosidase. (A) Sodium dodecylsulfate‐polyacrylamide gel electrophoresis (SDS‐PAGE) showing the level of purity of 6His‐BglC used for enzymatic assays. Lane 1, molecular weight marker; lane 2, purified 6His‐BglC whose migration size (54 kDa) corresponds well to its predicted calculated size (54.121 kDa). (B) Initial velocity (V i) of 6His‐BglC as a function of the cellobiose concentration. Rates of cellobiose degradation were obtained by measuring the glucose released at the beginning of the hydrolysis reaction performed in 50 mm HEPES buffer, pH 7.5, at 25 °C. Data were fitted to the Henri–Michaelis–Menten equation using GraphPad Prism 5 software in order to obtain V max, K m and k cat. (C) Substrate specificity of 6His‐BglC for cello‐oligosaccharides. Cello‐oligosaccharides (6.25 mm) were incubated with pure 6His‐BglC (0.4 µm) at 30 °C for 0, 15, 30 and 60 min. std, standard cello‐oligosaccharides; Glc, glucose; (Glc)2, cellobiose; (Glc)3, cellotriose; (Glc)4, cellotetraose.
Figure 3
Figure 3
Expression of bglC is repressed by CebR and induced by cellobiose. (A) Quantitative reverse transcription‐polymerase chain reaction (qPCR) analysis of bglC expression levels in Streptomyces scabies 87‐22 and in the ΔcebR strain. Data were normalized using the gyrA and murX genes as internal controls and the cebE, cebF and cebR genes as CebR repressed genes. Mean normalized expression levels (± standard deviations) from three biological repeats analysed in triplicate are shown, with the bglC expression level in the wild‐type normalized to one‐fold. (B) Relative normalized abundance of BglC peptides in response to the deletion of cebRcebR) and/or cellobiose supply, determined by liquid chromatography‐multiple reaction monitoring (LC‐MRM) mass spectrometry (MS) on tryptic digests of protein extracts. Target peptides for BglC: LVDELLAK (BglC1) and TDPVASLR (BglC2). *Significant quantitative peptide overproduction (P < 0.05) compared with the wild‐type (WT) strain grown in International Streptomyces Project medium 4 (ISP4) without cellobiose supply. Statistical significance was assigned by performing two‐sided Student's t‐tests and assuming groups of equal variances. AUC, area under the curve. (C) Electrophoretic mobility shift assays (EMSAs) showing the specific interaction of CebR with the cbs (CebR‐binding site) element at position −14 nucleotides upstream of bglC. Probes with the DasR‐responsive element (dre) upstream of nagKA (Tenconi et al., 2015) and with the cbs upstream of cebE were used as negative and positive controls, respectively. (D) Overall β‐glucosidase activity of S. scabies 87‐22 and its bglC null mutant grown in liquid ISP4 with or without cellobiose (0.5 mm) supply.
Figure 4
Figure 4
Effect of bglC deletion on the cello‐oligosaccharide‐mediated induction of thaxtomin A production. Streptomyces scabies 87‐22 and its bglC null mutant were grown in liquid minimal medium (MM) supplemented with 0.5 mm cellobiose or cellotriose. Thaxtomin production was quantified by high‐performance liquid chromatography (HPLC) at 24 h post‐inoculation and wild‐type production levels in each condition were fixed to 100%.
Figure 5
Figure 5
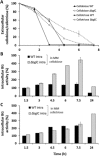
Consumption of the cello‐oligosaccharides cellobiose and cellotriose (A), and correlation with the intracellular β‐glucosidase (BG) activity of Streptomyces scabies wild‐type and the bglC null mutant (B, C). The BG activity of the wild‐type at the first time point was set to 100%.
Figure 6
Figure 6
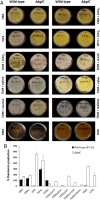
Thaxtomin A production by Streptomyces scabies wild‐type (87‐22) and the bglC null mutant grown on various minimal and complex solid media. (A) Photographs of media inoculated with S. scabies 87‐22 and its bglC null mutant. Thaxtomin A production can be seen by its distinct yellow pigmentation. (B) Quantification of thaxtomin A extracted from plates shown in (A) after incubation for 7 days at 28 °C. Means and standard deviations were calculated on three biological replicates. The wild‐type production level in thaxtomin defined medium + cellobiose [TDM + (Glc)2] was fixed to 100%. OBA, oat bran agar; PMA, potato mash agar; SFM, soy flour mannitol.
Figure 7
Figure 7
Effect of bglC deletion on the virulence of Streptomyces scabies. (A) Phenotypes of representative radish seedlings treated with water, the wild‐type strain 87‐22 and bglC mutant isolates at 6 days post‐infection. (B) Phenotype of Arabidopsis thaliana grown for 7 days in the presence of S. scabies 87‐22 (wild‐type) and its bglC null mutant, with a close‐up of the representative plants grown on Murashige–Skoog (MS) plates shown in the top panel.

References

    1. Bignell, D.R.D. , Tahlan, K. , Colvin, K.R. , Jensen, S.E. and Leskiw, B.K. (2005) Expression of ccaR, encoding the positive activator of cephamycin C and clavulanic acid production in Streptomyces clavuligerus, is dependent on bldG . Antimicrob. Agents Chemother. 49, 1529–1541. - PMC - PubMed
    1. Bignell, D.R.D. , Huguet‐Tapia, J. , Joshi, M.V. , Pettis, G.S. and Loria, R. (2010) What does it take to be a plant pathogen: genomic insights from Streptomyces species. Antonie Van Leeuwenhoek, 98, 179–194. - PubMed
    1. Francis, I.M. , Jourdan, S. , Fanara, S. , Loria, R. and Rigali, S. (2015) The cellobiose sensor CebR is the gatekeeper of Streptomyces scabies pathogenicity. mBio, 6, e02018–e02014. http://mbio.asm.org/content/6/2/e02018-14.full - PMC - PubMed
    1. Gao, J. and Wakarchuk, W. (2014) Characterization of five β‐glycoside hydrolases from Cellulomonas fimi ATCC 484. J. Bacteriol. 196, 4103–4110. - PMC - PubMed
    1. Gust, B. , Challis, G.L. , Fowler, K. , Kieser, T. and Chater, K.F. (2003) PCR‐targeted Streptomyces gene replacement identifies a protein domain needed for biosynthesis of the sesquiterpene soil odor geosmin. Proc. Natl. Acad. Sci. USA, 100, 1541–1546. - PMC - PubMed

Publication types

MeSH terms