

Quantifying connectivity between local Plasmodium falciparum malaria parasite populations using identity by descent
- PMID: 29077712
- PMCID: PMC5678785
- DOI: 10.1371/journal.pgen.1007065
Quantifying connectivity between local Plasmodium falciparum malaria parasite populations using identity by descent
Abstract
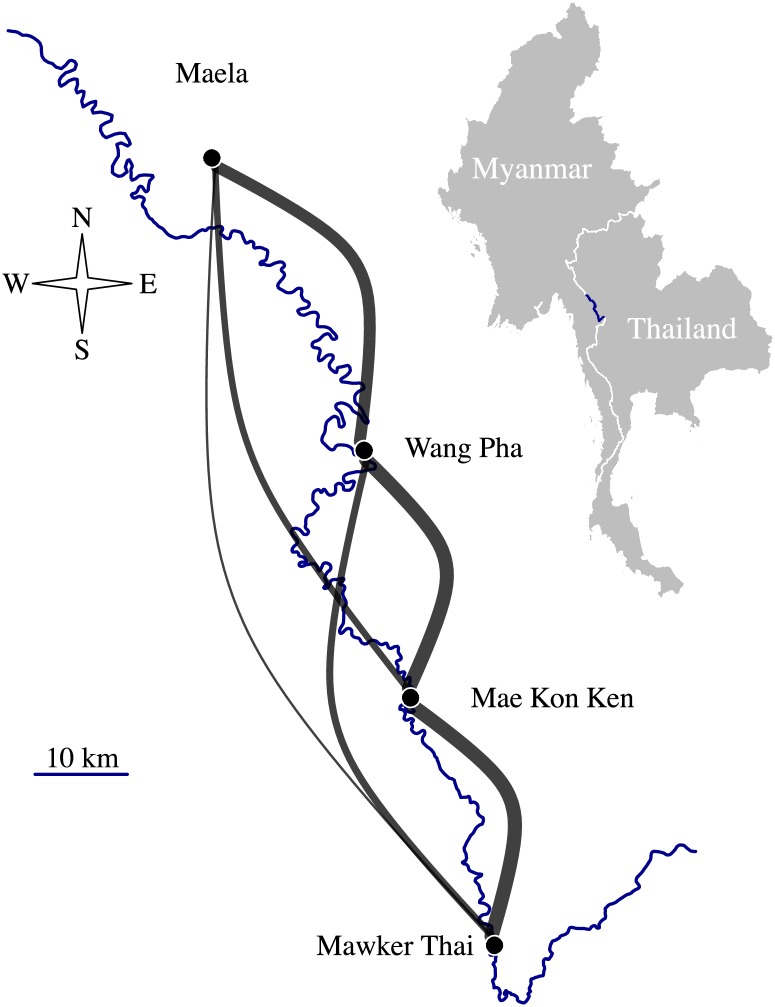
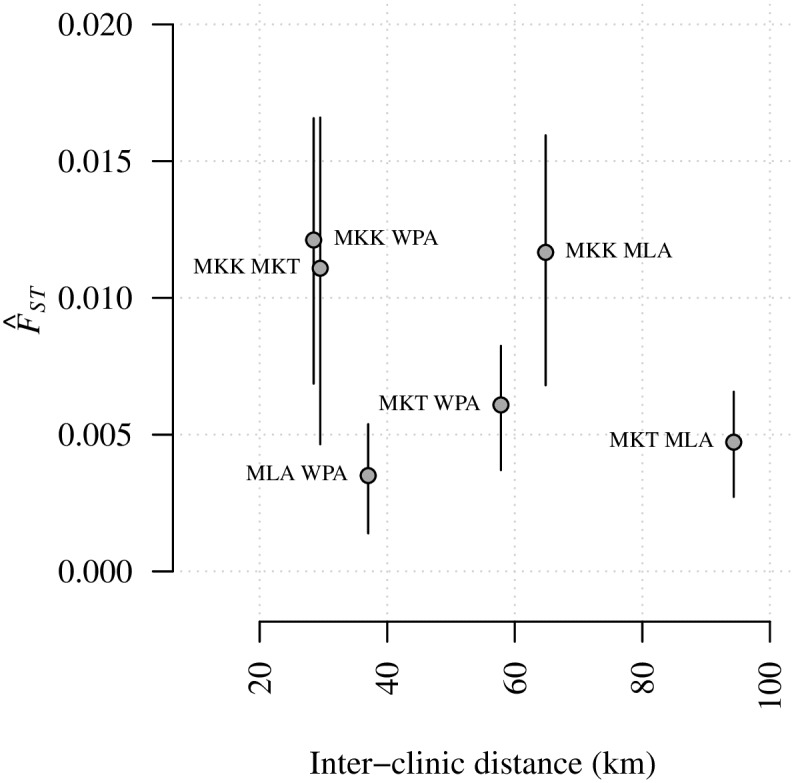
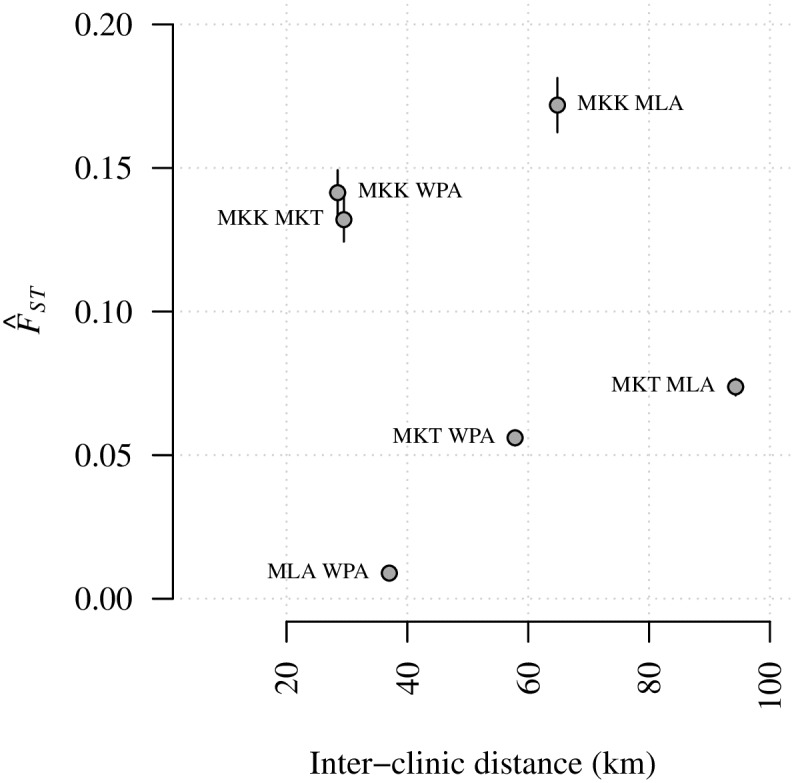
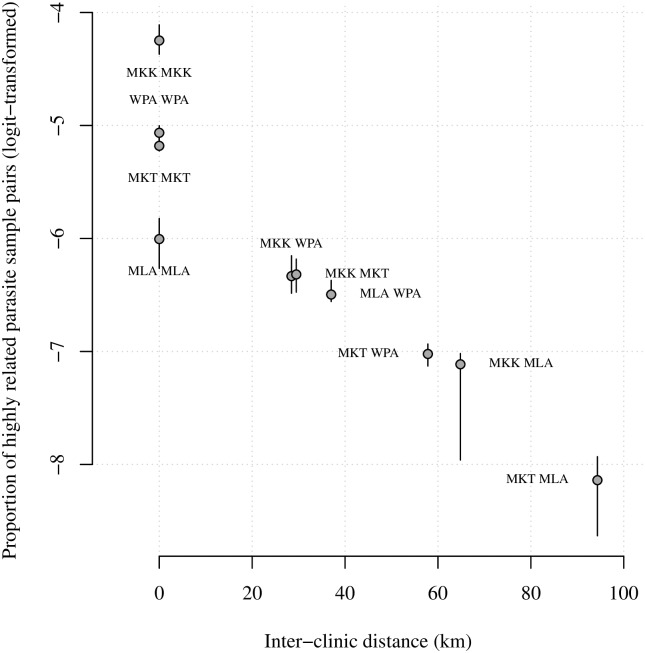
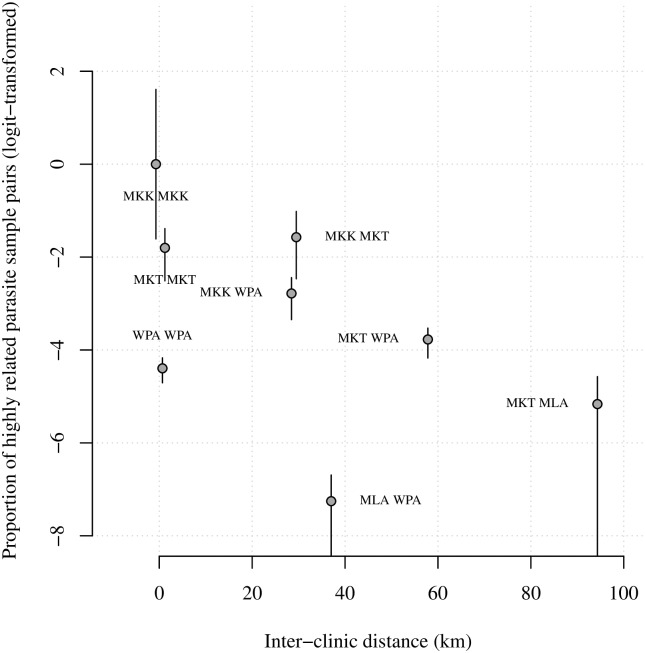
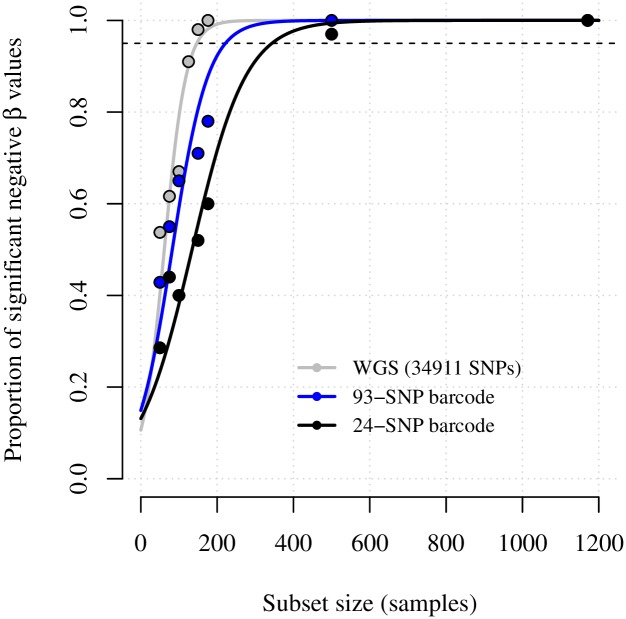
With the rapidly increasing abundance and accessibility of genomic data, there is a growing interest in using population genetic approaches to characterize fine-scale dispersal of organisms, providing insight into biological processes across a broad range of fields including ecology, evolution and epidemiology. For sexually recombining haploid organisms such as the human malaria parasite P. falciparum, however, there have been no systematic assessments of the type of data and methods required to resolve fine scale connectivity. This analytical gap hinders the use of genomics for understanding local transmission patterns, a crucial goal for policy makers charged with eliminating this important human pathogen. Here we use data collected from four clinics with a catchment area spanning approximately 120 km of the Thai-Myanmar border to compare the ability of divergence (FST) and relatedness based on identity by descent (IBD) to resolve spatial connectivity between malaria parasites collected from proximal clinics. We found no relationship between inter-clinic distance and FST, likely due to sampling of highly related parasites within clinics, but a significant decline in IBD-based relatedness with increasing inter-clinic distance. This association was contingent upon the data set type and size. We estimated that approximately 147 single-infection whole genome sequenced parasite samples or 222 single-infection parasite samples genotyped at 93 single nucleotide polymorphisms (SNPs) were sufficient to recover a robust spatial trend estimate at this scale. In summary, surveillance efforts cannot rely on classical measures of genetic divergence to measure P. falciparum transmission on a local scale. Given adequate sampling, IBD-based relatedness provides a useful alternative, and robust trends can be obtained from parasite samples genotyped at approximately 100 SNPs.
Conflict of interest statement
The authors have declared that no competing interests exist.
Figures
Similar articles
-
Identity-by-descent with uncertainty characterises connectivity of Plasmodium falciparum populations on the Colombian-Pacific coast.PLoS Genet. 2020 Nov 16;16(11):e1009101. doi: 10.1371/journal.pgen.1009101. eCollection 2020 Nov. PLoS Genet. 2020. PMID: 33196661 Free PMC article.
-
Temporal and spatial analysis of Plasmodium falciparum genomics reveals patterns of parasite connectivity in a low-transmission district in Southern Province, Zambia.Malar J. 2023 Jul 7;22(1):208. doi: 10.1186/s12936-023-04637-9. Malar J. 2023. PMID: 37420265 Free PMC article.
-
Identity-by-descent analyses for measuring population dynamics and selection in recombining pathogens.PLoS Genet. 2018 May 23;14(5):e1007279. doi: 10.1371/journal.pgen.1007279. eCollection 2018 May. PLoS Genet. 2018. PMID: 29791438 Free PMC article.
-
Molecular surveillance for drug-resistant Plasmodium falciparum in clinical and subclinical populations from three border regions of Burma/Myanmar: cross-sectional data and a systematic review of resistance studies.Malar J. 2012 Sep 19;11:333. doi: 10.1186/1475-2875-11-333. Malar J. 2012. PMID: 22992214 Free PMC article.
-
Curation of the Plasmodium falciparum genome.Trends Parasitol. 2004 Dec;20(12):548-52. doi: 10.1016/j.pt.2004.09.003. Trends Parasitol. 2004. PMID: 15522662 Review.
Cited by
-
Antimalarial Drug Resistance and Implications for the WHO Global Technical Strategy.Curr Epidemiol Rep. 2021;8(2):46-62. doi: 10.1007/s40471-021-00266-5. Epub 2021 Mar 14. Curr Epidemiol Rep. 2021. PMID: 33747712 Free PMC article. Review.
-
Drug resistance and vaccine target surveillance of Plasmodium falciparum using nanopore sequencing in Ghana.Nat Microbiol. 2023 Dec;8(12):2365-2377. doi: 10.1038/s41564-023-01516-6. Epub 2023 Nov 23. Nat Microbiol. 2023. PMID: 37996707 Free PMC article.
-
Increasingly inbred and fragmented populations of Plasmodium vivax associated with the eastward decline in malaria transmission across the Southwest Pacific.PLoS Negl Trop Dis. 2018 Jan 26;12(1):e0006146. doi: 10.1371/journal.pntd.0006146. eCollection 2018 Jan. PLoS Negl Trop Dis. 2018. PMID: 29373596 Free PMC article.
-
Strong positive selection biases identity-by-descent-based inferences of recent demography and population structure in Plasmodium falciparum.Nat Commun. 2024 Mar 20;15(1):2499. doi: 10.1038/s41467-024-46659-0. Nat Commun. 2024. PMID: 38509066 Free PMC article.
-
Modelling transmission dynamics and genomic diversity in a recombining parasite population.Wellcome Open Res. 2024 Apr 23;9:215. doi: 10.12688/wellcomeopenres.19092.1. eCollection 2024. Wellcome Open Res. 2024. PMID: 39554245 Free PMC article.
References
-
- Gardy J, Loman NJ, Rambaut A. Real-time digital pathogen surveillance—the time is now. Genome Biol. 2015;16(1):155 doi: 10.1186/s13059-015-0726-x - DOI - PMC - PubMed
-
- Neher RA, Bedford T. nextflu: Real-time tracking of seasonal influenza virus evolution in humans. Bioinformatics. 2015;31(21):3546–8. doi: 10.1093/bioinformatics/btv381 - DOI - PMC - PubMed
-
- Bielejec F, Baele G, Vrancken B, Suchard MA, Rambaut A, Lemey P. SpreaD3: Interactive Visualization of Spatiotemporal History and Trait Evolutionary Processes. Mol Biol Evol. 2016;33(8):2167–9. doi: 10.1093/molbev/msw082 - DOI - PMC - PubMed
MeSH terms
Substances
Grants and funding
LinkOut - more resources
Full Text Sources
Other Literature Sources
Miscellaneous
