

Value-based decision making via sequential sampling with hierarchical competition and attentional modulation
- PMID: 29077746
- PMCID: PMC5659783
- DOI: 10.1371/journal.pone.0186822
Value-based decision making via sequential sampling with hierarchical competition and attentional modulation
Erratum in
-
Correction: Value-based decision making via sequential sampling with hierarchical competition and attentional modulation.PLoS One. 2018 Aug 23;13(8):e0203093. doi: 10.1371/journal.pone.0203093. eCollection 2018. PLoS One. 2018. PMID: 30138375 Free PMC article.
Abstract
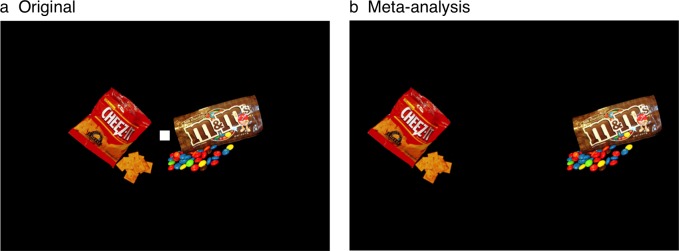
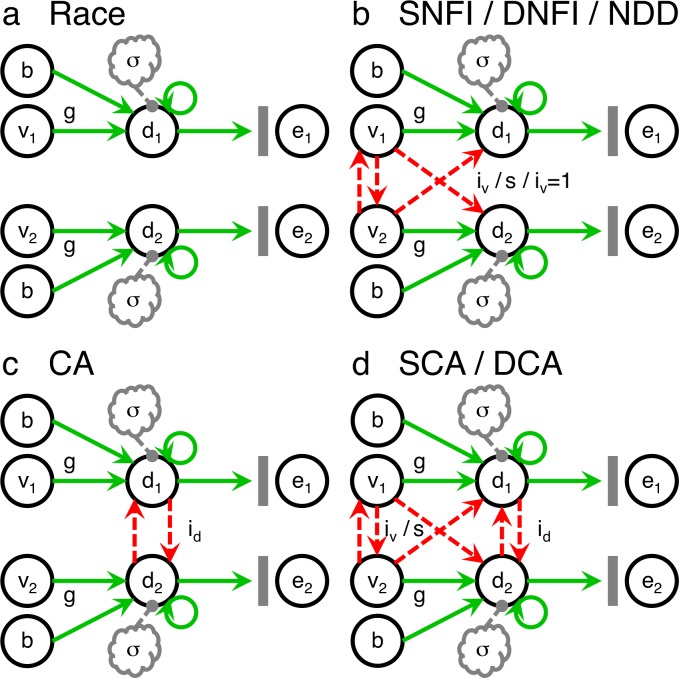
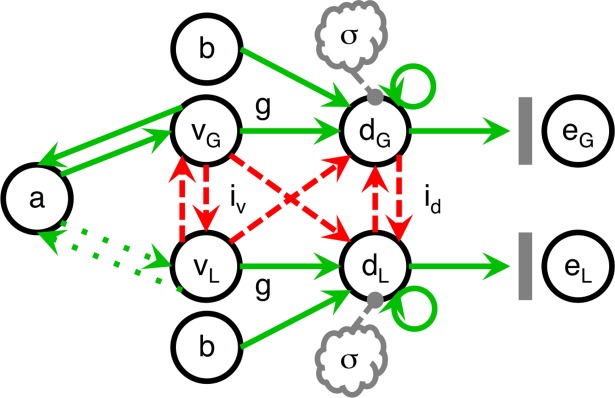
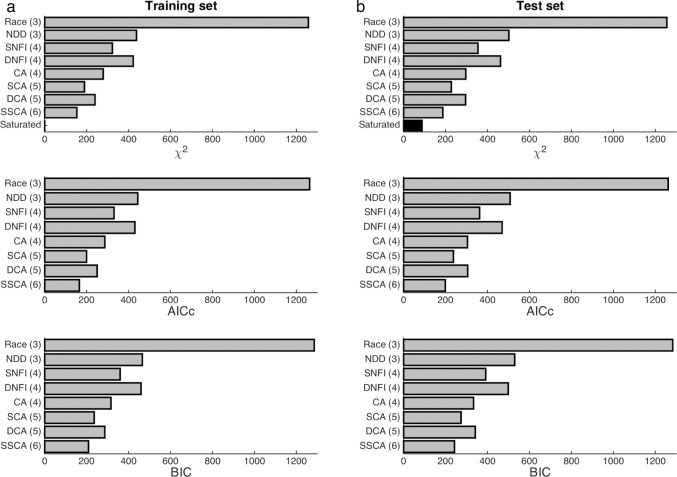
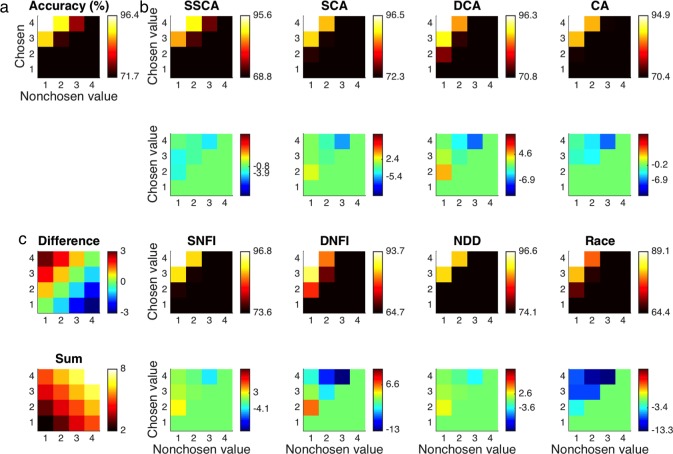
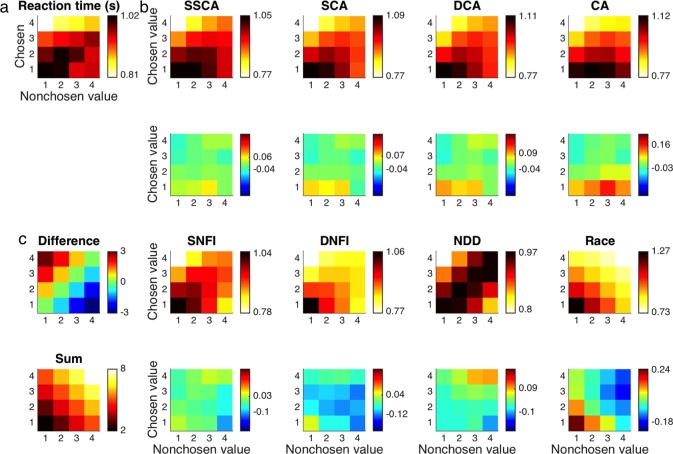
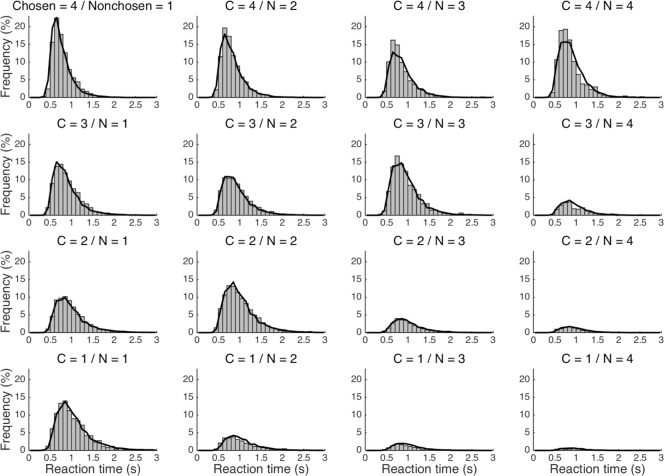
In principle, formal dynamical models of decision making hold the potential to represent fundamental computations underpinning value-based (i.e., preferential) decisions in addition to perceptual decisions. Sequential-sampling models such as the race model and the drift-diffusion model that are grounded in simplicity, analytical tractability, and optimality remain popular, but some of their more recent counterparts have instead been designed with an aim for more feasibility as architectures to be implemented by actual neural systems. Connectionist models are proposed herein at an intermediate level of analysis that bridges mental phenomena and underlying neurophysiological mechanisms. Several such models drawing elements from the established race, drift-diffusion, feedforward-inhibition, divisive-normalization, and competing-accumulator models were tested with respect to fitting empirical data from human participants making choices between foods on the basis of hedonic value rather than a traditional perceptual attribute. Even when considering performance at emulating behavior alone, more neurally plausible models were set apart from more normative race or drift-diffusion models both quantitatively and qualitatively despite remaining parsimonious. To best capture the paradigm, a novel six-parameter computational model was formulated with features including hierarchical levels of competition via mutual inhibition as well as a static approximation of attentional modulation, which promotes "winner-take-all" processing. Moreover, a meta-analysis encompassing several related experiments validated the robustness of model-predicted trends in humans' value-based choices and concomitant reaction times. These findings have yet further implications for analysis of neurophysiological data in accordance with computational modeling, which is also discussed in this new light.
Conflict of interest statement
Figures
Similar articles
-
Comparing perceptual and preferential decision making.Psychon Bull Rev. 2016 Jun;23(3):723-37. doi: 10.3758/s13423-015-0941-1. Psychon Bull Rev. 2016. PMID: 26432714
-
Value-based attentional capture influences context-dependent decision-making.J Neurophysiol. 2015 Jul;114(1):560-9. doi: 10.1152/jn.00343.2015. Epub 2015 May 20. J Neurophysiol. 2015. PMID: 25995350 Free PMC article.
-
Dopaminergic Modulation of Human Intertemporal Choice: A Diffusion Model Analysis Using the D2-Receptor Antagonist Haloperidol.J Neurosci. 2020 Oct 7;40(41):7936-7948. doi: 10.1523/JNEUROSCI.0592-20.2020. Epub 2020 Sep 18. J Neurosci. 2020. PMID: 32948675 Free PMC article.
-
Bridging Neural and Computational Viewpoints on Perceptual Decision-Making.Trends Neurosci. 2018 Nov;41(11):838-852. doi: 10.1016/j.tins.2018.06.005. Epub 2018 Jul 12. Trends Neurosci. 2018. PMID: 30007746 Free PMC article. Review.
-
"Reliable organisms from unreliable components" revisited: the linear drift, linear infinitesimal variance model of decision making.Psychon Bull Rev. 2023 Aug;30(4):1323-1359. doi: 10.3758/s13423-022-02237-3. Epub 2023 Jan 31. Psychon Bull Rev. 2023. PMID: 36720804 Free PMC article. Review.
Cited by
-
Goal congruency dominates reward value in accounting for behavioral and neural correlates of value-based decision-making.Nat Commun. 2019 Oct 29;10(1):4926. doi: 10.1038/s41467-019-12931-x. Nat Commun. 2019. PMID: 31664035 Free PMC article.
-
Decision heuristics in contexts integrating action selection and execution.Sci Rep. 2023 Apr 20;13(1):6486. doi: 10.1038/s41598-023-33008-2. Sci Rep. 2023. PMID: 37081031 Free PMC article.
-
Cardiac-Sympathetic Contractility and Neural Alpha-Band Power: Cross-Modal Collaboration during Approach-Avoidance Conflict.J Neurosci. 2024 Oct 9;44(41):e2008232024. doi: 10.1523/JNEUROSCI.2008-23.2024. J Neurosci. 2024. PMID: 39214705 Free PMC article.
-
Reinforcement learning with associative or discriminative generalization across states and actions: fMRI at 3 T and 7 T.Hum Brain Mapp. 2022 Oct 15;43(15):4750-4790. doi: 10.1002/hbm.25988. Epub 2022 Jul 21. Hum Brain Mapp. 2022. PMID: 35860954 Free PMC article.
-
Correction: Value-based decision making via sequential sampling with hierarchical competition and attentional modulation.PLoS One. 2018 Aug 23;13(8):e0203093. doi: 10.1371/journal.pone.0203093. eCollection 2018. PLoS One. 2018. PMID: 30138375 Free PMC article.
References
-
- Shannon CE, Weaver W. The mathematical theory of communication. Urbana (IL): University of Illinois Press; 1949.
-
- Fechner GT. Elemente der Psychophysik [Elements of psychophysics]. Leipzig, Germany: Breitkopf & Härtel; 1860.
-
- Wald A. Sequential tests of statistical hypotheses. Ann Math Stat. 1945;16(2): 117–186.
-
- Wald A. Sequential analysis. New York (NY): Wiley; 1947.
-
- Barnard GA. Sequential tests in industrial statistics. Suppl J R Stat Soc. 1946;8(1): 1–26.
MeSH terms
LinkOut - more resources
Full Text Sources
Other Literature Sources
