. 2017 Dec 1;140(12):3233-3251.
doi: 10.1093/brain/awx258.

PINK1 signalling rescues amyloid pathology and mitochondrial dysfunction in Alzheimer's disease

Affiliations

PINK1 signalling rescues amyloid pathology and mitochondrial dysfunction in Alzheimer's disease

Fang Du et al. Brain. .

Abstract

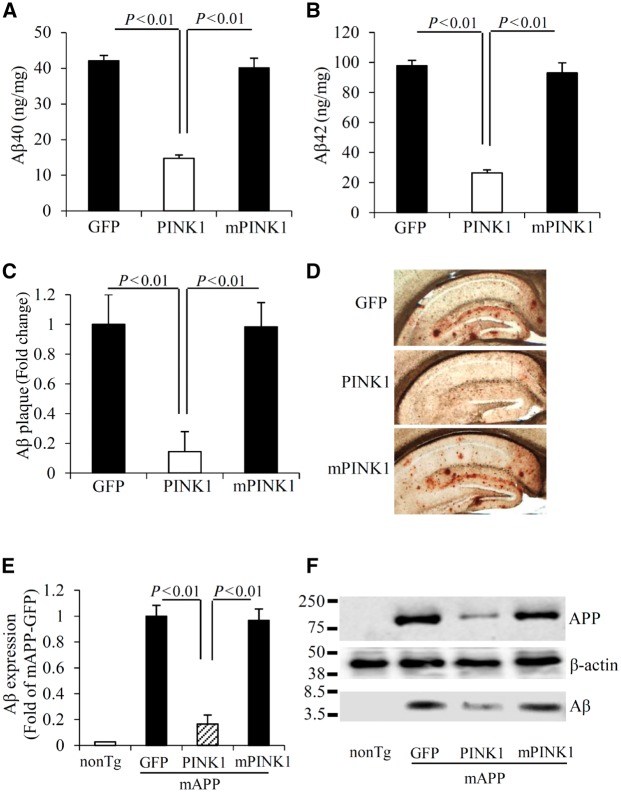
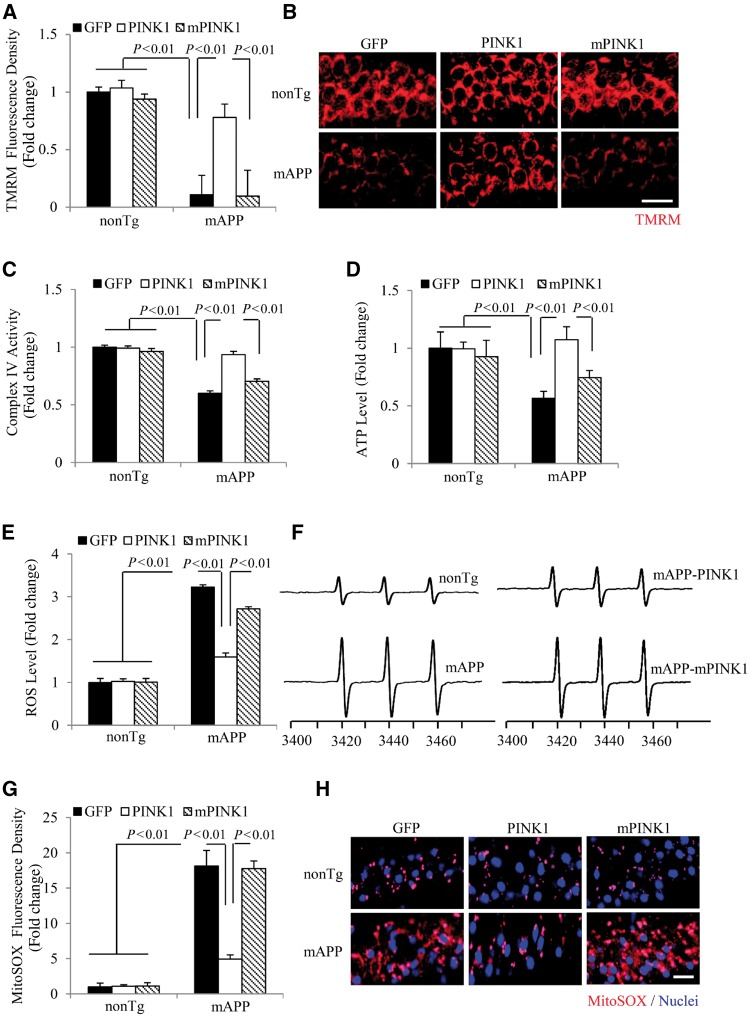
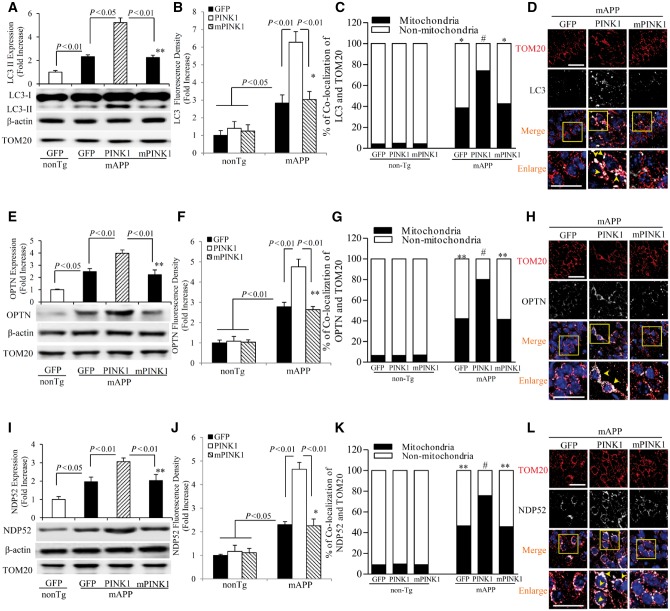
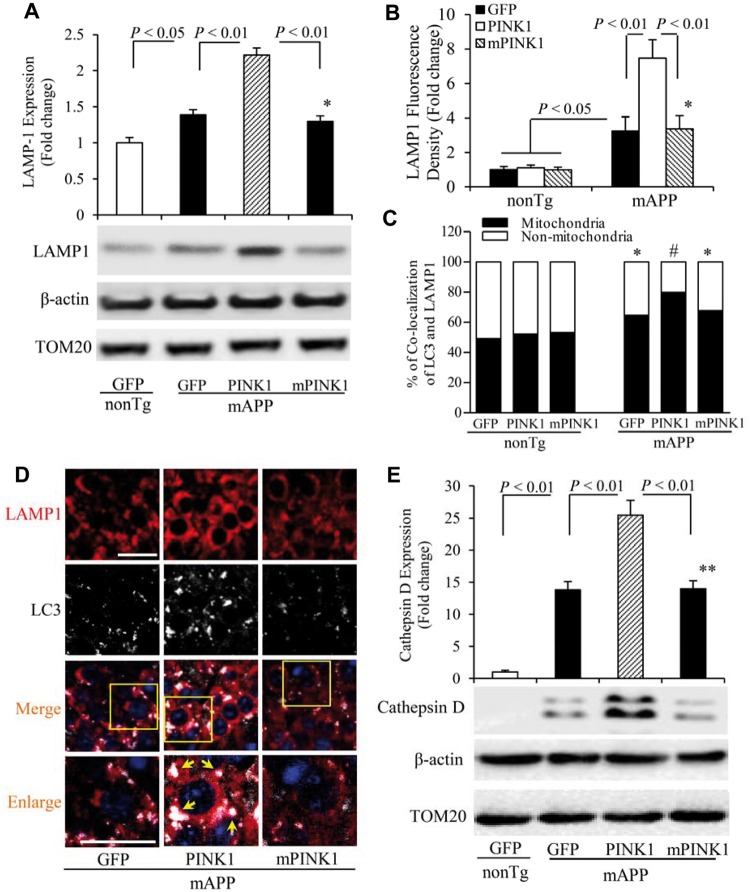
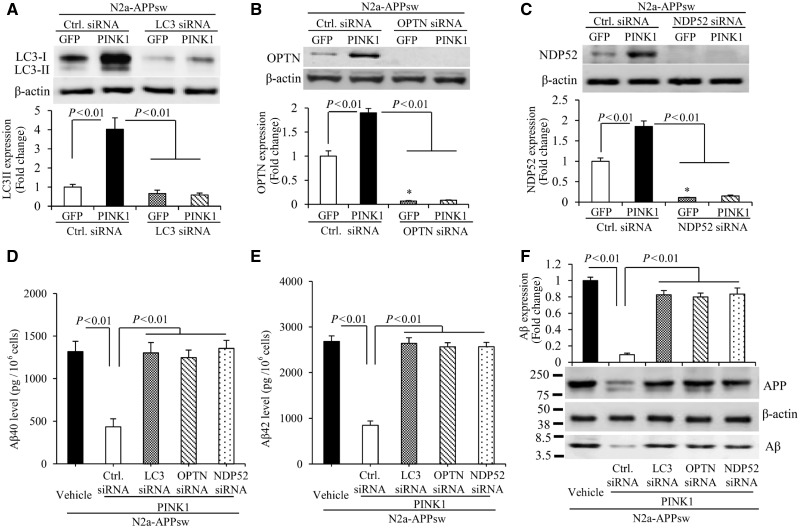
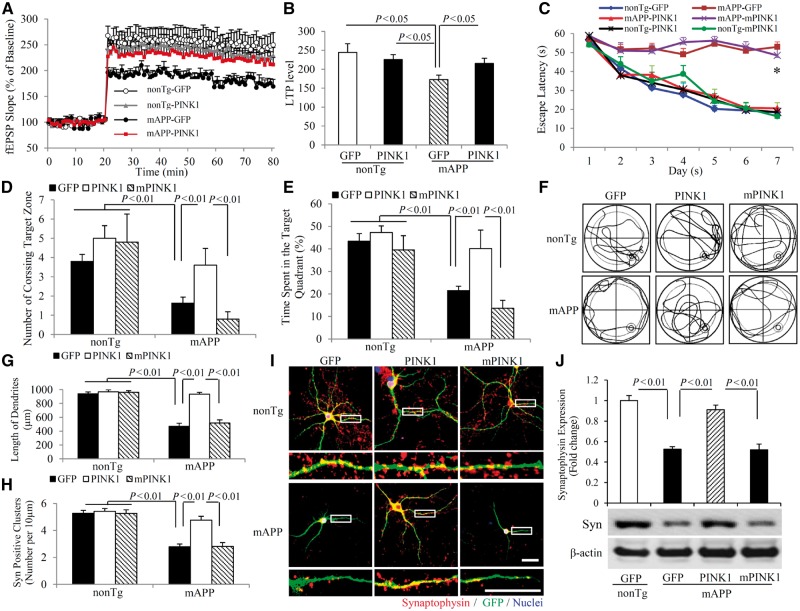
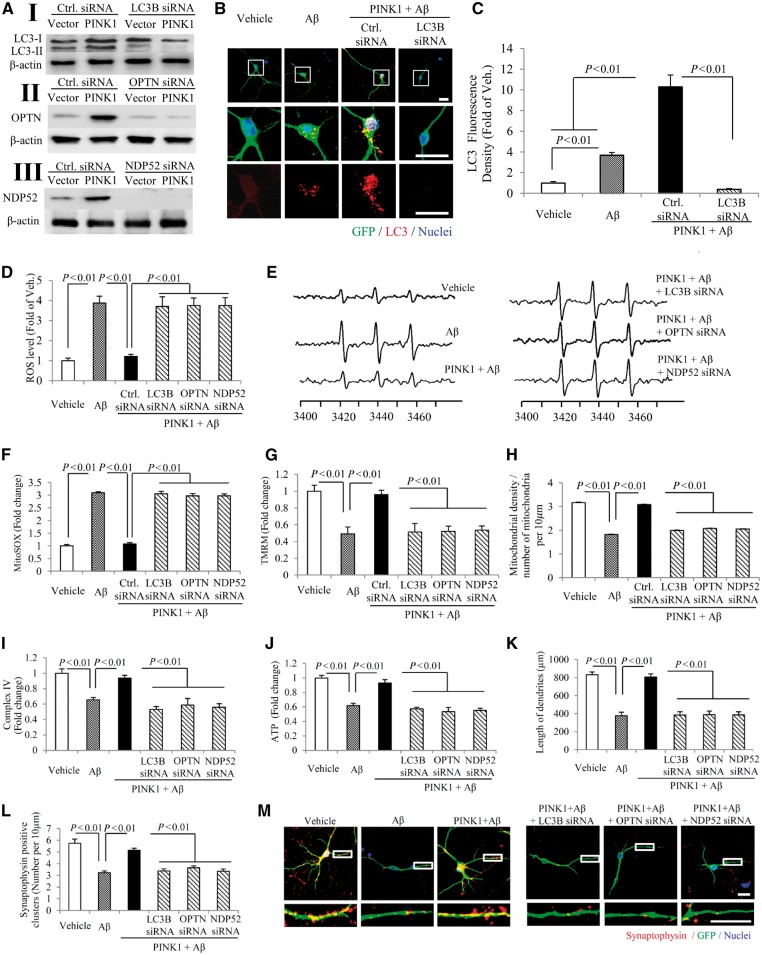
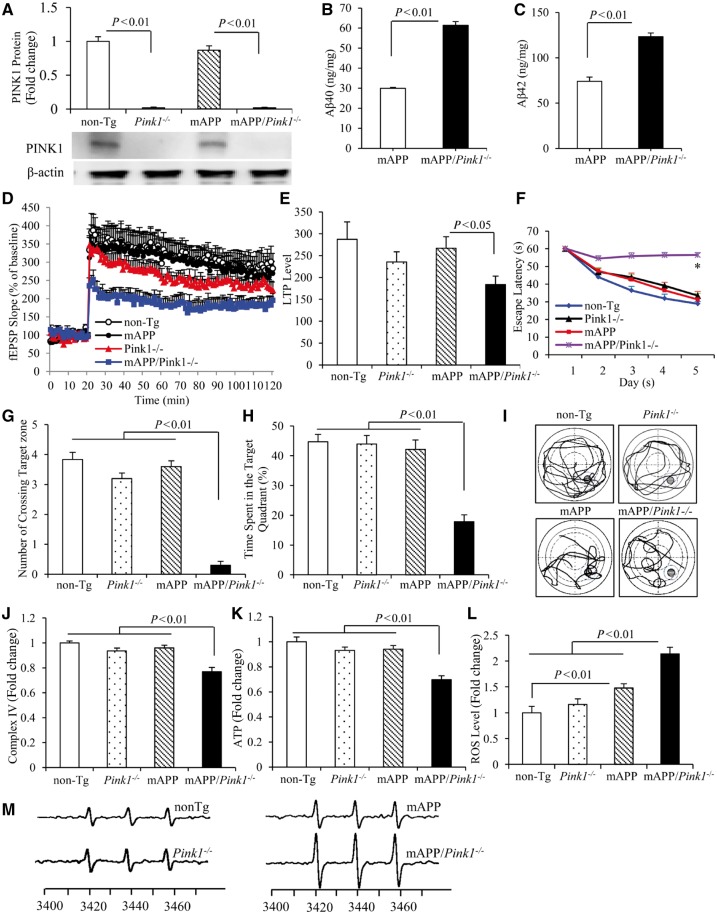
Mitochondrial dysfunction and synaptic damage are early pathological features of the Alzheimer's disease-affected brain. Memory impairment in Alzheimer's disease is a manifestation of brain pathologies such as accumulation of amyloid-β peptide and mitochondrial damage. The underlying pathogenic mechanisms and effective disease-modifying therapies for Alzheimer's disease remain elusive. Here, we demonstrate for the first time that decreased PTEN-induced putative kinase 1 (PINK1) expression is associated with Alzheimer's disease pathology. Restoring neuronal PINK1 function strikingly reduces amyloid-β levels, amyloid-associated pathology, oxidative stress, as well as mitochondrial and synaptic dysfunction. In contrast, PINK1-deficient mAPP mice augmented cerebral amyloid-β accumulation, mitochondrial abnormalities, impairments in learning and memory, as well as synaptic plasticity at an earlier age than mAPP mice. Notably, gene therapy-mediated PINK1 overexpression promotes the clearance of damaged mitochondria by augmenting autophagy signalling via activation of autophagy receptors (OPTN and NDP52), thereby alleviating amyloid-β-induced loss of synapses and cognitive decline in Alzheimer's disease mice. Loss of PINK1 activity or blockade of PINK1-mediated signalling (OPTN or NDP52) fails to reverse amyloid-β-induced detrimental effects. Our findings highlight a novel mechanism by which PINK1-dependent signalling promotes the rescue of amyloid pathology and amyloid-β-mediated mitochondrial and synaptic dysfunctions in a manner requiring activation of autophagy receptor OPTN or NDP52. Thus, activation of PINK1 may represent a new therapeutic avenue for combating Alzheimer's disease.

Keywords: Aβ; PINK1; autophagy; mitochondrial dysfunction; synaptic injury.


Figures

Figure 1
Figure 1
PINK1 reduces amyloid-β accumulation in mAPP mice. (A and B) Amyloid-β (Aβ) levels in the hippocampus of the indicated transgenic (Tg) mAPP mice, 2 months post-intrahippocampal injection of AAV2-PINK1 (PINK1), AAV2-mPINK1 (mPINK1), and AAV2-GFP (GFP) were measured by ELISA. n = 9–13 mice per group. (C) Quantification of amyloid-β plaque was performed with the hippocampi of the indicated mice and (D) representative images showed amyloid-β deposits. n = 6 mice per group. (E) The bar graph presents quantification of immunoreactive bands for amyloid-β normalized to β-actin. (F) The representative immunoblots show immunoreactive bands for APP and amyloid-β proteins from indicated hippocampal homogenates, and β-actin served as a loading control. n = 3 mice per group.
Figure 2
Figure 2
PINK1 rescues mitochondrial defects in mAPP mice. (A and B) Evaluation of mitochondrial membrane potential by measuring TMRM staining intensity (A) and the representative images of TMRM signal in hippocampi of the indicated mice (B). n = 3–5 mice per group. (C and D) CcO (complex IV, C) activity and ATP levels (D) in brain hippocampal tissues of the indicated mice. n = 6–10 mice per group. (E and F) Quantification of EPR spectra (E) and representative spectra of EPR (F) in the indicated mice. The peak height in the spectrum indicates levels of ROS. n = 3–5 mice per group. (G and H) Intensity of MitoSOX staining (G) and representative images of MitoSOX signals in the hippocampus of the indicated mice (H). n = 3–5 mice per group. Data are expressed as fold increase relative to non-transgenic mice received intrahippocampal injection of AAV2-GFP. Scale bars = 25 μm (B and H).
Figure 3
Figure 3
PINK1 activates autophagy signalling in mAPP mice. (A, E and I) Representative immunoblots show immunoreactive bands for LC3 (A), OPTN (E) and NDP52 (I) from indicated hippocampal homogenates, and β-actin served as a loading control. The bar graphs in A, E and I present quantification of immunoreactive bands for the corresponding proteins normalized to β-actin. n = 3 mice per group. (B, F and J) Quantification of LC3 (B), OPTN (F) and NDP52 (J) positive immunostaining intensity. Quantification of LC3, OPTN and NDP52 with TOM20 in mitochondria and non-mitochondria are shown in C, G and K, respectively. (D, H and L) Representative images of LC3 (D), OPTN (H) and NDP52 (L) in hippocampi of the indicated mice and the bottom panels show enlarged images of the interest area indicated by the box in the upper panels. n = 3–5 mice and 5–8 slides per group. *P < 0.05, **P < 0.01 versus non-transgenic (nonTg) group in A–C, E–G and I–K, #P < 0.01 versus mAPP/GFP or mAPP/mPINK1 mice in C, G and K. Scale bars = 25 μm (D, H and L).
Figure 4
Figure 4
PINK1 promotes lysosomal recruitment in mAPP mice. (A) Representative immunoblots show immunoreactive bands for LAMP1 protein from hippocampal homogenates from indicated mice, and β-actin served as a loading control. The bar graph (A) presents quantification of immunoreactive bands for LAMP1 protein normalized to β-actin. n = 3 mice per group. (BD) Quantification of LAMP1-positive immunostaining intensity is shown in B, and quantifications of LAMP1 in mitochondria and non-mitochondria are shown in C. Representative images of LAMP1 in hippocampi of indicated mice are shown in D, and the bottom panels show enlarged images of the field of interest indicated by the box in the top panels. (E) Representative immunoblots show immunoreactive bands for cathepsin D from hippocampal homogenates of indicated mice, and β-actin served as a loading control. The bar graph (E) presents quantification of immunoreactive bands for cathepsin D protein relative to β-actin. n = 3–5 mice and 5–8 slides per group. *P < 0.05, **P < 0.01 versus non Tg group in AC and E. #P < 0.01 versus mAPP/GFP or mAPP/mPINK1 mice in C. Scale bars = 25 μm in D.
Figure 5
Figure 5
PINK1 decreases amyloid-β accumulation via activation of autophagy signalling in N2a-APPsw cells. (A–C) Immunoblotting of N2a-APPsw cell lysates for LC3 (A), OPTN (B) and NDP52 (C) in the indicated groups of cells. N2a-APPsw cells were transduced with lentivirus encoding GFP or PINK1 and co-transfected with siRNA against LC3 (A), OPTN (B), NDP52 (C) and control siRNA. The expression levels of LC3-II, OPTN, and NDP52 were eliminated in cells treated with corresponding siRNA compared to control siRNA. Representative immunoblots show the immunoreactive bands for LC3-II (A), OPTN (B), and NDP52 (C), and β-actin served as a loading control. The bar graphs present quantification of immunoreactive bands for LC3-II (A), OPTN (B), and NDP52 (C) normalized to β-actin. *P < 0.01 versus control siRNA treatment group in B and C. n = 3 independent experiments of each group. (D–F) The levels of amyloid-β40 (Aβ40) (D) and amyloid-β42 (Aβ42) (E) in the N2a-APPsw cells transduced with lentivirus encoding GFP or PINK1 and co-transfected with siRNA against LC3, OPTN, NDP52 or control siRNA were measured by amyloid-β ELISA (n = 4). (F) Representative immunoblots show immunoreactive bands for APP and amyloid-β proteins in N2a-APPsw cell lysates with above treatment, and β-actin served as a loading control. The bar graph (F) presents quantification of immunoreactive bands for amyloid-β relative to β-actin. n = 3 independent experiments of each group.
Figure 6
Figure 6
PINK1 reduces LTP and learning impairments. (A and B) LTP was recorded in hippocampal CA1 neurons of the indicated mice at 12 months of age. Data are presented as mean ± standard error (SE). n = 3–5 mice per group. (C–F) Effect of PINK1 on learning and memory in mAPP mice. (C) Mean escape latency to the hidden platform during each day of the training session. (D) Mean number of crossings of the target during probe trials. (E) Time spent in the quadrant with the hidden platform in probe trials. (F) Pattern of representative searching traces for the indicated transgenic (Tg) mice in search of the target. n = 5–10 mice per group. *P < 0.05 compared to non-transgenic (nonTg)/GFP, non-transgenic/PINK1, non-transgenic mPINK1 and mAPP/PINK1 mice. (G–J) Effect of PINK1 on synaptic density. Hippocampal neurons cultured from non-transgenic and mAPP mice in vitro Day 5 (DIV 5) were transduced with lentivirus encoding PINK1, mPINK1 or GFP vector, respectively. Neurons at in vitro Day 14 were stained with Syn (red). Quantifications of the total length of dendrites (G) and the number of Syn-positive clusters (H) per micrometre of dendrite length are counted in the indicated groups of neurons. n = 16–21 neurons per group. (I) Representative images of immunofluorescence staining for Syn (red) and GFP (green) in the indicated groups of cells. The lower panels show enlarged images of the interest area indicated by the box in the upper panels. (J) The bar graph presents quantification of immunoreactive Syn bands normalized to β-actin from the hippocampal homogenates of the indicated transgenic mice. The representative immunoblots show the immunoreactive bands for Syn protein, and β-actin served as a loading control. n = 3 independent experiments of each group.
Figure 7
Figure 7
Effect of autophagy signalling on PINK1/amyloid-β-induced mitochondrial and synaptic alterations. (A) Immunoblotting of cell lysates for LC3 (I), OPTN (II) and NDP52 (III) in the indicated groups of cells. Hippocampal neurons at in vitro Day 10 (DIV 10) were transduced with PINK1 and co-transfected with siRNA against LC3, OPTN, NDP52 and control siRNA. The expression levels of LC3-II, OPTN, and NDP52 were eliminated in neurons treated with corresponding siRNA compared to control siRNA (I–III). n = 3 independent experiments. (B and C) Representative images for PINK1/GFP (green), LC3 (red) and nuclei (blue) in the indicated groups of neurons (B) and quantification of LC3-positive puncta (C). (D and E) Quantification of EPR spectra (D) and representative spectra of EPR (E) in the indicated neurons. (F–J) Quantifications of MitoSOX staining (F), TMRM staining (G), mitochondrial density (H), CcO activity (I), and ATP level (J) in the indicated neurons. (K–M) Quantifications of length of dendrites (K), synaptophysin-positive clusters (l), and representative images (M) for synaptophysin (red), GFP (green), and nuclei (blue). The lower panels show enlarged images of field of interest indicated by the box in the upper panels (M). n = 10 neurons for LC3-positive puncta counting, MitoSOX and TMRM staining quantifications, n = 10 for EPR, n = 3 for CcO activity and ATP level, and n = 20 neurons for quantifications of length of dendrites and synaptophysin-positive clusters. Scale bars = 25 μm in B.
Figure 8
Figure 8
PINK1 deficiency accelerates amyloid-β accumulation and exaggerates abnormalities in LTP, learning and memory, and mitochondrial function in mAPP mice. (A) Representative immunoblots show immunoreactive bands for PINK1 protein from hippocampal homogenates of non-transgenic (non-Tg) PINK1 knockout (Pink1−/−), mAPP, and mAPP/Pink1−/− mice at 5–6 months of age, and β-actin served as a loading control. The bar graph (A) presents quantification of immunoreactive bands for PINK1 protein normalized to β-actin. n = 3 mice per group. (B and C) Amyloid-β levels in hippocampi of mAPP and mAPP/Pink1−/− mice (5–6 months old) were measured by amyloid-β ELISA. n = 6 mice per group. (D and E) LTP was recorded in hippocampal CA1 neurons of the indicated mice. Data are presented as mean ± SE. n = 3–5 mice per group. (F–I) Effect of PINK1 knockout on learning and memory in mAPP mice. Learning and memory were tested using a Morris water maze (MWM) in the indicated groups of mice. (F) Mean escape latency to the hidden platform during each day of the training session. *P < 0.01 compared to non-transgenic, Pink1−/− and mAPP mice. (G) Mean number of crossings of the target during probe trials. (H) Time spent in the quadrant with the hidden platform in probe trials. (I) Pattern of representative searching traces for the indicated transgenic (Tg) mice in search of the target. n = 5–10 mice per group. (J and K) CcO (complex IV, J) activity and ATP levels (K) in brain hippocampal tissues of the indicated mice. n = 6 mice per group. Quantification of EPR spectra (L) in the indicated transgenic mice. Data are expressed as fold increase relative to non-transgenic mice. (M) Representative spectra of EPR. The peak height in the spectrum indicates levels of ROS. n = 5–6 mice per group.

References

    1. Abramowski D, Rabe S, Upadhaya AR, Reichwald J, Danner S, Staab D, et al.Transgenic expression of intraneuronal Abeta42 but not Abeta40 leads to cellular Abeta lesions, degeneration, and functional impairment without typical Alzheimer's disease pathology. J Neurosci 2012; 32: 1273–83. - PMC - PubMed
    1. Akizuki M, Yamashita H, Uemura K, Maruyama H, Kawakami H, Ito H, et al.Optineurin suppression causes neuronal cell death via NF-kappaB pathway. J Neurochem 2013; 126: 699–704. - PubMed
    1. Ashrafi G, Schlehe JS, LaVoie MJ, Schwarz TL. Mitophagy of damaged mitochondria occurs locally in distal neuronal axons and requires PINK1 and Parkin. J Cell Biol 2014; 206: 655–70. - PMC - PubMed
    1. Barrachina M, Maes T, Buesa C, Ferrer I. Lysosome-associated membrane protein 1 (LAMP-1) in Alzheimer's disease. Neuropathol Appl Neurobiol 2006; 32: 505–16. - PubMed
    1. Batlevi Y, La Spada AR. Mitochondrial autophagy in neural function, neurodegenerative disease, neuron cell death, and aging. Neurobiol Dis 2011; 43: 46–51. - PMC - PubMed

MeSH terms