. 2018 Apr:14:423-438.
doi: 10.1016/j.redox.2017.10.013. Epub 2017 Oct 17.

STAT3-RXR-Nrf2 activates systemic redox and energy homeostasis upon steep decline in pO2 gradient

Affiliations

STAT3-RXR-Nrf2 activates systemic redox and energy homeostasis upon steep decline in pO2 gradient

Subhojit Paul et al. Redox Biol. 2018 Apr.

Abstract

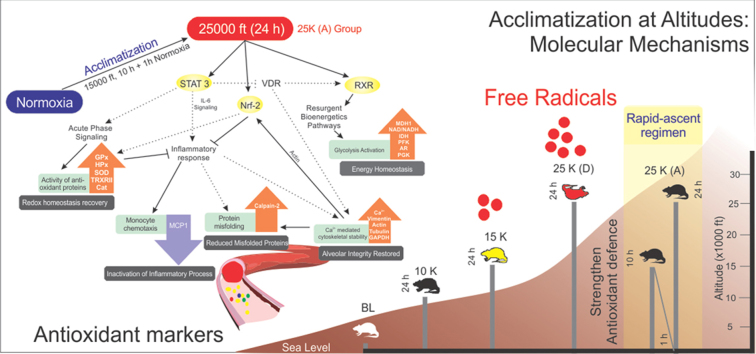
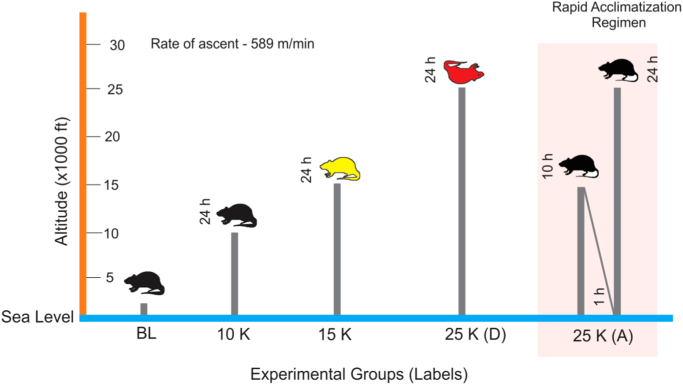
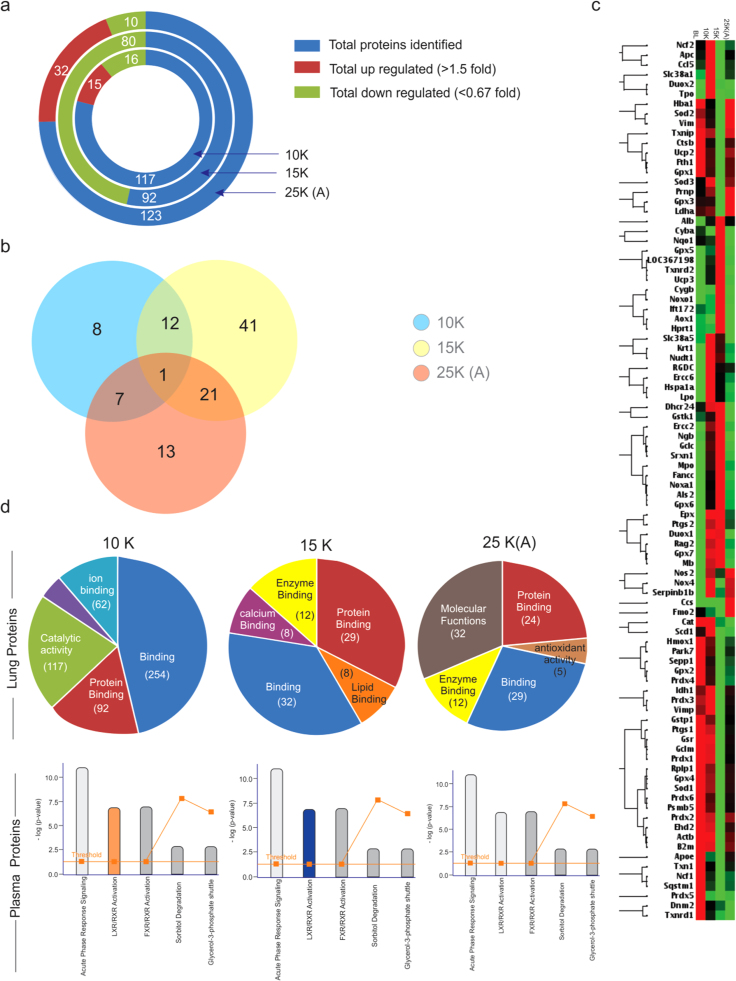
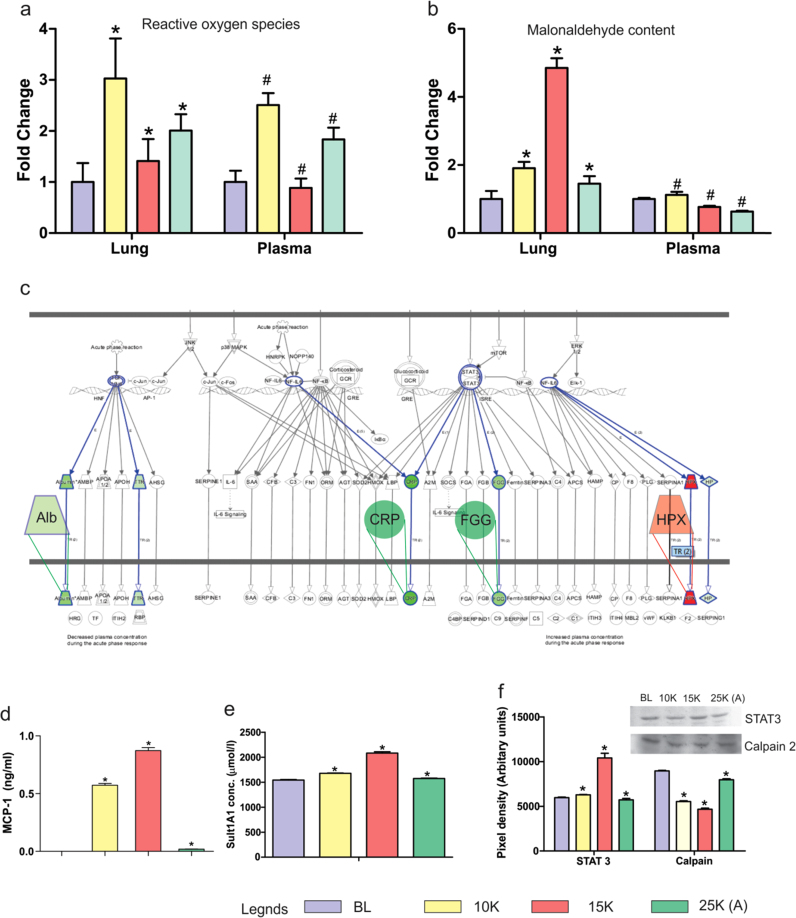
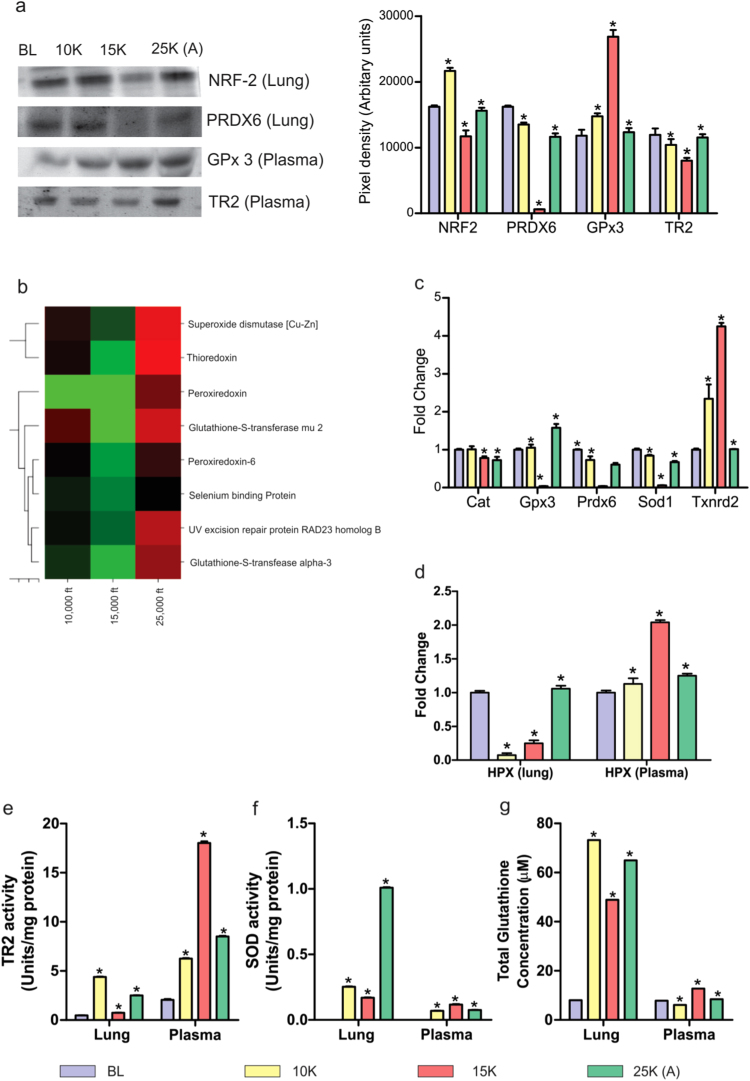
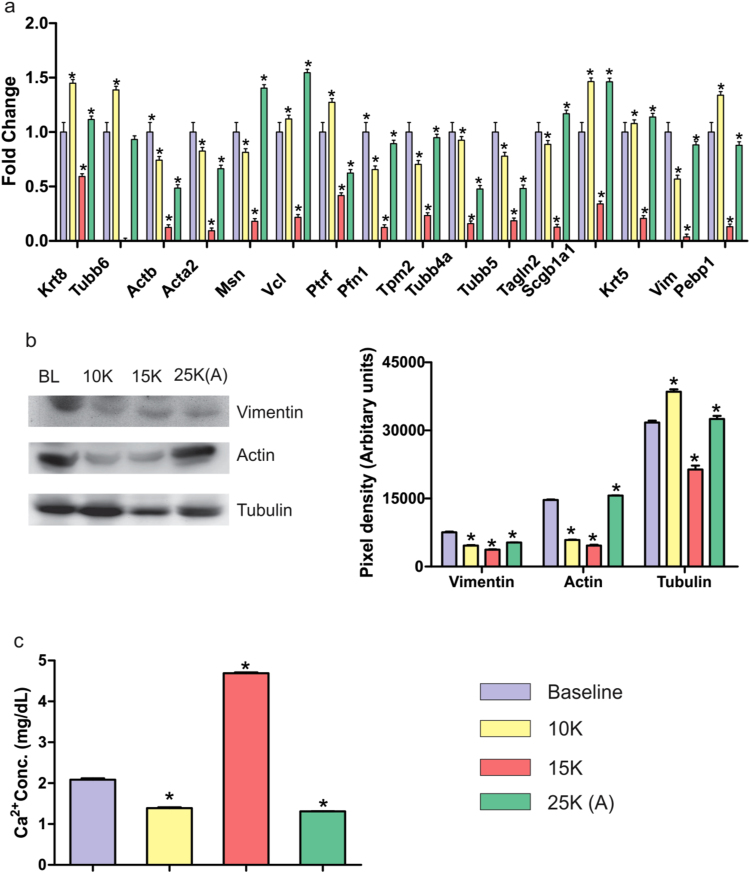
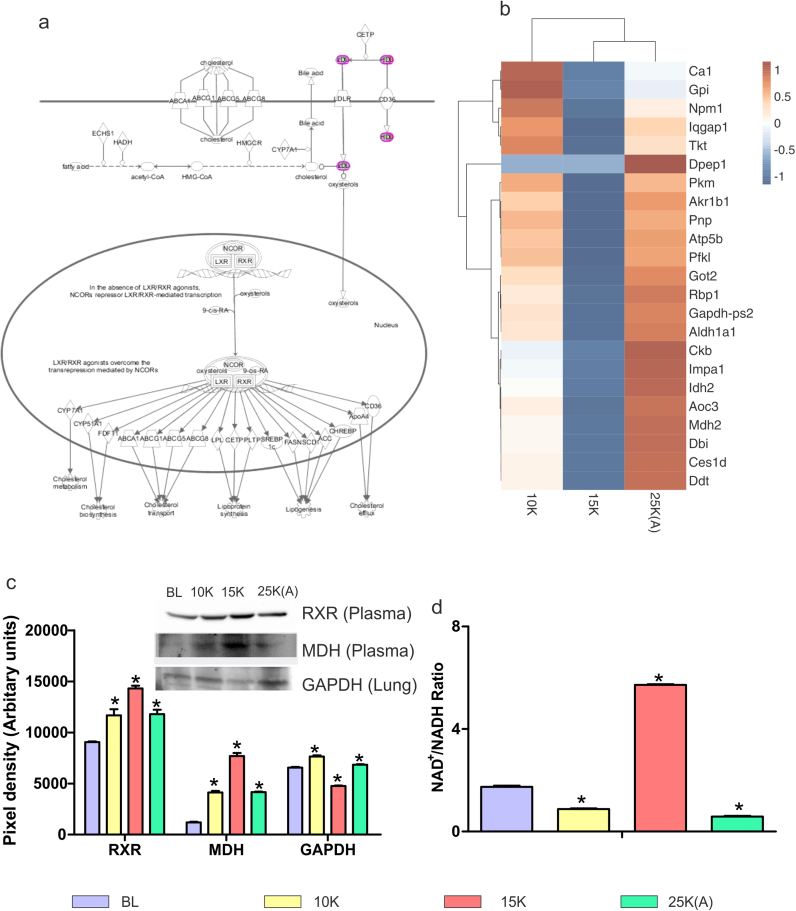
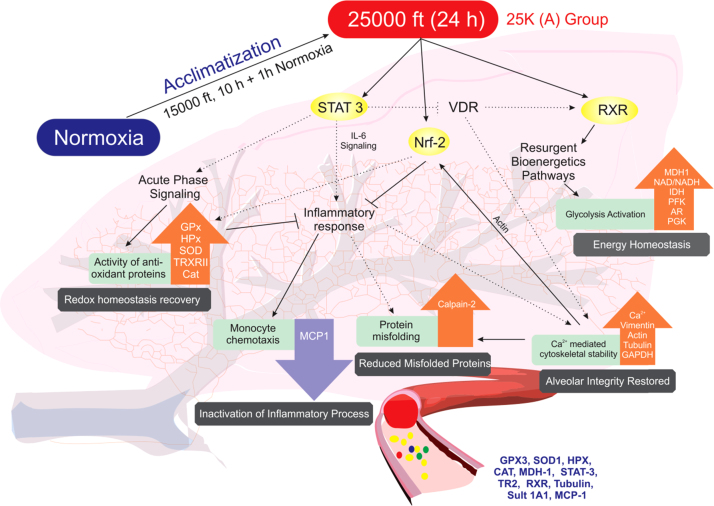
Hypobaric hypoxia elicits several patho-physiological manifestations, some of which are known to be lethal. Among various molecular mechanisms proposed so far, perturbation in redox state due to imbalance between radical generation and antioxidant defence is promising. These molecular events are also related to hypoxic status of cancer cells and therefore its understanding has extended clinical advantage beyond high altitude hypoxia. In present study, however, the focus was to understand and propose a model for rapid acclimatization of high altitude visitors to enhance their performance based on molecular changes. We considered using simulated hypobaric hypoxia at some established thresholds of high altitude stratification based on known physiological effects. Previous studies have focused on the temporal aspect while overlooking the effects of varying pO2 levels during exposure to hypobaric hypoxia. The pO2 levels, indicative of altitude, are crucial to redox homeostasis and can be the limiting factor during acclimatization to hypobaric hypoxia. In this study we present the effects of acute (24h) exposure to high (3049m; pO2: 71kPa), very high (4573m; pO2: 59kPa) and extreme altitude (7620m; pO2: 40kPa) zones on lung and plasma using semi-quantitative redox specific transcripts and quantitative proteo-bioinformatics workflow in conjunction with redox stress assays. It was observed that direct exposure to extreme altitude caused 100% mortality, which turned into high survival rate after pre-exposure to 59kPa, for which molecular explanation were also found. The pO2 of 59kPa (very high altitude zone) elicits systemic energy and redox homeostatic processes by modulating the STAT3-RXR-Nrf2 trio. Finally we posit the various processes downstream of STAT3-RXR-Nrf2 and the plasma proteins that can be used to ascertain the redox status of an individual.

Keywords: Cytoskeleton; Energy homeostasis; Hypoxia; Network biology; Nrf2; RXR; Redox homeostasis; STAT3; pO(2) gradient.


Figures

fx1
Graphical abstract
Fig. 1
Fig. 1
Study Design. Male SD rats (10 week old; 200–230 g) were exposed to Normobaric normoxia (BL; 99 kPa; n = 9), 3049 m (10 K; 71 kPa; n = 9), 4573 m (15 K; 59 kPa; n = 9), 7620 m (25 K; 40 kPa; n = 18). Exposure to 40 kPa was provided to two separate groups. One group (25 K (D); n = 9) was exposed directly to 40 kPa while the other group (25 K (A); n = 9) was given an acclimatization for 10 h at 59 kPa and 1 h at 99 kPa. All exposures were simulated in hypobaric hypoxia chamber with the rate of ascent being 589 m/min and temperature (25 °C) and humidity (50%). Zero animals survived in 25 K (D) group while all animals (9) survived in 25 K (A) group. Upon biochemical and omics-based investigation on lung tissue and plasma, we observed 15 K group (yellow) had maximum perturbations in redox and energy homeostasis with failing housekeeping functions in lung tissue while all other groups (black) had minimal/reduced molecular perturbations. 25 K (D) group (red) could not be probed as all animals in this group died on exposure. The experiment was repeated thrice for statistical significance with each group having three rats per experimental replicate.
Fig. 2
Fig. 2
Overview of Proteome and redox-specific transcripts alongwith affected pathways. a). The total number of proteins (blue) identified in 10 K, 15 K and 25 K (A) groups alongwith number of up-regulated (maroon) and down-regulated (green) proteins during LC-MS/MS (iTRAQ labeled) analysis of lung tissue. 15 K group has the least number of proteins identified (92) with the maximum number of down-regulated proteins (80). 25 K (A) group had the highest number of proteins identified (123) among which 32 were up-regulated and 10 down-regulated. 10 K had 117 proteins identified with 15 up-regulated and 16 down-regulated proteins. Fold change value greater than 1.5 fold was considered up-regulation while fold change value lesser than 0.67 was considered as down-regulation. b). Venn diagram showing overlapping up- and down- regulated proteins among the proteins in 10 K (blue), 15 K (yellow) and 25 K (A) (pink) groups. Fold change values of 1.5 or more and 0.66 or less were the criteria for choosing up-regulated and down-regulated proteins respectively. Venn diagram was created using Venny 2.1 (Oliveros, J.C. (2007–2015) Venny. An interactive tool for comparing lists with Venn's diagrams.http://bioinfogp.cnb.csic.es/tools/venny/index.html). Only a single protein was common between 10 K, 15 K and 25 K (A) groups. The maximum number of overlapping proteins was between 15 K and 25 K (A) groups (22). The minimum number of overlapping proteins was between 10 K and 25 K (A) (08). c). Clustergram with maximum join type hierarchical clustering comparing the redox-stress specific transcripts’ up-regulation (red) and down-regulation (green) among BL (baseline-normoxic control), 10 K, 15 K and 25 K (A) groups. PCR-Array specific to redox-stress specific transcripts was used to generate ΔΔCT values (RT-PCR) for all four groups (BL, 10 K, 15 K & 25 K (A)) which were further analyzed using RT2 Profiler PCR Array Data Analysis Version 3.5 from Qiagen. 15 K and 25 K (A) group shown anti-trends while 25 K (A) trends for transcripts match those observed in 10 K and BL. Cut-off value for analysis was 1.5. d). Gene ontology analysis of lung proteome revealed that Binding and Protein binding processes dominate across all three groups while 25 K (A) group has molecular functions as the top-most molecular function. Pathway analysis (IPA) of plasma proteins reveals that LXR/RXR Activation is perturbed in 10 K (up-regulated; saffron; z-score > 2) and 15 K (down-regulated; blue; z-score < 2) groups while its normalized in 25 K (A) (gray; z-score either zero or non-significant) group. Acute phase signaling remains the pathway with the maximum number of proteins across all three groups. A co-relation is indicated between the molecular functions in lung proteome and the perturbed pathway in plasma proteome.
Fig. 3
Fig. 3
Redox processes and Acute phase signaling. a). ROS levels were measured in both lung and plasma using DCFH-DA assay. The assay was performed in triplicates with three readings per group per experiment. ROS levels in both lung (fold change 3) and plasma (fold change 2.5) increase in 10 K, decrease in 15 K (Lung: fold change 1.5; Plasma: fold change 0.8) and finally increase marginally in 25 K (A) (Lung: fold change 2; Plasma: fold change 1.8). Results are presented as Mean ± SEM. Mean was calculated from the three separate experimental replicates. * represents p-value < 0.001 in lung tissue while # represents p-value < 0.005 in plasma. b). MDA (malondialdehyde) levels were measured in both lung and plasma using TBARS assay. In lung, MDA levels increase slightly in 10 K group (fold change 2), become highest in 15 K group (fold change 5) and decline significantly in 25 K (A) group (fold change 1.6). In plasma, there is a slight increase in 10 K group (fold change 1.3) before subsequently declining in 15 K (fold change 0.7) and 25 K (A) (fold change 0.5). Results are presented as Mean ± SEM. Mean was calculated from the three separate experimental replicates. * represents p-value < 0.001 in lung tissue while # represents p-value < 0.05 in plasma. c). Expanded view (representative of 15 K group) of IPA mined Acute phase signaling pathway with overlaid up-regulated (red) and down-regulated (green) proteins identified in plasma proteome (Supplementary dataset S3). d). Monocyte chemoattractant protein-1 (MCP-1) levels were measured in plasma. It is an indicator of monocyte activity and inflammatory stimuli. MCP-1 levels increased sharply in 10 K (0.6 ng/ml) and 15 K (0.8 ng/ml) before declining sharply in 25 K (A) (0.1 ng/ml). Results are presented as Mean ± SEM. Mean was calculated from three separate experimental replicates. * represents p-value < 0.001. e). Sulfotransferase 1A1 (Sult 1A1) levels were measured in plasma. It is an indicator of hypoxic stress and found elevated in HAPE patients’ plasma . ELISA results show it increases in 10 K (1600 µmol/l) and 15 K (2200 µmol/l) as compared to Baseline (BL; 1500 µmol/l) while levels in 25 K (A) group are almost equal to BL. Results are presented as Mean ± SEM. Mean was calculated from the three separate experimental replicates. * represents p-value < 0.001. f). Representative immunoblots of STAT-3 and Calpain-2 in plasma with bar-graphs showing differential levels of both proteins. STAT-3 levels increase drastically in 15 K group (10,000 AU) while other groups have similar levels (approx. 5000–7000 AU). Calpain-2 decreases in 10 K (6000 AU) and 15 K (4000 AU) group as compared to BL (9000 AU) with significant recovery in 25 K (A) group (8000 AU). The anti-trends observed in STAT-3 and Calpain-2 levels across the four groups indicate a systemic transcriptional activation and down-regulation of proteolysis that reaches its peak in 15 K group and is reverted to BL levels in 25 K (A) groups. Results are presented as Mean ± SEM of autoradiograms’ pixel intensities (Arbitrary units). Mean was calculated from three separate experimental replicates. * represents p-value < 0.001.
Fig. 4
Fig. 4
Nrf2 signaling in lung and its downstream systemic effects. a). Representative immunoblots of Nrf2 and PRDX6 in lung tissue and of GPX3 and TR2 in plasma with bar-graph depicting their levels in each group. Lung tissue: Nrf2 levels increase in 10 K (22,000 AU), decrease in 15 K (12,000 AU) and revert to BL levels (16,000 AU) in 25 K (A) group. PRDX6 slightly decrease in 10 K (14,000 AU), decline drastically in 15 K (1000 AU) and recover sharply in 25 K (A) (11,000 AU) as compared to BL (17,000 AU). Plasma: GPX3 levels increase slightly in 10 K (14,000 AU), increase further (27,000 AU) and decline to close to normoxic levels (11,000 AU) in 25 K (A) group. TR2 levels decline noticeably in 15 K group (7000 AU) and recover close to normoxic levels (11,000 AU) in 25 K (A) group. Results are expressed as Mean ± SEM of autoradiograms’ pixel intensities (Arbitrary units). Mean was calculated from three separate experimental replicates. * represents p-value < 0.001. b). Heat map representing the statistically significant antioxidant proteins’ perturbations across 10 K, 15 K and 25 K (A) groups. The trends observed across the three groups were based on normalized fold change values where baseline (BL) group had fold change value of 1. Green signifies downregulation and red signifies up-regulation. Fold change values ≤ 0.66 signified down-regulation while ≥ 1.4 signified up-regulation of protein level. c). Fold change values of select redox-stress specific transcripts from PCR-Array performed using lung tissue. Across major antioxidants’ transcripts 15 K group samples show declining levels, except in Txnrd2 (TR2) which shows increased fold change in 15 K group. d). ELISA was performed on lung tissues and plasma to assess Hemopexin levels. In lung tissue, hemopexin declines in 10 K (0.1 fold change) and 15 K groups (0.25 fold change) and rebounds to normoxic levels (1.0 fold change) in 25 K (A) group. In plasma, there is significant increase in hemopexin levels in 15 K (2.1 fold change) before levels decline in 25 K (A) (1.3 fold change) Bar graph depicts results from each group as Mean ± SEM. Mean was calculated from three separate experimental replicates. * represents p-value < 0.001. e). Bar graph depicting thioredoxin reductase 2 (TR2) activity levels in each group across lung tissue and plasma. In 15 K group, lung tissue show maximum decline in TR2 activity (1 unit/mg protein) while plasma has highest activity (19 units/mg protein). In 25 K (A) group, TR2 activity resurges in lung (3 units/mg protein) but declines in plasma (8 units/mg protein). Results are depicted as Mean ± SEM. Mean was calculated from three separate experimental replicates. * represents p-value < 0.001. f). Bar graph depicting Superoxide dismutase (SOD) activity levels in each group across lung tissue and plasma. In 15 K group, lung tissue witness a decline in SOD activity (0.2 units/mg protein) while plasma shows increased SOD activity (0.2 units/mg protein). In 25 K (A) group, lung tissue has highest SOD activity (1.0 unit/mg protein) while plasma SOD activity declines (0.1 unit/mg protein). Results are depicted as Mean ± SEM. Mean is calculated from three separate experimental replicates. * represents p-value < 0.001. g). Bar graph depicting total glutathione (GSH) concentration in all groups across lung tissue and plasma. In lung tissue, GSH levels increase in 10 K (75 µM), decrease in 15 K (47 µM) and increase again in 25 K (A) (65 µM). In plasma, GSH levels decrease slightly in 10 K (5 µM), increase in 15 K (13 µM) and fall back close to normoxic levels (7 µM) in 25 K (A). Results are depicted as Mean ± SEM. Mean was calculated from three separate experimental replicates. * represents p-value < 0.001.
Fig. 5
Fig. 5
Lung cytoskeletal stability in 25 K (A) group. a). Fold change values of various lung cytoskeletal proteins as observed in LC-MS/MS dataset. Across all cytoskeletal proteins, 15 K group shows notable decline while 25 K (A) group shows appreciable rebound. b). Representative immunoblots of Vimentin, Actin and Tubulin in lung tissue. Vimentin levels decrease till 15 K group with rebound in 25 K (A) group. Actin levels decrease significantly in 10 K and 15 K groups with 25 K (A) showing levels close to baseline. Tubulin levels also decline in 15 K with rebound in 25 K (A) group at a level close to baseline. Immunoblotting results are depicted as Mean ± SEM of autoradiograms’ pixel intensities (Arbitrary units). Mean was calculated from three separate experimental replicates. * represents p-value < 0.001. c). Bar graph representing free Ca2+ concentration in lung tissue across four groups. 15 K group shows significant increase in Ca2+ concentration (4.7 mg/dL) as compared to baseline (2 mg/dL) while 10 K and 15 K groups (1.5 mg/dL approx) show slight decreases. Results are represented as Mean ± SEM. Mean was calculated from three experimental replicates. * represents p-value < 0.001.
Fig. 6
Fig. 6
Restored energy homeostasis in 25 K (A) group. a). Expanded view of LXR/RXR Activation pathway from IPA. The various downstream metabolic processes modulated by LXR/RXR such as cholesterol metabolism and lipogenesis as well as upstream molecules like Bile acid and oxysterols are shown. b). Clustergram of 10 K, 15 K and 25 K (A) with baseline fold change values taken as 1 for lung proteins involved in energy homeostasis and metabolism. Color brown indicates up-regulation while blue indicates down-regulation with white indicating neutral fold change. Fold change values were subtracted from baseline fold change (1) for each protein across all groups to arrive at final fold change values for clustergram. 15 K and 25 K (A) groups show complete anti-trends with 10 K showing similarity with both the groups. c). Representative immunoblots and respective bar graphs of Retinoid X receptor (RXR) and Malate dehydrogenase (MDH) in plasma and Glyceraldehyde 3-phosphate Dehydrogenase (GAPDH) in lung tissue. RXR and MDH (plasma) have maximal levels in 15 K group with decline in 25 K (A) group at levels similar to 10 K group. GAPDH (lung) shows minimal levels in 15 K group with increase in 25 K (A) group to level close to 10 K group. Immunoblotting results are depicted as Mean ± SEM of autoradiograms’ pixel intensities (Arbitrary units). Mean was calculated from three separate experimental replicates. * represents p-value < 0.001. d). NAD/NADH ratio was estimated in lung tissue. 15 K group has highest ratio of NAD/NADH suggesting shift in pyruvate-lactate step towards lactate. 10 K and 25 K (A) groups show slight decrease in NAD/NADH ratio as compared baseline. Results are depicted as Mean ± SEM. Mean was calculated from three experimental replicates. * represents p-value < 0.005.
Fig. 7
Fig. 7
Putative protein cascades involved in rapid acclimatization in 25 K (A) group. Figure represents protein networks and processes involved in redox homeostasis, energy homeostasis, inflammatory signaling, protein misfolding and cytoskeletal (alveolar) integrity for 25 K (A). Dotted black lines represent events derived from literature. Bold black lines represent experimental findings. Central signaling molecules like STAT-3, Nrf and RXR begin cascade. STAT-3 levels fall back to normoxic levels in 25 K (A) group plasma causing lowered inflammatory signaling, increased VDR/RXR signaling and increased anti-oxidant response. Lowered inflammatory signaling is observed via MCP-1 levels as well as increased Calpain-2 levels. Increased VDR/RXR signaling helps restore energy homeostasis in 25 K (A) group as compared to 15 K group which is observed via NAD/NADH ratio and increased levels of glycolytic enzymes. VDR also plays a small role in calcium homeostasis. Free Ca2+ levels are reduced significantly in 25 K (A) group. This helps restore levels of cytoskeletal proteins with housekeeping functions. This, in part, causes alveolar structural integrity to endure extreme hypobaric conditions. Reduction in free Ca2+ levels also improves Calpain-2 levels. Actin is required for Nrf2 translocation into nucleus. When levels of actin are restored, Nrf2 mediated oxidative stress response is activated. Inflammatory signaling is further reduced due to it. Also, antioxidant protein levels increase to strengthen redox homeostasis. This entire process occurs within lung and plasma. Thus, proteins like GPX3, SOD1, HPX, CAT, MDH-1, STAT-3, TR2, RXR, Tubulin, Sult 1A1 and MCP-1 can provide important clues regarding the acclimatization status when their levels at normoxia and extreme hypobaric hypoxia (as in 25 K (A) group) are compared on following the stated acclimatization strategy of 10 h at 59 kPa followed by 1 h of normobaric normoxia exposure (99 kPa).

References

    1. Blumen I.J., Rinnert K.J. Altitude physiology and the stresses of flight. Air Med. J. 1995;14:87. - PubMed
    1. Nguyen M.H., Jafri M.S. Mitochondrial calcium signaling and energy metabolism. Ann. N.Y. Acad. Sci. 2005;1047:127. - PubMed
    1. De Marchi U., Thevenet J., Hermant A., Dioum E., Wiederkehr A. Calcium co-regulates oxidative metabolism and ATP synthase-dependent respiration in pancreatic beta cells. J. Biol. Chem. 2014;289:9182. - PMC - PubMed
    1. Catrina S.-B., Okamoto K., Pereira T., Brismar K., Poellinger L. Hyperglycemia regulates hypoxia-inducible factor-1α protein stability and function. Diabetes. 2004;53:3226. - PubMed
    1. Yamada N. Genetic variation in the hypoxia-inducible factor-1α gene is associated with type 2 diabetes in Japanese. J. Clin. Endocrinol. Metab. 2005;90:5841. - PubMed

Publication types