. 2017 Oct 31;114(44):E9271-E9279.
doi: 10.1073/pnas.1703921114. Epub 2017 Oct 16.

Targeting autophagy inhibits melanoma growth by enhancing NK cells infiltration in a CCL5-dependent manner

Affiliations

Targeting autophagy inhibits melanoma growth by enhancing NK cells infiltration in a CCL5-dependent manner

Takouhie Mgrditchian et al. Proc Natl Acad Sci U S A. .

Abstract

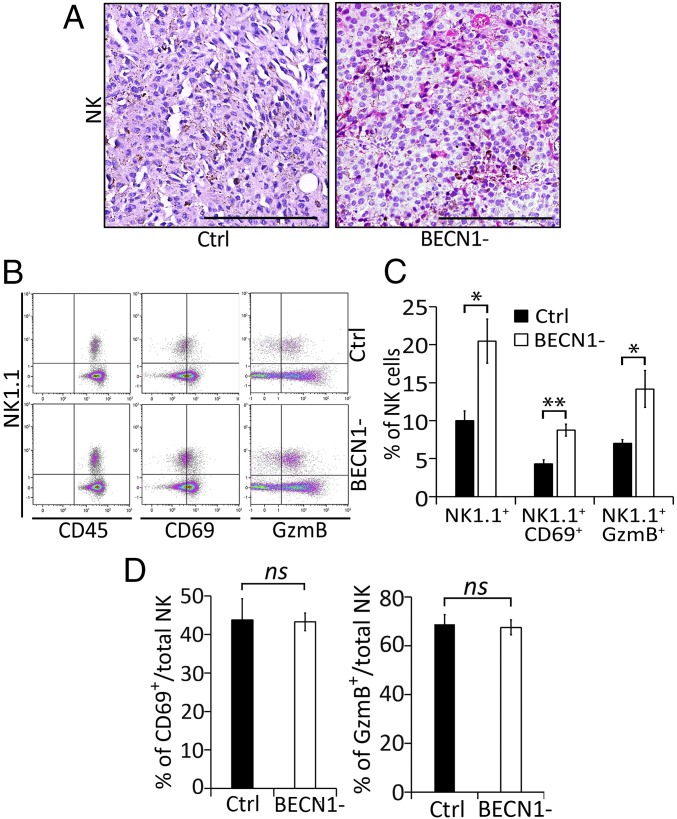
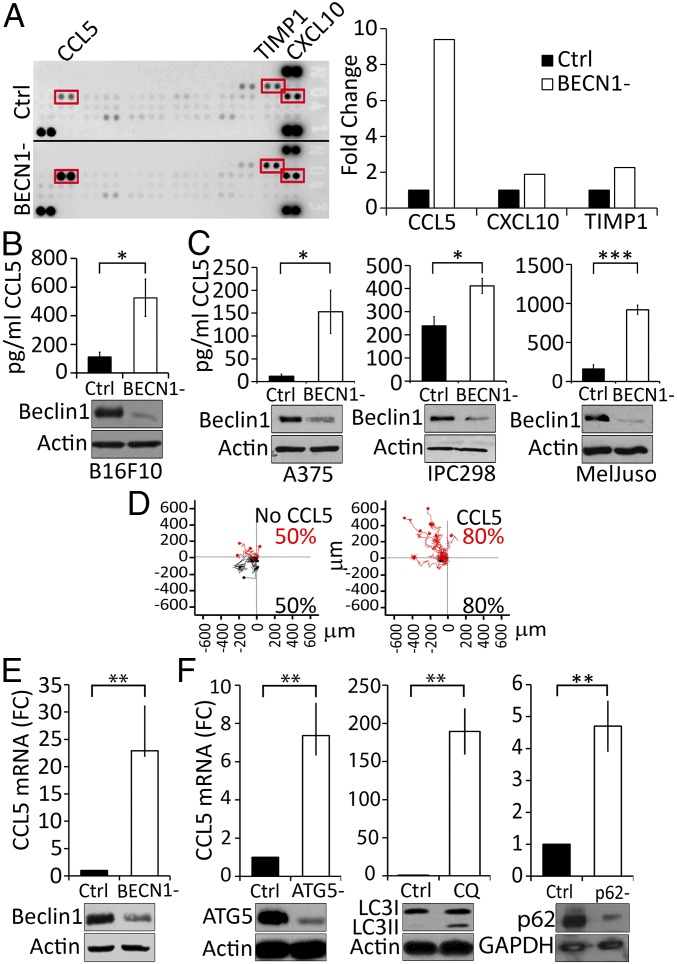
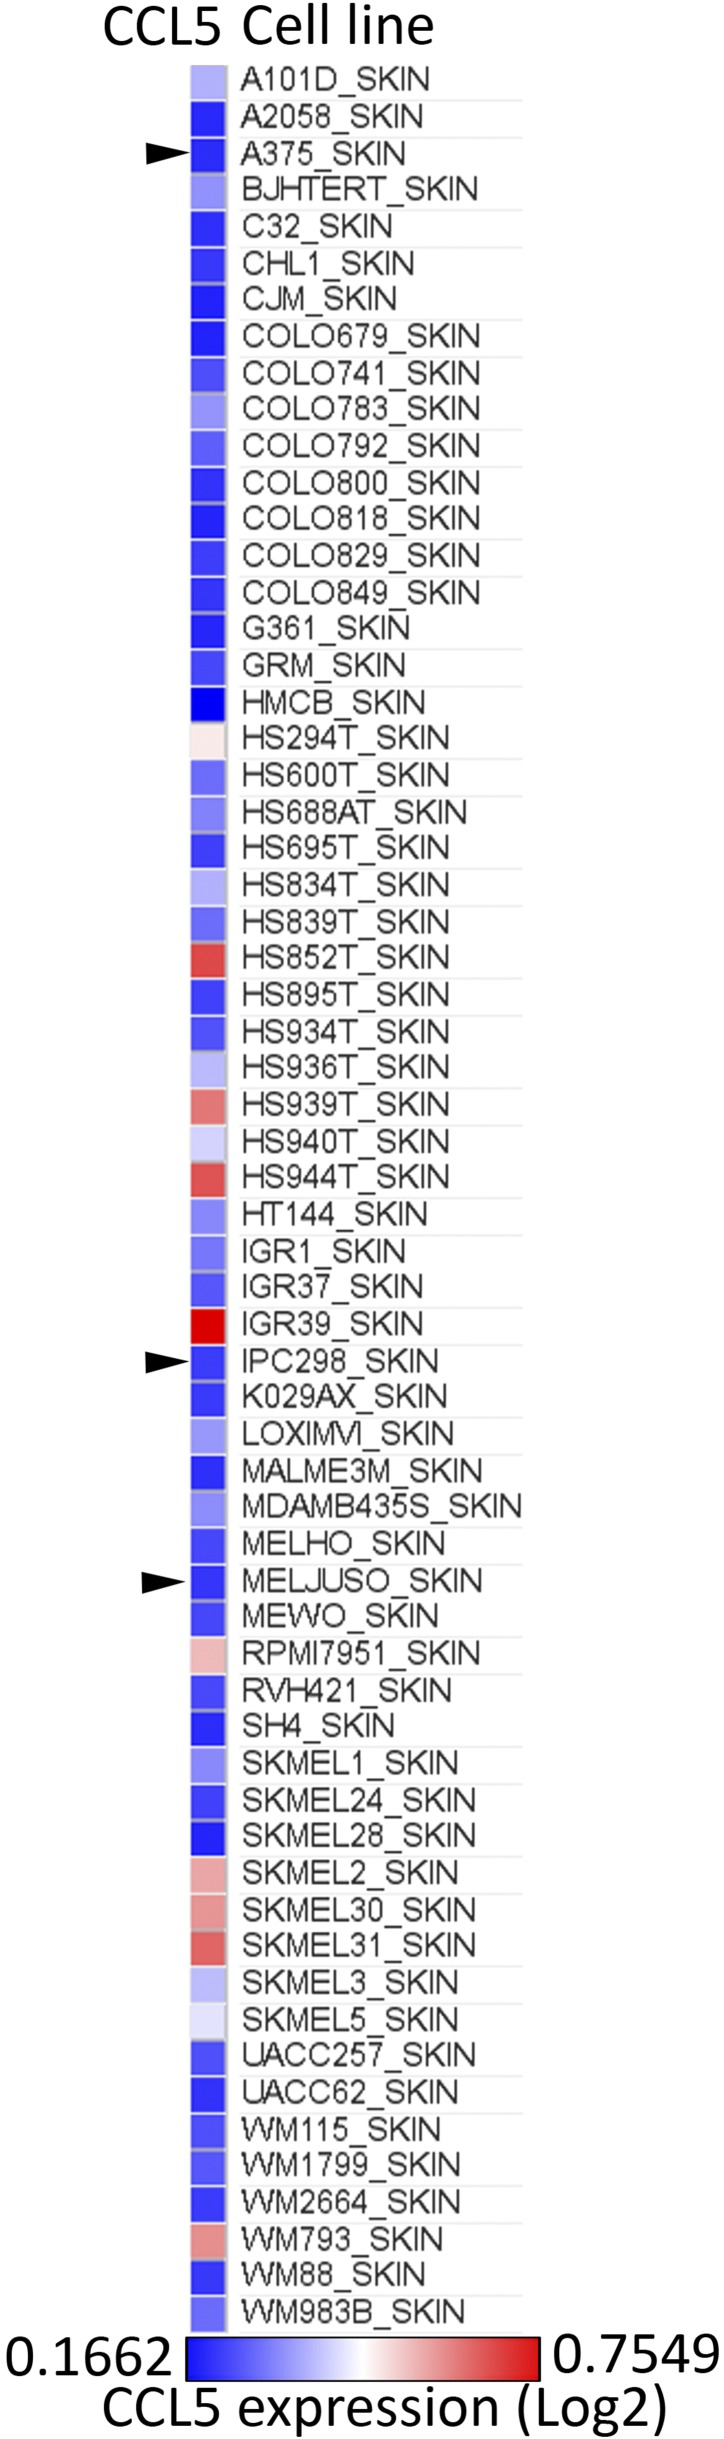
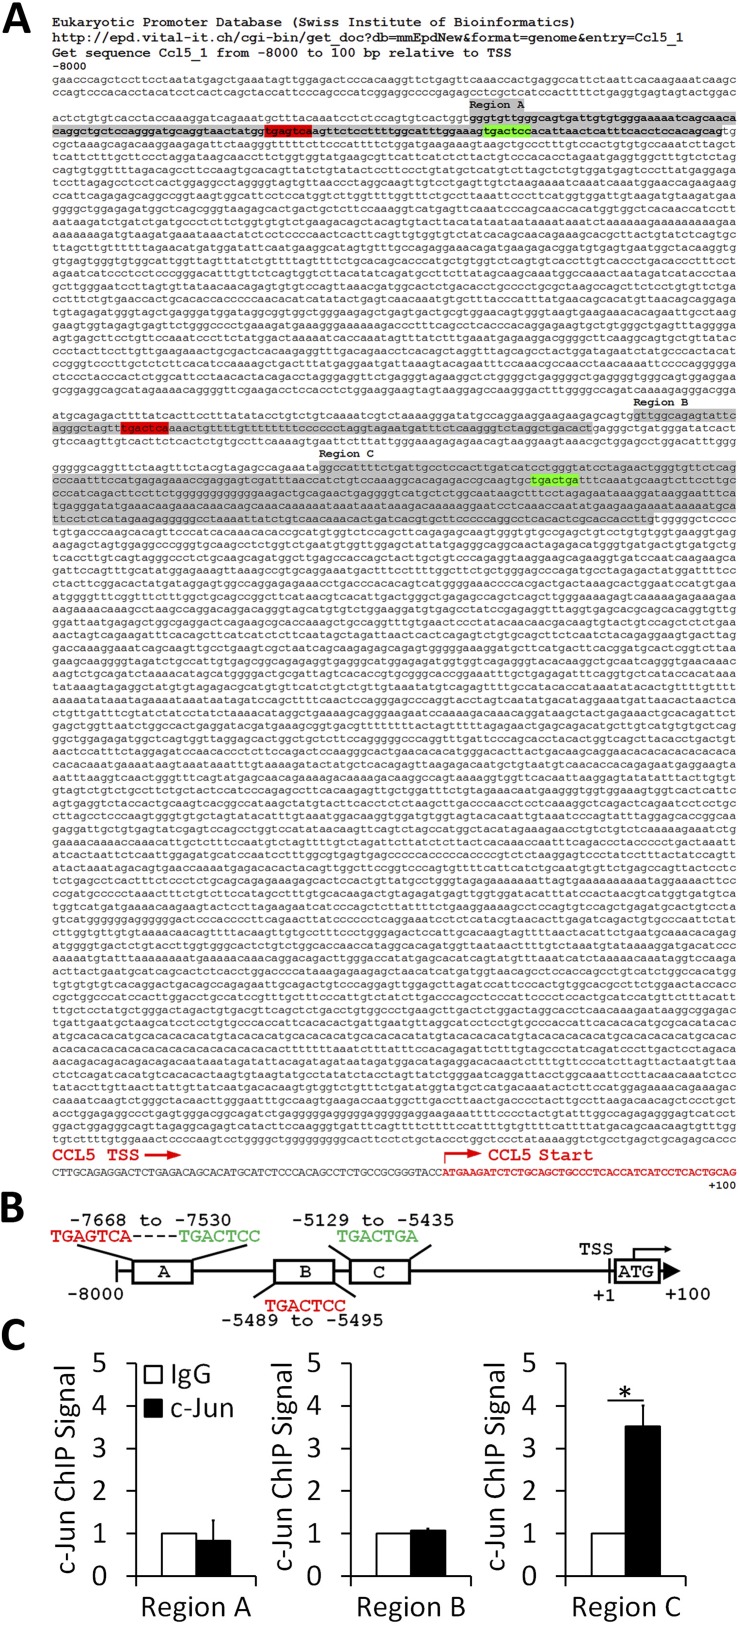
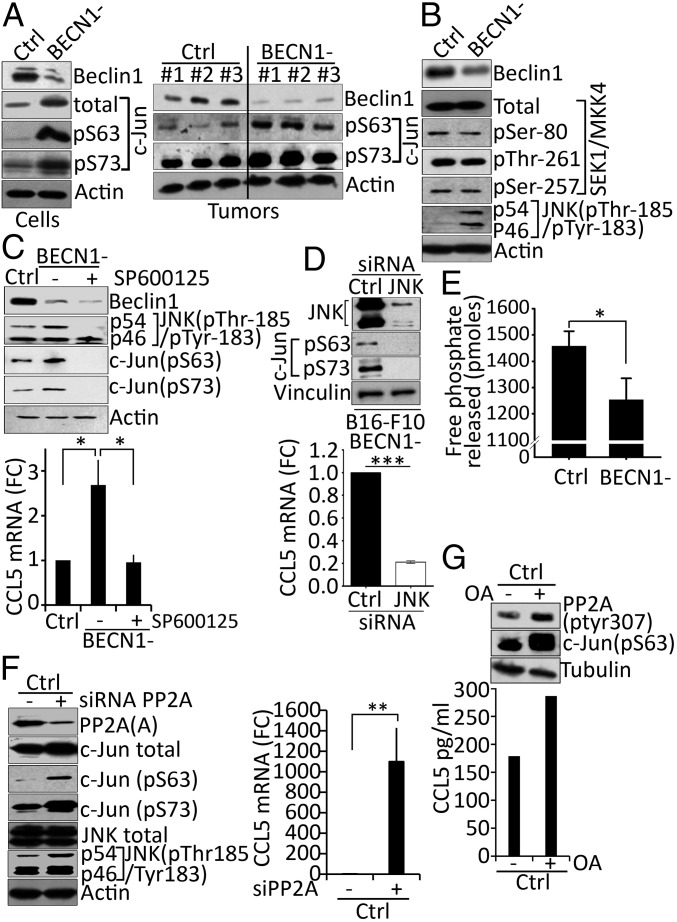
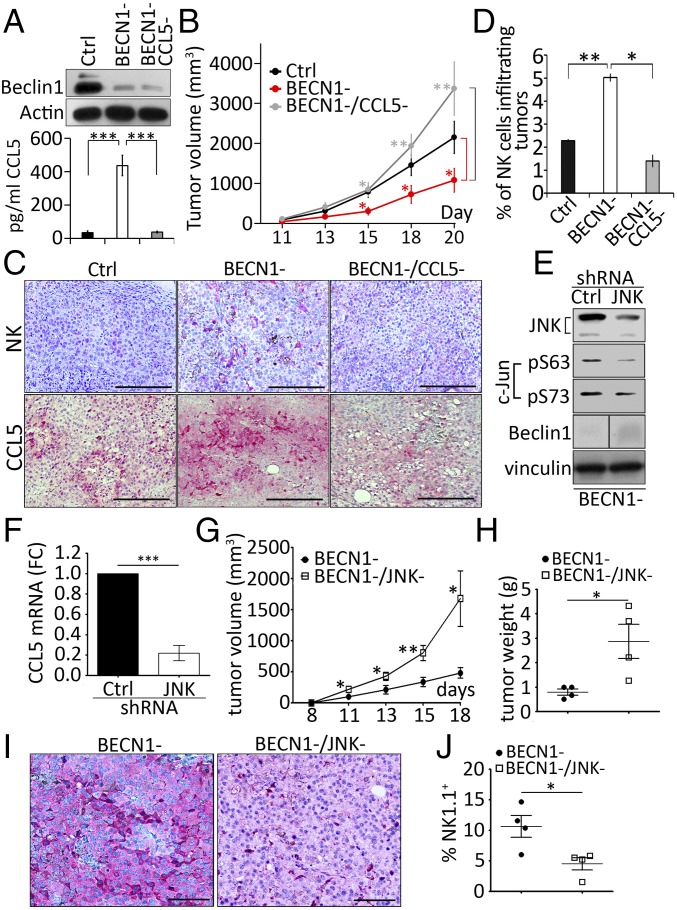
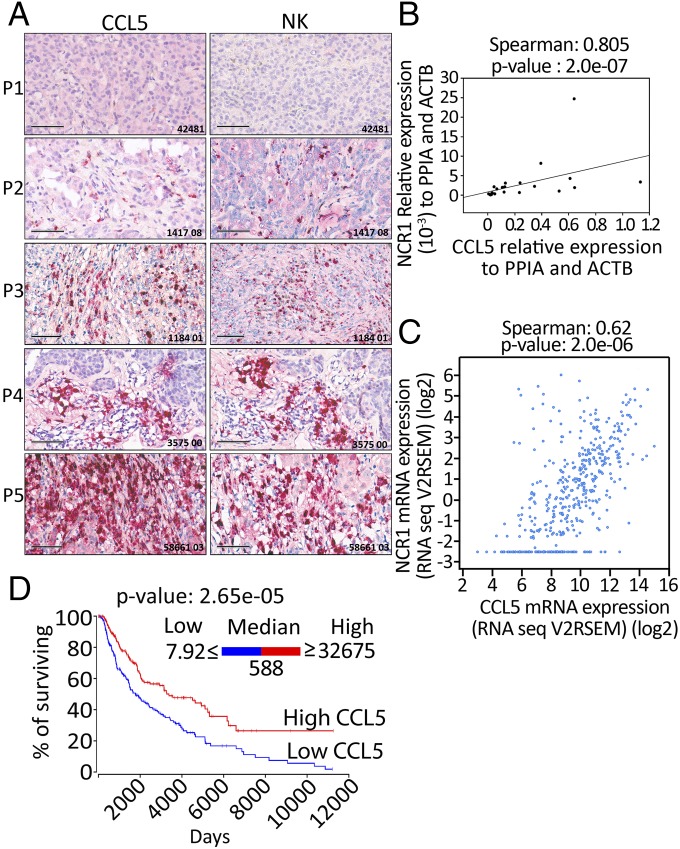
While blocking tumor growth by targeting autophagy is well established, its role on the infiltration of natural killer (NK) cells into tumors remains unknown. Here, we investigate the impact of targeting autophagy gene Beclin1 (BECN1) on the infiltration of NK cells into melanomas. We show that, in addition to inhibiting tumor growth, targeting BECN1 increased the infiltration of functional NK cells into melanoma tumors. We provide evidence that driving NK cells to the tumor bed relied on the ability of autophagy-defective tumors to transcriptionally overexpress the chemokine gene CCL5 Such infiltration and tumor regression were abrogated by silencing CCL5 in BECN1-defective tumors. Mechanistically, we show that the up-regulated expression of CCL5 occurred through the activation of its transcription factor c-Jun by a mechanism involving the impairment of phosphatase PP2A catalytic activity and the subsequent activation of JNK. Similar to BECN1, targeting other autophagy genes, such as ATG5, p62/SQSTM1, or inhibiting autophagy pharmacologically by chloroquine, also induced the expression of CCL5 in melanoma cells. Clinically, a positive correlation between CCL5 and NK cell marker NKp46 expression was found in melanoma patients, and a high expression level of CCL5 was correlated with a significant improvement of melanoma patients' survival. We believe that this study highlights the impact of targeting autophagy on the tumor infiltration by NK cells and its benefit as a novel therapeutic approach to improve NK-based immunotherapy.

Keywords: CCL5; autophagy; immunotherapy; melanoma; natural killer.


Conflict of interest statement

The authors declare no conflict of interest.

Figures

Fig. 1.
Fig. 1.
BECN1 B16-F10 tumors contain higher numbers of active NK cells compared with Ctrl tumors. (A) Immunohistochemical staining of NK cells performed on control (Ctrl) or BECN1 B16-F10 tumor sections using anti–Asialo-GM1. (Scale bar, 200 µm.) (B) Tumor-infiltrating NK cells were stained with NK1.1, CD69-, and GzmB-specific antibodies. Total NK cells (CD45+NK1.1+) were gated and the percentage of active NK cells (NK1.1+CD69+ and NK1.1+GzmB+) was determined by multicolor flow cytometry. Images represent flow cytometric plots of CD45+NK1.1+, NK1.1+CD69+, and NK1.1+GzmB+ cells infiltrating Ctrl and BECN1 B16-F10 tumors. (C) Quantification of total NK1.1+ and active (NK1.1+CD69+ and NK1.1+GzmB+) NK cells infiltrating Ctrl and BECN1- B16-F10 tumors, reported as a percentage (%). (D) Quantification of CD69+/NK1.1+ (Left) and GzmB+/NK1.1+ (Right) cells infiltrating control Ctrl and BECN1 B16-F10 tumors, reported as a percentage (%). Results are the average ± SEM of three mice from each group. *P < 0.05; **P < 0.01; ns, not significant (two-tailed Student’s t test).
Fig. S1.
Fig. S1.
Gating strategy and flow cytometric analysis. (A) Data represent dot plots demonstrating the gating and analytical processes for NK1.1, CD69, and GzmB staining of CD45+CD11bCD19 cells from B16-F10 tumors. Cell suspensions harvested from tumors were stained with BV421–anti-NK1.1, Al700–anti-CD19, APC-R700–anti-CD11b, BUV395–anti-CD45, BV605–anti-CD69, Pacific blue anti-GzmB, and near IR-live/dead. Cells were first gated for forward scatter-A (FSC-A) vs. side scatter-A (SSC-A), and then for cell singlets forward scatter-A (FSC-A) vs. forward scatter-W (FSC-W). Live cells were gated and the gate encompassing CD45+CD11bCD19 cells were analyzed for the expression of NK1.1, GzmB, and CD69. The quadrants were defined based on the cells stained with fluorescence-minus-one (FMO) and then applied to the plots of cells stained with positive antibodies, as shown in Fig. 1A. (B) Data represent dot plots demonstrating the gating and analytical processes for CCR1, CCR3, and CCR5 staining of NK1.1+ and tumor (CD45) cells gated as described in A. The gates encompassing for NK1.1+ and CD45 cells were analyzed for their expression of CCR1, CCR3, and CCR5. The quadrants were defined based on the cells stained with FMO and then applied to the plots of cells stained with positive antibodies, as shown in Figs. S3 and S4.
Fig. 2.
Fig. 2.
BECN1 melanoma cells secrete high level of CCL5. (A, Left) Identification of cytokines in the supernatants of Ctrl (up) and BECN1 (down) B16-F10 cells using a Mouse Cytokine Array. Highly expressed cytokines (CCL5, TIMP1, and CXCL10) regulated in BECN1 cells are highlighted in red. (Right) Quantification of CCL5, TIMP1, and CXCL10 spots of the Left panel reported as fold-change compared with the Ctrl. (B) Quantification of CCL5 in the supernatant of Ctrl and BECN1 B16-F10 cells by ELISA. Results are the average ± SEM of three independent experiments. *P < 0.05 (two-tailed Student’s t test). (C) Expression of CCL5 in A375, IPC298, and MelJuso human melanoma cell lines. (Upper) Quantification of CCL5 secretion by ELISA in the supernatants of the indicated human melanoma cells transfected with either control (Ctrl) or BECN1 siRNA (BECN1). Data represent the average ± SEM of four (Left and Right) or three (Center) independent experiments. *P < 0.05; ***P < 0.001 (two-tailed Student’s t test). (Lower) Expression of Beclin1 protein was assessed by Western blot. Actin was used as loading control. (D) Migration of NK92MI cell line toward recombinant CCL5 gradient. Migration of NK cells toward serum-free medium in the absence (Left) or presence of 20 ng/mL of recombinant CCL5 (Right). Red and black points represent NK cells migrating to the top and bottom compartments, respectively. The percentage of migrating NK cells are reported in the bottom of each panel. (E) Expression of CCL5 mRNA in BECN1 B16-F10 cells (Upper). The expression of Beclin1 protein was assessed by Western blot. Actin was used as loading control. **P < 0.01 (two-tailed Student's t test). (F) Expression of CCL5 in B16-F10 cells transfected with ATG5 siRNA (ATG5-) and in cells treated with chloroquine (CQ) or transfected with p62/SQSTM1 siRNA (p62-) (Upper). The expression of ATG5, LC3-I and -II, as well as p62/SQSTM1 proteins was assessed by Western blot. Actin and GAPDH were used as loading controls. Results are reported as a fold-change (FC) compared with Ctrl. Data represent the average ± SEM of three independent experiments. **P < 0.01 (two-tailed Student’s t test).
Fig. S2.
Fig. S2.
Relative expression level of CCL5 in melanoma cell lines. Relative expression level of mRNA (log) in 162 skin cancer cell lines reported according to the Cancer Cell Line Encyclopedia (CCLE; https://software.broadinstitute.org/morpheus/). Black arrowheads indicate melanoma cell line used.
Fig. S3.
Fig. S3.
c-Jun binds directly to the AP-1 nonconsensus motif in the CCL5 promoter. (A) The sequence from −8,000 to +100 bp relative to TSS containing CCL5 promoter defined by the Eukaryotic Promoter Database (Swiss Institute of Bioinformatics). Consensus and nonconsensus AP-1 binding motifs are highlighted in red and green, respectively. Sequences flanking AP-1 motifs (regions A, B, and C) are highlighted in gray. The TSS and ATG positions are indicated. (B) Schematic representation of AP-1 binding motifs in CCL5 promoter containing region. The position of each motif is reported. (C) ChIP was performed on BECN1 B16-F10 cells using control isotype (IgG) or anti–c-Jun antibody followed by SYBR Green reverse-transcriptase qPCR using appropriate primers for regions A, B, and C. Reverse-transcription qPCR signals were normalized to the control. Statistically significant differences (indicated by asterisks) between control and c-Jun conditions are shown (*P < 0.05). Two separate experiments (in triplicates) with the same results were performed. Error bars indicate SD.
Fig. 3.
Fig. 3.
Targeting autophagy induces the up-regulation of CCL5 mRNA by increasing the phosphorylation of c-Jun. (A, Left) Expression of Beclin1, total c-Jun, phosphorylated c-Jun on serine 63 (pS63), and serine 73 (pS73) proteins in cell extracts from Ctrl and BECN1 B16-F10 cells. Actin was used as loading control. (Right) Expression of Beclin1, phosphorylated c-Jun on serine 63 (pS63), and serine 73 (pS73) proteins in three regions (#1, #2, #3) of Ctrl and BECN1 B16-F10 tumor extracts. Actin was used as loading control. (B) Expression of Beclin1, total and phosphorylated SEK/MKK4 on Ser-80, Thr-261, and Ser-257, and phosphorylated JNK on Thr-185/Tyr-183 in Ctrl and BECN1 B16-F10 melanoma cells. (C, Upper) Expression of Beclin1, phosphorylated JNK on Thr-185/Tyr-183, and phosphorylated c-Jun on serine 63 (pS63) and serine 73 (pS73) proteins in Ctrl and BECN1 cells untreated (−) or treated (+) with JNK inhibitor SP600125. Actin was used as loading control. (Lower) The expression of CCL5 mRNA in cells described in the Upper panel. Data are reported as fold-change (FC) compared with the Ctrl. *P < 0.05 (two-tailed Student's t test). (D, Upper) BECN1 B16-F10 melanoma cells were transfected with control (Ctrl) or JNK1/2 (JNK) siRNA. The expressions of JNK, Ser-63 (pS63), and Ser-73 (pS73) phosphorylated c-Jun were assessed 72 h after transfection. Vinculin was used as loading control. (Lower) The expression of CCL5 mRNA by real-time RT-PCR in cells described in A. Data represent the average ± SD of three independent experiments. ***P < 0.005 (two tailed Student’s t test). (E) PP2A phosphatase activity assay in Ctrl and BECN1 B16-F10 tumor cells. Data reported as picomoles of free phosphate released following incubation of PP2Ac immunoprecipitated from each cell with Threonine phosphopeptide. The result shown is the average ± SEM of five independent experiments performed in duplicate. *P < 0.05 (two-tailed Student’s t test). (F, Left) Expression of PP2A subunit A, total and phosphorylated c-Jun on serine 63 (pS63) and serine 73 (pS73) and total and phosphorylated JNK on Thr-185/Tyr-183 proteins in Ctrl B16-F10 cells untransfected (−) or transfected with PP2A siRNA targeting A subunit. Actin was used as loading control. (Right) Expression of CCL5 mRNA in the cells described in the Left panel. Data are reported as fold-change (FC) compared with the Ctrl. Results represent the average ± SEM of three independent experiments. **P < 0.01 (two-tailed Student’s t test). (G, Upper) Expression of phosphorylated PP2A on Tyr-307 PP2A and phosphorylated c-Jun on serine 63 (pS63) in Ctrl B16-F10 cells untreated (−) or treated (+) with okadaic acid (OA). (Lower) Quantification of CCL5 secreted by cells described in the Upper panel as determined by ELISA.
Fig. 4.
Fig. 4.
CCL5 is the major chemokine involved in the infiltration of NK cells into BECN1 B16-F10 tumor. (A, Upper) Expression of Beclin1 protein in Ctrl, BECN1, and BECN1/CCL5 cells. Actin was used as loading control. (Lower) Quantification of CCL5 secreted into the supernatants of the cells described in the Upper panel. Data represent the average ± SEM of three independent experiments. ***P < 0.001 (two-tailed t test). (B) Tumor cells described above were engrafted subcutaneously in C57BL/6 mice (n = 8 per group). Tumor volume was measured at the indicated days and the average ± SEM was reported. *P < 0.05; **P < 0.01 (two-tailed Student’s t test). (C) Immunohistochemical staining of NK cells (Upper) or CCL5 (Lower) performed on indicated tumor sections using anti–Asialo-GM1 and CCL5 antibodies, respectively. (Scale bars, 200 µm.) (D) Quantification of NK cells infiltrating Ctrl, BECN1 and BECN1/CCL5 tumors reported as a percentage (%) of the total number of cells for each tumor. Data represent the average ± SEM of two sections from two independent tumors. *P < 0.05; **P < 0.01; ns, not-significant (two-tailed Student’s t test). (E) BECN1 B16-F10 melanoma cells were infected with control (Ctrl) or JNK1/2 (JNK) shRNA. The expressions of JNK, c-Jun, and Beclin1 were assessed. Vinculin was used as loading control. The panel corresponding to the expression of Beclin1 was generated from the same blot but consolidated from noncontiguous loading. (F) The expression of CCL5 mRNA by real-time RT-PCR in cells described in E. Data represent the average ± SEM of three independent experiments. ***P < 0.005 (two tailed Student’s t test). (G) BECN1 and BECN1/JNK tumor cells described in E were engrafted subcutaneously in C57BL/6 mice (n = 5 or 6 per group). Tumor volume was measured at the indicated days and the average ± SEM was reported. *P < 0.05; **P < 0.01 (two-tailed Student’s t test). (H) The weight of BECN1 and BECN1/JNK tumors described in G at day 18. *P < 0.05 (two-tailed Student’s t test). (I) Immunohistochemical staining of CCL5 performed on BECN1 and BECN1/JNK tumor sections using anti-CCL5 antibody. (Scale bars, 100 µm.) (J) Quantification of NK cells infiltrating BECN1 and BECN1/JNK tumors reported as a percentage (%) of the total number of cells for each tumor. Data represent the average ± SEM of two sections from one independent tumor. *P < 0.05 (two-tailed Student’s t test).
Fig. S4.
Fig. S4.
The gating strategy used to quantify NK cell-infiltrating tumors.
Fig. 5.
Fig. 5.
CCL5 overexpression is correlated with the increase of NKp46 and the improvement of melanoma patients’ survival. (A) Twelve FFPE melanoma biopsy sections were stained with CCL5 (Left) or NKp46 (Right) antibodies and immunohistochemical analysis showed that tumor sections strongly positive for CCL5, also had an abundant number of NK cells. Five representative sections (P1 to P5) are reported. (Scale bars, 100 μm.) (B) RNA extracted from 22 melanoma biopsies were assessed for the expression of CCL5 and NKp46 encoding NCR1 gene. The Spearman test showed a significant and positive correlation between the expression of CCL5 and NCR1. (C) A similar Spearman correlation test was set up using RNA-Seq data of 471 skin cutaneous melanomas described in the TCGA database. A positive correlation was found between the expression of CCL5 and NCR1. The expression of each gene was reported as RNA-Seq V2RSEM (RNA-Seq expression estimation by expectation-maximization). (D) Kaplan–Meier survival plot of skin cutaneous melanoma (SKCM) patients generated using OncoLnc resource. TCGA data of 458 melanoma patients were assigned into low or high groups according to the expression level of CCL5 reported as RNASeq values. Patients having a CCL5 expression level ranging from 7.92 to 588 were considered as low (blue curve) and those having a CCL5 expression level ranging from 588 to 32,675 were considered as high (red curve). Statistically significant difference is indicated by P value.
Fig. S5.
Fig. S5.
Percentage of CCL5 receptors expressed on NK cells infiltrated in Ctrl and BECN1 B16-F10 tumors. NK cells infiltrating Ctrl and BECN1 B16-F10 tumors were stained with NK1.1-, CCR1-, CCR3-, and CCR5-specific antibodies and subjected to flow cytometric analyses. NK1.1+/CD45+CD11bCD19 cells were gated and the percentage of CCR1+, CCR3+, and CCR5+ NK cells were determined. (A) Representative flow cytometry plots of NK1.1+CCR1+, NK1.1+CCR3+, and NK1.1+CCR5+ in Ctrl and BECN1 B16-F10 tumors. Quadrant settings were based on the cells stained with FMO and then applied to the plots of cells stained with positive antibodies. (B) Percentage of CCR1+, CCR3+, and CCR5+ total NK cells infiltrating Ctrl and BECN1 tumors. Not-significant differences were observed in CCR1, CCR3, and CCR5 between Ctrl and BECN1 tumors.
Fig. S6.
Fig. S6.
Percentage of CCL5 receptors expressed in Ctrl and BECN1 B16-F10 tumors. Tumor cells from Ctrl and BECN1 B16-F10 tumors were stained with CCR1-, CCR3-, and CCR5-specific antibodies and were subjected to flow cytometric analyses. CD45 cells were gated and defined as tumor cells after which the percentage of CCR1+, CCR3+, and CCR5+ tumor cells were determined. (A) Representative flow cytometry plots of CD45CCR1+; CD45CCR3+, and CD45CCR5+ in Ctrl and BECN1 B16-F10 tumors. Quadrant settings were based on the cells stained with FMO and then applied to the plots of cells stained with positive antibodies. (B) Percentage of CCR1, CCR3, and CCR5 in total CD45 cells from Ctrl and BECN1 B16-F10 tumors. Data shows the significant differences in the percentage of CCR1, CCR3, and CCR5 between tumor cells from Ctrl and BECN1 tumors. Results are the average ± SEM of four mice from each group. *P < 0.05 (two-tailed Student’s t test).
Fig. 6.
Fig. 6.
Schematic representation of the mechanism involved in the overexpression of CCL5 in BECN1 tumor cells. Inhibition of autophagy by targeting BECN1 decreases the catalytic phosphatase activity of PP2A by a mechanism that is not fully understood. The decreased PP2A activity leads to an increased phosphorylation of both JNK (p-JNK) and its downstream c-Jun at Ser-63 and Ser-73 (p-c-Jun Ser-63/-73). The activation of c-Jun by phosphorylation enhances the expression of CCL5 gene. CCL5 released by tumor cells attracts NK cells into the tumor bed leading to the decrease in tumor growth.
Fig. S7.
Fig. S7.
The high phosphorylation level of c-Jun on Ser-63 in BECN1 B16-F10 cells is not affected by silencing CCL5. Control and BECN1 B16-F10 cells displaying a high level of Ser-63 phosphorylated c-Jun were transfected with shRNA targeting CCL5. The expression of Beclin1 and Ser-63 (pS63) c-Jun was assessed by Western blot. Actin was used as a loading control.

References

    1. Orange JS. Natural killer cell deficiency. J Allergy Clin Immunol. 2013;132:515–525, quiz 526. - PMC - PubMed
    1. Waldhauer I, Steinle A. NK cells and cancer immunosurveillance. Oncogene. 2008;27:5932–5943. - PubMed
    1. Guillerey C, Huntington ND, Smyth MJ. Targeting natural killer cells in cancer immunotherapy. Nat Immunol. 2016;17:1025–1036. - PubMed
    1. Bernardini G, Santoni A. The pathophysiological role of chemokines in the regulation of NK cell tissue homing. Crit Rev Oncog. 2014;19:77–90. - PubMed
    1. Maghazachi AA. Role of chemokines in the biology of natural killer cells. Curr Top Microbiol Immunol. 2010;341:37–58. - PubMed

Publication types