. 2017 Oct 31;114(44):E9243-E9252.
doi: 10.1073/pnas.1706083114. Epub 2017 Oct 12.

Control of transcriptional activity by design of charge patterning in the intrinsically disordered RAM region of the Notch receptor

Affiliations

Control of transcriptional activity by design of charge patterning in the intrinsically disordered RAM region of the Notch receptor

Kathryn P Sherry et al. Proc Natl Acad Sci U S A. .

Abstract

Intrinsically disordered regions (IDRs) play important roles in proteins that regulate gene expression. A prominent example is the intracellular domain of the Notch receptor (NICD), which regulates the transcription of Notch-responsive genes. The NICD sequence includes an intrinsically disordered RAM region and a conserved ankyrin (ANK) domain. The 111-residue RAM region mediates bivalent interactions of NICD with the transcription factor CSL. Although the sequence of RAM is poorly conserved, the linear patterning of oppositely charged residues shows minimal variation. The conformational properties of polyampholytic IDRs are governed as much by linear charge patterning as by overall charge content. Here, we used sequence design to assess how changing the charge patterning within RAM affects its conformational properties, the affinity of NICD to CSL, and Notch transcriptional activity. Increased segregation of oppositely charged residues leads to linear decreases in the global dimensions of RAM and decreases the affinity of a construct including a C-terminal ANK domain (RAMANK) for CSL. Increasing charge segregation from WT RAM sharply decreases transcriptional activation for all permutants. Activation also decreases for some, but not all, permutants with low charge segregation, although there is considerable variation. Our results suggest that the RAM linker is more than a passive tether, contributing local and/or long-range sequence features that modulate interactions within NICD and with downstream components of the Notch pathway. We propose that sequence features within IDRs have evolved to ensure an optimal balance of sequence-encoded conformational properties, interaction strengths, and cellular activities.

Keywords: Notch signaling; ankyrin repeats; intrinsically disordered proteins; sequence design; transcriptional activation.


Conflict of interest statement

The authors declare no conflict of interest.

Figures

Fig. 1.
Fig. 1.
Schematic of Notch ternary complex formation and RAM charge permutant sequences. (A) NICD contains the N-terminal intrinsically disordered RAM region, followed by seven ankyrin repeats (ANK) and a transactivation domain (TAD). The RAM region and ANK domain of NICD interact with CSL and the coactivator MAML binds along the ANK:CSL interface. Formation of this ternary complex at promoter regions initiates transcription of Notch target genes. (B) Sequences of RAM charge permutants. Charged residues are highlighted in red and blue. Sequences are labeled with permutant numbers and κ values (left). Permutant labels with asterisks have fixed WT sequence backgrounds (uncharged residues, highlighted in gray).
Fig. 2.
Fig. 2.
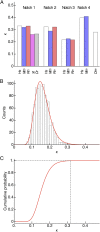
Distribution of κ values among the Notch receptor RAM regions. (A) κ values for RAM regions of the four vertebrate Notch receptor paralogues and for the Drosophila melanogaster (Dm) Notch receptor. For all receptors, κ values fall above 0.2. Dr, Danio rerio; Hs, Homo sapiens; Mm, Mus musculus; Rn, Rattus norvegicus; and Xl, Xenopus laevis. (B) Histogram of 1,000 κ values generated by randomly shuffling the sequence of Hs Notch1. The solid line is a fit to a log-normal distribution. (C) Cumulative log-normal distribution for shuffled Notch1 sequences; based on this distribution, the probability of obtaining a sequence with a κ value as high as that of the Hs Notch1 RAM (0.3173) is 0.003 (dashed lines).
Fig. 3.
Fig. 3.
Impact of charge patterning on the global conformational properties of the Notch RAM polypeptide. (A) Ensemble-averaged Rg from all-atom simulations of the WT and charge permutants of RAM are negatively correlated with κ (see inset Pearson r and p values). (B) RH of charge permutants inferred from analysis of sedimentation velocity AUC experiments. (C) Ratios of Rg values to RH values (from A and B, respectively) are similar to one another for all permutants tested. The three horizontal lines correspond to ratios expected for compact globules (dashed red line), Flory random chains (dashed black line), and excluded volume (EV) chains (dotted red line). (D) Ensemble-averaged asphericity values plotted as a function of κ for the RAM permutants and WT. (E) Two-dimensional histogram P(Rg, asphericity) for the WT RAM sequence. These types of histograms quantify the frequencies of observing specific values of Rg and asphericity. P(Rg, asphericity) values range from 0 (white) to 0.005 (black), with a bin size of 0.7 Å and 0.02 asphericity units. (F) Overlap fraction for each of the permutants calculated by comparing the permutant-specific Rg-asphericity histograms to that of WT RAM. Perfect overlap yields a value of one, whereas completely nonoverlapping distributions yield values of zero. Colors of each permutant in B, E, and F match those in A.
Fig. S1.
Fig. S1.
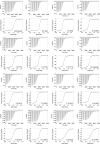
Sedimentation velocity AUC of WT RAM and RAM charge permutants. Sedimentation coefficient distributions (Left) and Δc/Δt curves fitted to a single-species model with SEDANAL (Right) (23). Five fitted Δc/Δt curves out of 61 total are shown for each concentration. Residuals of the fitted curves are shown below. Concentrations are in the range of 12–25 μM (purple), 25–50 μM (red), 50–100 μM (green), and 100–200 μM (blue).
Fig. S2.
Fig. S2.
Analysis of the patterns of average intrachain, interresidue distances within WT RAM and charge permutants. These data averages distances (lower-triangular quadrants) are plotted color-coded as heat maps using the upper color bar in the lower triangular portions. The range of intrachain distances is evident from the change in colors from deep blue (0–10 Å) to ca. 80 Å (deep red). In each panel, differences in average distances from WT (lower-triangular quadrants) are color-coded using the lower color bar. The upper triangular region shows difference distance maps. These were calculated by computing the difference between the distance maps for the permutants and that of the WT. For a given residue pair, if the color is white, then the difference in interresidue distances is zero between the WT and permutant. Red coloring corresponds to increased interresidue distance in the permutant, whereas blue coloring corresponds to decreased interresidue distances in the permutant.
Fig. S3.
Fig. S3.
ITC of RAM peptide, WT RAM, RAMANK, and RAMANK charge permutants binding to CSL. Heat peaks (above) and fitted integrated heat peaks (below) for titrations with CSL. For the peptide and RAM titrations, 85–100 μM peptide and RAM was titrated into 7–10 μM CSL. For RAMANK titrations, 20–40 μM CSL was titrated into 2–4 μM RAMANK samples.
Fig. 4.
Fig. 4.
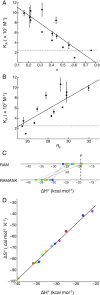
Comparison of RAM charge permutant binding affinities, charge patterning, and global structure. Association constants (KA) for binding of RAMANK charge permutants to CSL versus (A) RAM permutant charge patterning (κ) and (B) RAM permutant ensemble-averaged Rg. Data points are the average of at least three ITC experiments and error bars represent the SD. Solid lines show linear fits to the data with Pearson correlation coefficients of (A) −0.86 and (B) 0.84 and P values of (A) 4.0 × 10⁻⁵ and (B) 8.5 × 10⁻⁵. Dashed lines show the KA of a 27-residue peptide with the RAM binding site sequence for CSL. RAMANK:CSL binding affinities decrease as RAM charge patterning and compaction increases. (C) Binding enthalpies for WT and RAM (upper) and RAMANK constructs (lower) and for permutant RAM and RAMANK constructs. The binding enthalpy of the 27-residue is indicated with a dashed vertical line. WT RAM and RAMANK ΔH° values are connected with a solid diagonal line; permutants 3, 5*, 7*, 8*, and 9 are connected with dashed diagonal lines. (D) Enthalpy–entropy correlation for RAMANK binding to CSL. Solid line is the best fit to the data. In C and D permutant colors are as in Fig. 3A.
Fig. 5.
Fig. 5.
Transcription activities of RAM charge permutant sequences within NICD. WT levels of activation are observed for charge permutants with κ values similar to WT RAM. Significant decreases in activation are observed for high-κ permutants, which is captured by a simple two-state κ-dependent equilibrium between binding-competent and -incompetent forms of RAMANK (Eqs. 13). Modest variations in transcriptional activation are observed for low-κ permutants. Transcription activities are reported relative to WT NICD (flat dashed line) and are the mean of at least three experiments performed in quadruplicate. Error bars are SEs on the mean.
Fig. 6.
Fig. 6.
Proposed mechanisms for the effects of RAM charge patterning and compaction on binary and ternary complex formation. AC show the impact of charge patterning mediated expansion/compaction on the effective concentration (dashed blue circle) of the ANK domain around its binding site on CSL. (A) Well-mixed sequences lead to expanded RAM linkers, reducing the effective concentration of the ANK domain. (B) Moderate charge segregation within the RAM linker leads to chain compaction and can increase the effective concentration of the ANK domain around CSL. (C) High charge segregation within the RAM can lead to overcompaction, decreasing the effective concentration of the ANK domain around CSL. D and E show potential additional interactions involving the RAM linker that can promote or inhibit transcriptional activation. (D) Additional interactions between the RAM linker and CSL (and perhaps MAML) that promote transcriptional activation. These secondary interactions may be disrupted by permutation, which would decrease transcriptional activation. (E) New intramolecular interactions between the RAM linker and the ANK and RAM binding sites, which would disrupt interaction with CSL and decrease transcriptional activation.
Fig. S4.
Fig. S4.
Western blots of NICD charge permutants. To the resolution limit of Western blotting, the blot shows similar protein expression levels of selected charge permutants.

References

    1. van der Lee R, et al. Classification of intrinsically disordered regions and proteins. Chem Rev. 2014;114:6589–6631. - PMC - PubMed
    1. Wright PE, Dyson HJ. Intrinsically disordered proteins in cellular signalling and regulation. Nat Rev Mol Cell Biol. 2015;16:18–29. - PMC - PubMed
    1. Uversky VN. What does it mean to be natively unfolded? Eur J Biochem. 2002;269:2–12. - PubMed
    1. Lyle N, Das RK, Pappu RV. A quantitative measure for protein conformational heterogeneity. J Chem Phys. 2013;139:121907. - PMC - PubMed
    1. Das RK, Ruff KM, Pappu RV. Relating sequence encoded information to form and function of intrinsically disordered proteins. Curr Opin Struct Biol. 2015;32:102–112. - PMC - PubMed

Publication types

MeSH terms