Specific cation effects at aqueous solution-vapor interfaces: Surfactant-like behavior of Li+ revealed by experiments and simulations
- PMID: 29078311
- PMCID: PMC5754762
- DOI: 10.1073/pnas.1707540114
Specific cation effects at aqueous solution-vapor interfaces: Surfactant-like behavior of Li+ revealed by experiments and simulations
Abstract
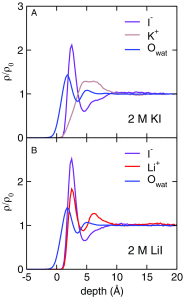
It is now well established by numerous experimental and computational studies that the adsorption propensities of inorganic anions conform to the Hofmeister series. The adsorption propensities of inorganic cations, such as the alkali metal cations, have received relatively little attention. Here we use a combination of liquid-jet X-ray photoelectron experiments and molecular dynamics simulations to investigate the behavior of K+ and Li+ ions near the interfaces of their aqueous solutions with halide ions. Both the experiments and the simulations show that Li+ adsorbs to the aqueous solution-vapor interface, while K+ does not. Thus, we provide experimental validation of the "surfactant-like" behavior of Li+ predicted by previous simulation studies. Furthermore, we use our simulations to trace the difference in the adsorption of K+ and Li+ ions to a difference in the resilience of their hydration shells.
Keywords: Hofmeister series; air−water interface; aqueous ionic solvation; ion adsorption; specific ion effects.
Conflict of interest statement
The authors declare no conflict of interest.
Figures


Similar articles
-
In situ study of the competitive adsorption of ions at an organic-aqueous two-phase interface: the essential role of the Hofmeister effect.Soft Matter. 2019 May 29;15(21):4346-4350. doi: 10.1039/c9sm00007k. Soft Matter. 2019. PMID: 31074480
-
Surface Affinity of Alkali and Halide Ions in Their Aqueous Solution: Insight from Intrinsic Density Analysis.J Phys Chem B. 2020 Nov 5;124(44):9884-9897. doi: 10.1021/acs.jpcb.0c05547. Epub 2020 Oct 21. J Phys Chem B. 2020. PMID: 33084342
-
Spiers Memorial Lecture. Ions at aqueous interfaces.Faraday Discuss. 2009;141:9-30; discussion 81-98. doi: 10.1039/b816684f. Faraday Discuss. 2009. PMID: 19227348
-
Ions at aqueous interfaces: from water surface to hydrated proteins.Annu Rev Phys Chem. 2008;59:343-66. doi: 10.1146/annurev.physchem.59.032607.093749. Annu Rev Phys Chem. 2008. PMID: 18031215 Review.
-
Ions at hydrophobic interfaces.J Phys Condens Matter. 2014 May 21;26(20):203101. doi: 10.1088/0953-8984/26/20/203101. Epub 2014 Apr 25. J Phys Condens Matter. 2014. PMID: 24769502 Review.
Cited by
-
Molecular beam scattering of neon from flat jets of cold salty water.Chem Sci. 2025 May 30;16(25):11608-11618. doi: 10.1039/d5sc01636c. eCollection 2025 Jun 25. Chem Sci. 2025. PMID: 40453793 Free PMC article.
-
Image-charge effects on ion adsorption near aqueous interfaces.Proc Natl Acad Sci U S A. 2021 May 11;118(19):e2020615118. doi: 10.1073/pnas.2020615118. Proc Natl Acad Sci U S A. 2021. PMID: 33947813 Free PMC article.
-
Influence of Surfactants with Differently Charged Headgroups on the Surface Propensity of Bromide.J Phys Chem A. 2025 Apr 3;129(13):3085-3097. doi: 10.1021/acs.jpca.4c07539. Epub 2025 Mar 21. J Phys Chem A. 2025. PMID: 40118072 Free PMC article.
-
Chemical physics of water.Proc Natl Acad Sci U S A. 2017 Dec 19;114(51):13325-13326. doi: 10.1073/pnas.1719350115. Epub 2017 Dec 11. Proc Natl Acad Sci U S A. 2017. PMID: 29229822 Free PMC article. No abstract available.
-
Liquid-jet photoemission spectroscopy as a structural tool: site-specific acid-base chemistry of vitamin C.Phys Chem Chem Phys. 2024 Jul 24;26(29):19673-19684. doi: 10.1039/d4cp01521e. Phys Chem Chem Phys. 2024. PMID: 38963770 Free PMC article.
References
-
- Hofmeister F. Zur lehre von der wirkung der slaze. Arch Exp Pathol Pharmakol (Leipzig) 1888;24:247–260.
-
- Collins KD, Washabaugh MW. The Hofmeister effect and the behaviour of water at interfaces. Q Rev Biophys. 1985;18:323–422. - PubMed
-
- Lo Nostro P, Ninham BW. Hofmeister phenomena: An update on ion specificity in biology. Chem Rev. 2012;112:2286–2322. - PubMed
-
- Marcus Y. Effect of ions on the structure of water: Structure making and breaking. Chem Rev. 2009;109:1346–1370. - PubMed
-
- Omta AW, Kropman MF, Woutersen S, Bakker HJ. Negligible effect of ions on the hydrogen-bond structure in liquid water. Science. 2003;301:347–349. - PubMed
Publication types
LinkOut - more resources
Full Text Sources
Other Literature Sources

