

Increasing potential for intense tropical and subtropical thunderstorms under global warming
- PMID: 29078312
- PMCID: PMC5676896
- DOI: 10.1073/pnas.1707603114
Increasing potential for intense tropical and subtropical thunderstorms under global warming
Erratum in
-
Correction for Singh et al., Increasing potential for intense tropical and subtropical thunderstorms under global warming.Proc Natl Acad Sci U S A. 2018 Jan 9;115(2):E342. doi: 10.1073/pnas.1721679115. Epub 2018 Jan 2. Proc Natl Acad Sci U S A. 2018. PMID: 29295938 Free PMC article. No abstract available.
Abstract
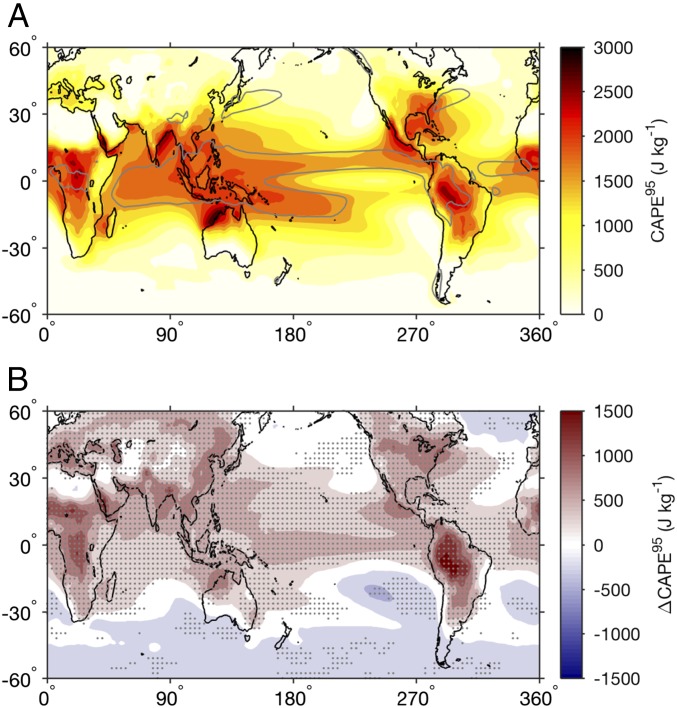
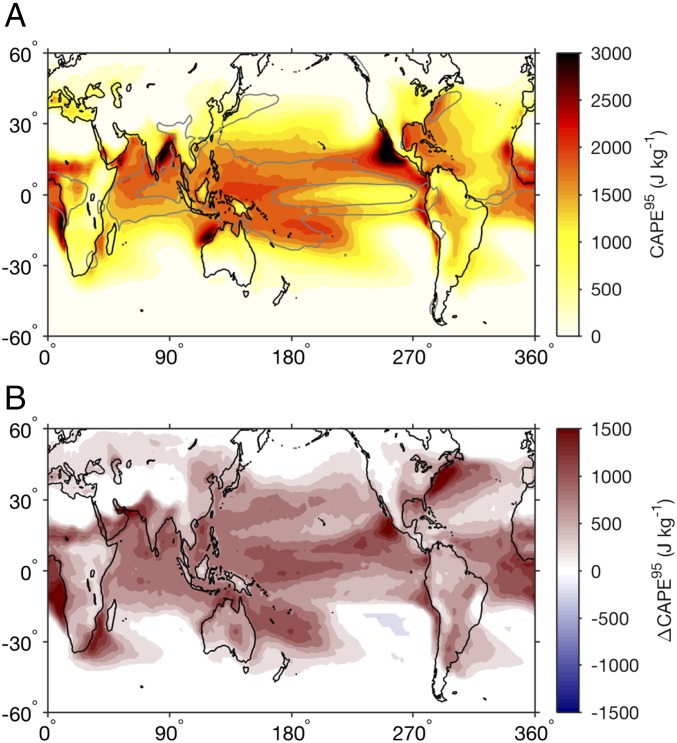
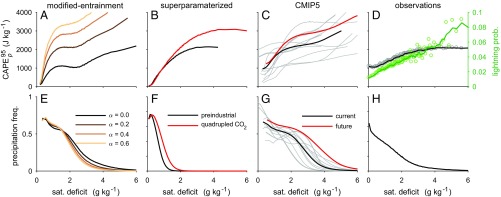
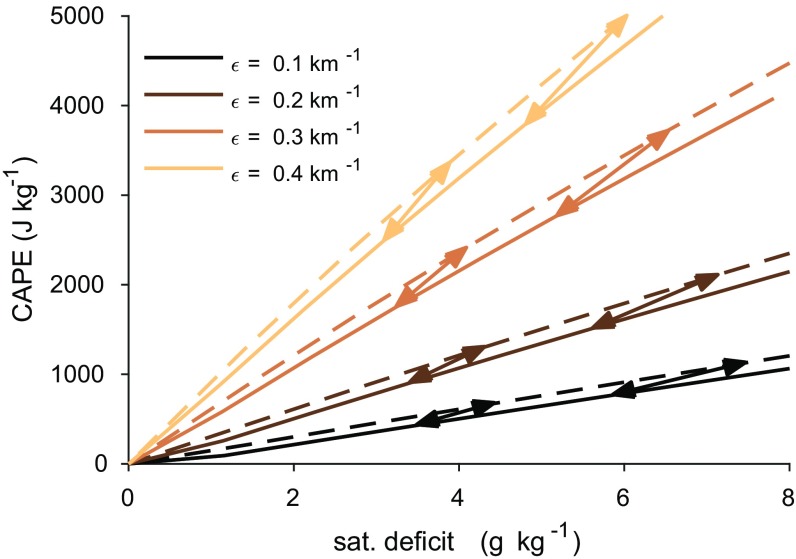
Intense thunderstorms produce rapid cloud updrafts and may be associated with a range of destructive weather events. An important ingredient in measures of the potential for intense thunderstorms is the convective available potential energy (CAPE). Climate models project increases in summertime mean CAPE in the tropics and subtropics in response to global warming, but the physical mechanisms responsible for such increases and the implications for future thunderstorm activity remain uncertain. Here, we show that high percentiles of the CAPE distribution (CAPE extremes) also increase robustly with warming across the tropics and subtropics in an ensemble of state-of-the-art climate models, implying strong increases in the frequency of occurrence of environments conducive to intense thunderstorms in future climate projections. The increase in CAPE extremes is consistent with a recently proposed theoretical model in which CAPE depends on the influence of convective entrainment on the tropospheric lapse rate, and we demonstrate the importance of this influence for simulated CAPE extremes using a climate model in which the convective entrainment rate is varied. We further show that the theoretical model is able to account for the climatological relationship between CAPE and a measure of lower-tropospheric humidity in simulations and in observations. Our results provide a physical basis on which to understand projected future increases in intense thunderstorm potential, and they suggest that an important mechanism that contributes to such increases may be present in Earth's atmosphere.
Keywords: CAPE; climate change; intense thunderstorms; severe weather; tropical atmosphere.
Published under the PNAS license.
Conflict of interest statement
The authors declare no conflict of interest.
Figures
Similar articles
-
Robust increases in severe thunderstorm environments in response to greenhouse forcing.Proc Natl Acad Sci U S A. 2013 Oct 8;110(41):16361-6. doi: 10.1073/pnas.1307758110. Epub 2013 Sep 23. Proc Natl Acad Sci U S A. 2013. PMID: 24062439 Free PMC article.
-
Hazardous thunderstorm intensification over Lake Victoria.Nat Commun. 2016 Sep 23;7:12786. doi: 10.1038/ncomms12786. Nat Commun. 2016. PMID: 27658848 Free PMC article.
-
Atmospheric drivers of post-monsoon and winter thunderstorms in Central India.Sci Total Environ. 2025 Jun 1;979:179432. doi: 10.1016/j.scitotenv.2025.179432. Epub 2025 Apr 24. Sci Total Environ. 2025. PMID: 40280092
-
Precipitation Extremes Under Climate Change.Curr Clim Change Rep. 2015;1(2):49-59. doi: 10.1007/s40641-015-0009-3. Curr Clim Change Rep. 2015. PMID: 26312211 Free PMC article. Review.
-
Thunderstorm-related asthma: what happens and why.Clin Exp Allergy. 2016 Mar;46(3):390-6. doi: 10.1111/cea.12709. Clin Exp Allergy. 2016. PMID: 26765082 Review.
Cited by
-
The association between weather warnings and hip fractures in the Republic of Ireland.Arch Osteoporos. 2023 Apr 21;18(1):53. doi: 10.1007/s11657-023-01243-9. Arch Osteoporos. 2023. PMID: 37084122 Free PMC article.
-
Changing available energy for extratropical cyclones and associated convection in Northern Hemisphere summer.Proc Natl Acad Sci U S A. 2019 Mar 5;116(10):4105-4110. doi: 10.1073/pnas.1812312116. Epub 2019 Feb 19. Proc Natl Acad Sci U S A. 2019. PMID: 30782796 Free PMC article.
-
Health impacts of climate change on smallholder farmers.One Health. 2021 Apr 29;13:100258. doi: 10.1016/j.onehlt.2021.100258. eCollection 2021 Dec. One Health. 2021. PMID: 34027006 Free PMC article. Review.
-
Climate Change, Migration, and Civil Strife.Curr Environ Health Rep. 2020 Dec;7(4):404-414. doi: 10.1007/s40572-020-00291-4. Curr Environ Health Rep. 2020. PMID: 33048318 Free PMC article. Review.
-
Amazon windthrow disturbances are likely to increase with storm frequency under global warming.Nat Commun. 2023 Jan 6;14(1):101. doi: 10.1038/s41467-022-35570-1. Nat Commun. 2023. PMID: 36609508 Free PMC article.
References
-
- Price C, Rind D. The impact of a 2CO2 climate on lightning-caused fires. J Clim. 1994;7:1484–1494.
-
- Mahoney K, Alexander MA, Thompson G, Barsugli JJ, Scott JD. Changes in hail and flood risk in high-resolution simulations over Colorado’s mountains. Nat Clim Change. 2012;2:125–131.
-
- Gao Y, Fu JS, Drake JB, Liu Y, Lamarque JF. Projected changes of extreme weather events in the eastern United States based on a high resolution climate modeling system. Env Res Lett. 2012;7:044025.
-
- Trapp RJ, Hoogewind KA. The realization of extreme tornadic storm events under future anthropogenic climate change. J Clim. 2016;29:5251–5265.
-
- Muller CJ, O’Gorman PA, Back LE. Intensification of precipitation extremes with warming in a cloud-resolving model. J Clim. 2011;24:2784–2800.
Publication types
LinkOut - more resources
Full Text Sources
Other Literature Sources
