. 2017 Oct 31;114(44):E9346-E9355.
doi: 10.1073/pnas.1707965114. Epub 2017 Oct 12.

Identification of a tumor-promoter cholesterol metabolite in human breast cancers acting through the glucocorticoid receptor

Affiliations

Identification of a tumor-promoter cholesterol metabolite in human breast cancers acting through the glucocorticoid receptor

Maud Voisin et al. Proc Natl Acad Sci U S A. .

Abstract

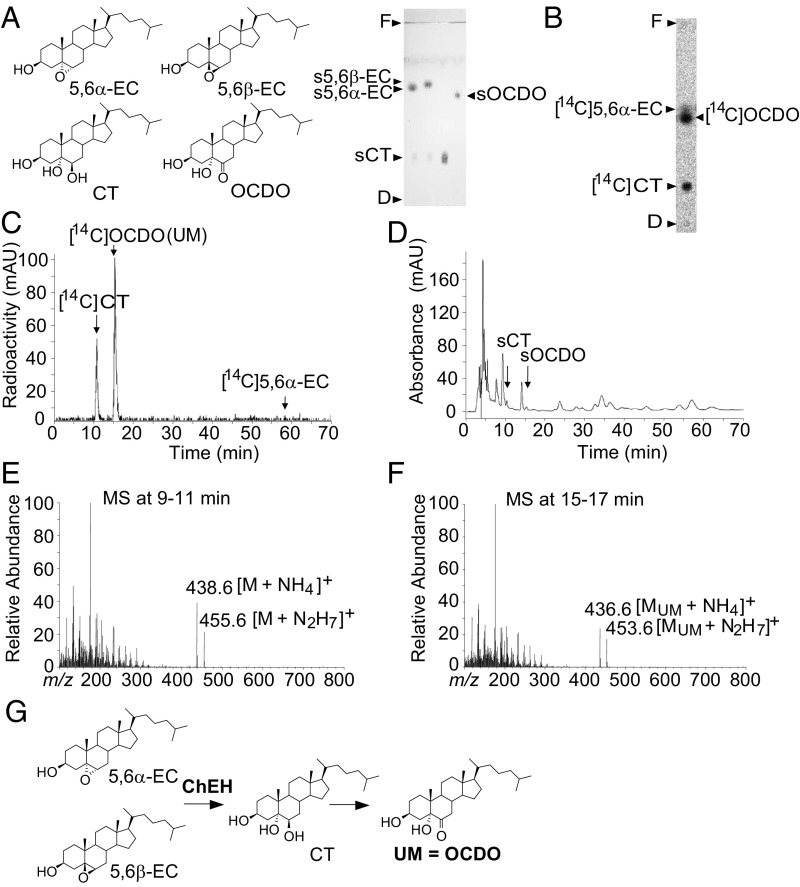
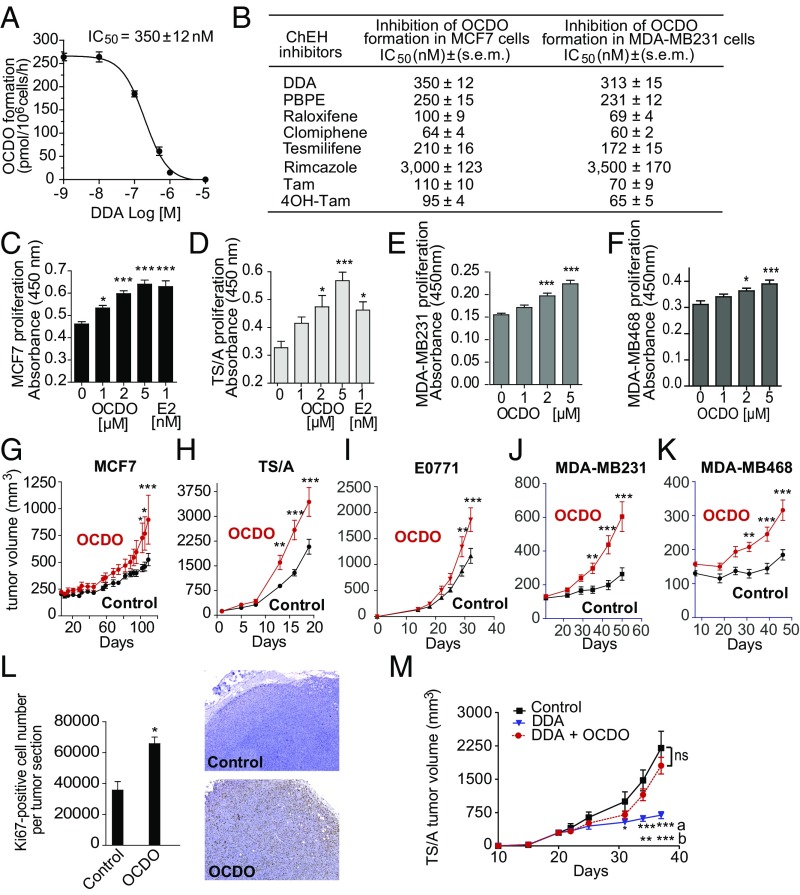
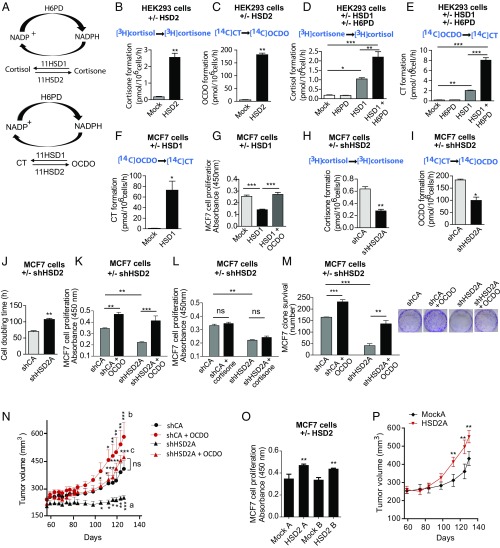
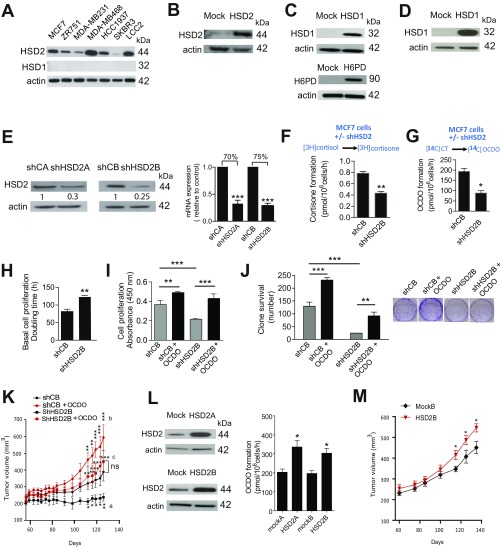
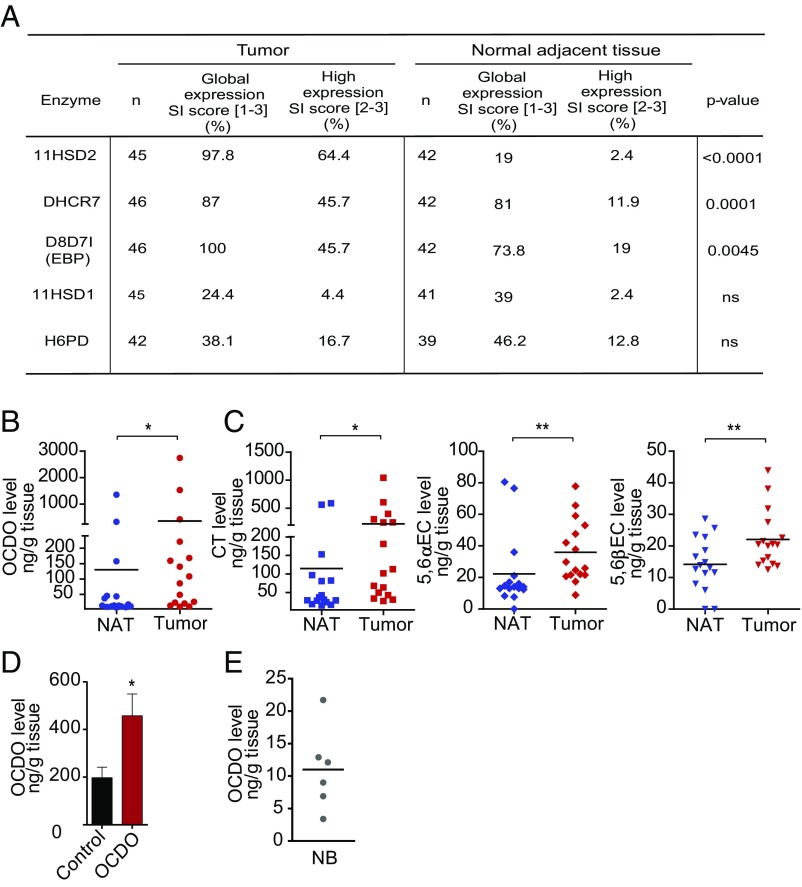
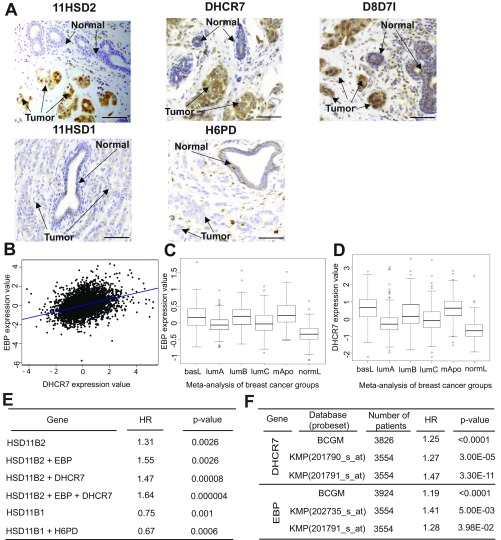
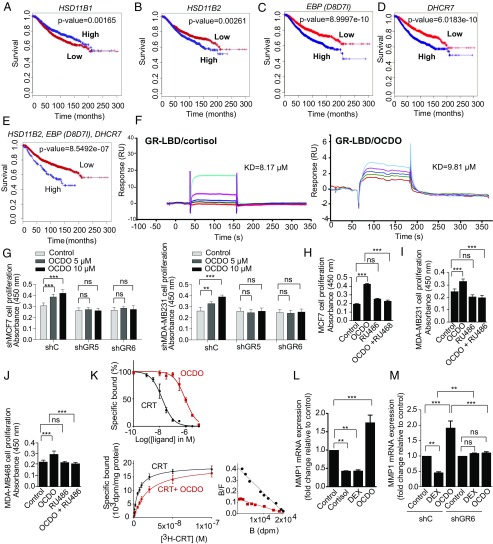
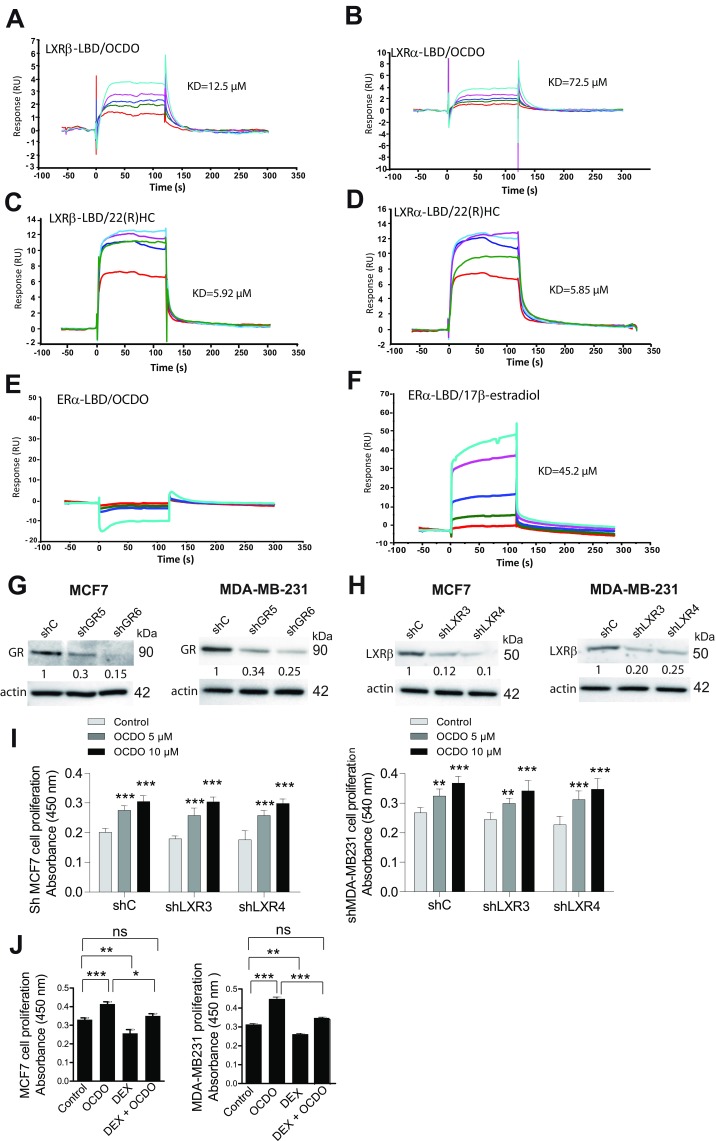
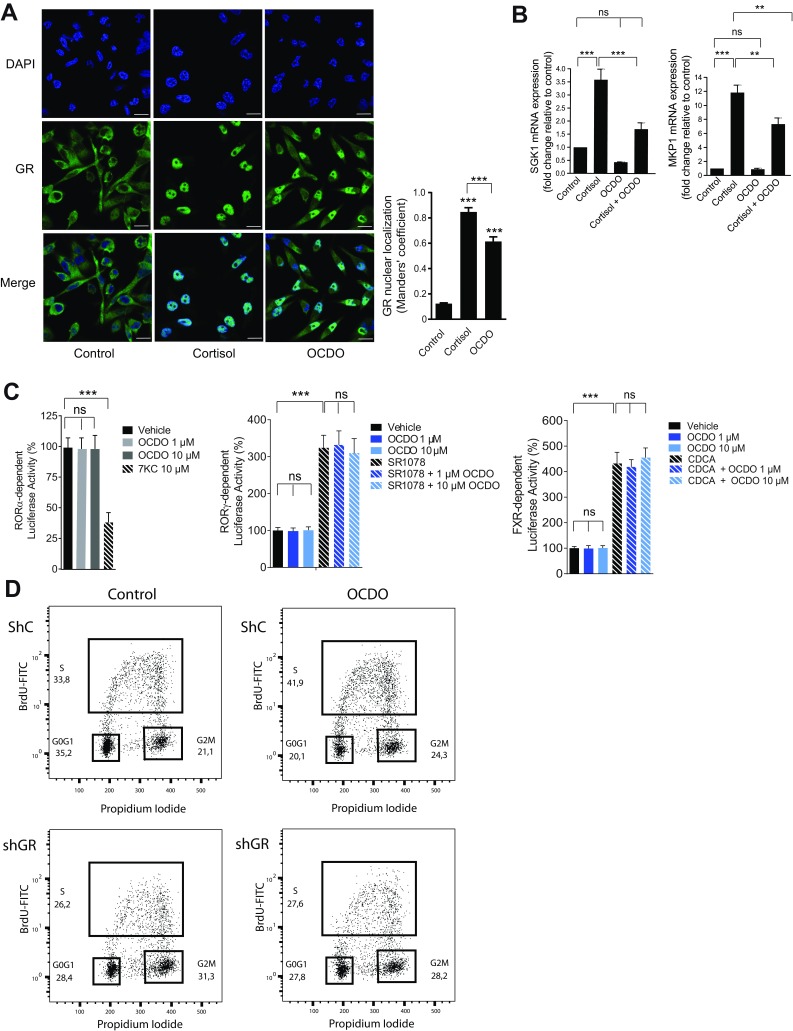
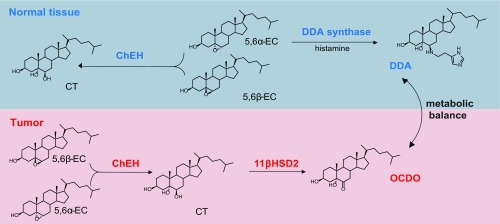
Breast cancer (BC) remains the primary cause of death from cancer among women worldwide. Cholesterol-5,6-epoxide (5,6-EC) metabolism is deregulated in BC but the molecular origin of this is unknown. Here, we have identified an oncometabolism downstream of 5,6-EC that promotes BC progression independently of estrogen receptor α expression. We show that cholesterol epoxide hydrolase (ChEH) metabolizes 5,6-EC into cholestane-3β,5α,6β-triol, which is transformed into the oncometabolite 6-oxo-cholestan-3β,5α-diol (OCDO) by 11β-hydroxysteroid-dehydrogenase-type-2 (11βHSD2). 11βHSD2 is known to regulate glucocorticoid metabolism by converting active cortisol into inactive cortisone. ChEH inhibition and 11βHSD2 silencing inhibited OCDO production and tumor growth. Patient BC samples showed significant increased OCDO levels and greater ChEH and 11βHSD2 protein expression compared with normal tissues. The analysis of several human BC mRNA databases indicated that 11βHSD2 and ChEH overexpression correlated with a higher risk of patient death, highlighting that the biosynthetic pathway producing OCDO is of major importance to BC pathology. OCDO stimulates BC cell growth by binding to the glucocorticoid receptor (GR), the nuclear receptor of endogenous cortisol. Interestingly, high GR expression or activation correlates with poor therapeutic response or prognosis in many solid tumors, including BC. Targeting the enzymes involved in cholesterol epoxide and glucocorticoid metabolism or GR may be novel strategies to prevent and treat BC.

Keywords: breast cancer; dendrogenin A; nuclear receptor; oncometabolism; therapy.


Conflict of interest statement

Conflict of interest statement: P.d.M., E.N., and L.M. are employees of the company Affichem, of which S.S.-P. and M.P. are founders.

Figures

Fig. 1.
Fig. 1.
UM is a metabolite of CT in tumor cells. (AF, Left) Representative TLC autoradiograms (n = 5) showing time-dependent production of UM in MCF7 cells treated with (A and B) 600 nM [14C]5,6α-EC, (C and D) 600 nM [14C]5,6β-EC, and (E and F) 1 µM [14C]-CT. (Right) Quantitative analyses of the metabolites extracted from cells (A, C, and E) and media (B, D, and F). The regions corresponding to the radioactive metabolites of interest (arrows) were recovered and counted using a β-counter. Results are the mean (±SEM) of five independent experiments.
Fig. 2.
Fig. 2.
Structural characterization of UM. (A, Left) Chemical structure of the metabolites of interest. (Right) Representative migration performed by silica gel TLC (n = 5) of the synthetic (s) metabolites of interest, indicated by arrows. (B) MCF7 cells were incubated for 72 h with [14C]5,6α-EC and analyzed as described for Fig. 1 (n = 5). Analysis of cell extracts by (B) polar silica gel TLC or (C) hydrophobic RP-HPLC. (D) RP-HPLC profile of the metabolites extracted from MCF-7 cells that had been treated for 72 h with 5,6α-EC. Arrows indicate peaks corresponding to the authentic standards: sCT and sOCDO. (E) CI-MS spectra of the RP-HPLC peak eluted between 9 and 11 min in D. (F) CI-MS spectra of the RP-HPLC peak eluted between 15 and 17 min in D. (G) Scheme describing the formation of OCDO.
Fig. 3.
Fig. 3.
OCDO is a tumor promoter and its inhibition contributes to the antitumor effects of DDA. (A) Representative inhibition curve showing the inhibition of OCDO formation by increasing concentrations of DDA in human MCF7 cells treated with 600 nM [14C]5,6α-EC for 72 h. OCDO formation was quantified after TLC analysis as described for Fig. 1 and IC50 value was calculated from the concentration-inhibition curve. (B) Analysis of the inhibition of OCDO formation in MCF7 and MDA-MB231 cells treated as in A with increasing concentrations of the indicated ChEH inhibitors. OCDO formation and IC50 values were measured as in A. (CF) Tumor cell proliferation using a colorimetric BrDU immunoassay, n = 8. *P < 0.05, ***P < 0.001, one-way ANOVA, Tukey’s posttest. (AF) Data are the mean (±SEM) of five separate experiments. (GK) Mice (10 per group) implanted with the indicated cell lines were treated with the solvent vehicle or OCDO and monitored for tumor growth over time. (L, Left) Mean (±SEM) of Ki67-positive cells quantified from IHC staining of MCF7 tumor sections from G, n = 8. *P < 0.05, Student’s t test, two-tailed; ***P < 0.001. (Right) Representative Ki67 staining of TS/A tumor sections from H. (M) Mice (10 per group) implanted with TS/A cells were treated every day, starting at day 1, with either the solvent vehicle, DDA (0.37 µg/kg), or DDA (0.37 µg/kg) + OCDO (50 µg/kg). (GK and M) Data are representative of three independent experiments. Mean tumor volumes (±SEM) are shown, two-way ANOVA, Bonferroni posttest, *P < 0.05, **P < 0.01, ***P < 0.001. In M, letters indicate the comparison between: a: DDA vs. control; b: DDA vs. DDA + OCDO. ns: not significant at each time.
Fig. 4.
Fig. 4.
11βHSD2 and 11βHSD1 interconvert OCDO and CT. (A, Upper) 11HSD2 catalyzes the dehydrogenation of cortisol into cortisone. 11HSD1 realizes the reverse reaction. H6PD is the enzyme that produces the cofactor NADPH necessary for the reductase activity of 11HSD1. (A, Lower) 11HSD2 produces OCDO from CT and 11HSD1 produces CT from OCDO. (BM and O) HEK293T (HEK) or MCF7 cells were transfected with plasmids encoding the indicated enzyme or the empty vector (mock) or shRNA. (BF) The production of the indicated metabolites in transfected HEK (BE) or MCF7 cells (F) was analyzed as in Fig. 1, n = 5. (G) The proliferation of transfected MCF7 cells was analyzed as in Fig. 3 CF, n = 8. (HM) shCA- and shHSD2A-MCF7 cells were assayed for: (H) cortisone or (I) OCDO production, as measured in Fig. 1, n = 5; (JL) cell proliferation by (J) counting cell numbers, n = 5, or (KL) as in G, n = 8; or (M) cell clonogenicity (n = 3), with or without 5 µM OCDO or cortisone. (N) shCA or shHSD2A-MCF7 tumors engrafted into mice (10 per group) were treated with solvent vehicle (control) or OCDO (16 µg/kg, 5 d/wk). Data are representative of three independent experiments. (O) Control (mock) or HSD2 overexpressing MCF7 cell proliferation was analyzed as in G. (P) The growth of control (mock) or 11HSD2 overexpressing MCF7 tumors engrafted into mice (10 mice per group) were compared over time. Data are representative of three independent experiments. (BM and O) Data are the mean (±SEM) of five separate experiments and were analyzed (B, C, F, and HJ) by a Student’s t test, two-tailed, or (D, E, G, and KO) by one-way ANOVA, Tukey’s posttest. *P < 0.05, **P < 0.01, ***P < 0.001. (N and P) Mean tumor volumes (±SEM) are shown, and data were analyzed by two-way ANOVA, Bonferroni posttest. *P < 0.05, **P < 0.01, ***P < 0.001. In N, letters indicate the comparison between: a: shCA vs. shHSD2A; b: shCA vs. shCA + OCDO; c: shHSD2A vs. shHSD2A + OCDO.
Fig. S1.
Fig. S1.
Measuring the expression or extinction of the proteins of interest and their activity. (A) The expression of endogenous HSD2 and HSD1 was analyzed by immunoblotting in the indicated mammary tumor cells (related to Table S1). (B) HEK293T cells were transfected with a plasmid encoding HSD2 or the empty vector (mock) and the expression of the enzyme was confirmed by immunoblotting. (C) HEK293 cells were transfected with a plasmid encoding HSD1, H6PD, or the empty vector and the expression of the enzyme was confirmed by immunoblotting. (D) MCF7 cells were transfected with a plasmid encoding 11HSD1 and the expression of the enzyme was confirmed as in C. (E) MCF7 cells were transfected with two different shRNA plasmids targeting HSD2 (shHSD2), or with a control shRNA (shC) (SureSilencing ShRNA plasmid; Qiagen). The decreased expression of the enzyme was confirmed by immunoblotting and by qRT-PCR. Two clones (shHSD2A and shHSD2B) were selected. (FJ) shCB-MCF7 and shHSD2B-MCF7 cells were assayed for (F and G) cortisone or OCDO production, respectively, as described in Fig. 4 B and C; cell proliferation (H and I) by counting cell numbers (n = 5) or using a colorimetric BrDu assay, respectively (n = 8), or (J) cell clonogenicity (n = 3); with or without 5 µM OCDO, as indicated. Data were analyzed as described in Fig. 4 HK and M and are the mean (±SEM) of five separate experiments. (K) The growth of shCB or shHSD2B-MCF7 tumors engrafted into mice (10 per group) were compared. OCDO treatment (16 µg/kg, 5 d/wk) increased shCB-MCF7 and reversed the growth inhibition of shHSD2-MCF7 tumors. Data are representative of three independent experiments. (L and M) MCF7 cells were transfected with a plasmid encoding 11HSD2 or the empty vector (mock). (L) Two stable clones were selected for the overexpression of 11HSD2 (HSD2A and HSD2B) and were compared with control cells (mockA and mockB) by immunoblotting. Mock-MCF7 or HSD2-MCF7 cells were incubated with [14C]CT and the production of OCDO was analyzed as in Fig. 1. Data are the mean (±SEM) of three experiments. (M) The growth of Mock-MCF7 or HSD2-MCF7 tumors engrafted into mice (10 per group) were compared. Mean tumor volumes (±SEM) are shown. Data are representative of three independent experiments. (E and H) Data were analyzed by a Student’s t test, two-tailed, or (I and J) by one-way ANOVA, Tukey’s posttest. *P < 0.05, **P < 0.01, ***P < 0.001. (K and M) Mean tumor volumes (±SEM) are shown, and data were analyzed by two-way ANOVA, Bonferroni posttest. *P < 0.05, **P < 0.01, ***P < 0.001. In K, letters indicate the comparison between: a: shCB vs. shHSD2B; b: shCB vs. shCB + OCDO; c: shHSD2B vs. shHSD2B + OCDO. ns, not significant.
Fig. 5.
Fig. 5.
Expression levels of the enzymes regulating OCDO production and dosage of their metabolites in patient samples. (A) IHC analyses using specific antibodies against the enzymes of interest (Table S5). SI, Staining intensity score. Enzyme expression in BC and NAT was analyzed using the McNemar test for paired samples. (B and C) The indicated endogenous metabolites levels were quantified by GC/MS in matched patient tumors and NAT (n = 16). *P < 0.05, **P < 0.01, Wilcoxon test for paired samples, two-tailed. (D) OCDO level was quantified by GC/MS in TS/A tumors implanted into mice treated with 50 µg/kg OCDO for 19 d or treated with solvent vehicle (control) (n = 10 mice per group). Mean OCDO levels (±SEM), n = 10, are shown, *P < 0.05, Mann–Whitney test, two-tailed. Data are representative of three independent experiments. (E) Endogenous OCDO level was quantified by GC/MS in normal breast (NB) samples (n = 6). (B, C, and E) Each point represents the mean level of the metabolite of interest analyzed twice.
Fig. S2.
Fig. S2.
Expression of the enzymes regulating OCDO production and patient survival (related to Fig. 5A and Table S3). (A) Representative immunostaining images illustrating the expression of the indicated enzymes (in brown) in tumor breast samples. (Scale bars, 50 µm.) (B) Pearson’s pairwise correlation plot for EBP (D8D7I) vs. DHCR7 expression in 5,164 samples using the Breast Cancer Gene-Expression Miner v3 targeted correlation analysis module. Box-plots show the expression of (C) EBP (D8D7I) and (D) DHCR7 genes according to tumor molecular subtypes. This analysis was performed by the Carte d’Identité des Tumeurs from the Ligue contre le Cancer on a cohort of 726 tumors (dataset E-MTAB-365) organized in six subtypes (13). ANOVA tests were performed to calculate P values. DHCR7 and EBP levels were significantly different in the subtypes (P = 4.17e-48 and P = 1.02e-53, respectively). Tukey’s post hoc tests performed after one-way ANOVA (function Tukey’s HSD, stats R package) confirmed that the DHCR7 and EBP mean expression in basL, lumB, and mApo subtypes was significantly different from in normL and lumA subtypes (Table S4). (E) The BreastMark mining tool was used to calculate HR and P values, taking into account patient overall survival and median cut-off values for the genes indicated in the first column. (F) Correlation of DHCR7 and EBP (D8D7I) gene expression with survival using the Breast Cancer Gene-Expression Miner v3 targeted prognosis analysis module BCGM (breast cancer gene-expression miner) or the Kaplan–Meier Plotter online software (KMP). The probeset numbers are indicated, together with hazard ratios and logrank P values.
Fig. 6.
Fig. 6.
Expression of the enzymes regulating OCDO production and patient survival, and evidence that OCDO binds and stimulates cell proliferation through the GR and regulates GR transcriptional activity. (AD) Kaplan–Meier representation of patient overall survival according to the indicated enzyme expression (median cut-off) using the BreastMark mining tool on 21 individual datasets (4,738 samples). Survival curves are based on Kaplan–Meier estimates and log-rank P values were calculated for differences in survival. Cox regression analysis was used to calculate HRs. (E) Kaplan–Meier representation of patient overall survival taking into account the expression of the HSD11B2, EBP (D8D7I), and DHCR7 genes using the BreastMark mining tool. (F) Representative SPR sensorgrams from three experiments showing the binding of a series of concentrations of cortisol or OCDO (µM) to the GR-LBD captured on a Biacore sensor chip: 6.25 (red); 12.5 (green); 25 (dark blue); 50 (pink); 100 (light blue). (GJ) Proliferation of the indicated tumor cells was analyzed as in Fig. 3C, n = 8. (HJ) The indicated tumor cells was treated with either the solvent vehicle (control), 5 µM OCDO, 1 µM RU486, or 5 µM OCDO plus 1 µM RU486. Data are the means (±SEM) of five separate experiments, n = 8, **P < 0.01, ***P < 0.001, one-way ANOVA, Tukey’s posttest. (K, Upper) Cell cytosols were incubated with 10 nM [3H]-CRT and increasing concentrations of unlabeled CRT or OCDO for competition binding assays. (K, Lower) Saturation and scatchard plots analyses were performed with cell cytosols incubated with increasing concentration of [3H]-CRT in the absence or in the presence of 1 µM unlabeled CRT (nonspecific binding) or 1 µM OCDO for competitivity studies. Data are the mean (±SEM) of triplicate and are representative of three experiments. (L and M) qRT-PCR analysis of MMP1 gene expression in MDA-MB231 (L) or shC and shGR MDA-MB231 (M) cells treated either with the solvent vehicle (control), 0.5 µM cortisol, 0.1 µM DEX or 5 µM OCDO. (L and M) Data are the means ± SEM of three experiments performed in triplicate, **P < 0.01, ***P < 0.001, one-way ANOVA, Tukey’s posttest. ns, not significant.
Fig. S3.
Fig. S3.
Binding of the indicated ligands to ERα and LXRs, extinction of GR and LXRβ expression in the indicated BC cells and evidence that OCDO does not stimulate cell proliferation through the LXRβ. (AF) Representative SPR sensorgrams from three experiments showing the binding of a series of concentrations of OCDO, 22(R)HC, or 17β-estradiol to the indicated receptor-LBD, captured on a Biacore sensor chip. Concentrations: 6.25 µM (red), 12.5 µM (green), 25 µM (dark blue), 50 µM (pink), 100 µM (light blue). Each sensorgram (expressed in RUs as a function of time in seconds) represents a differential response where the response on an empty reference channel (Fc1) was subtracted. The affinity constant (KD) is determined at equilibrium by the BIAevaluation software. (G and H) GR expression (G) or LXRβ expression (H) in MCF7 or MDA-MB-231 cells was knocked down using either shRNA against the GR (clones shGR5 and shGR6), or the LXRβ (clones shLXR3 and LXR4), or control shRNA (shC) and the expression of receptors was analyzed by immunoblotting. The blots are representative of three experiments. (I) Effect of solvent vehicle (control) or OCDO (5 or 10 µM) on the proliferation of the indicated tumor cells using a colorimetric BrDU immunoassay. (J) Effects of solvent vehicle (control) or OCDO (5 µM) or DEX 0.1 µM, or OCDO (5 µM) + DEX 0.1 µM on the proliferation of the indicated tumor cells using a colorimetric BrDU immunoassay. (I and J) Data are the means (±SEM) of five separate experiments, (n = 8), **P < 0.01, ***P < 0.001, one-way ANOVA, Tukey’s posttest. ns, not significant.
Fig. S4.
Fig. S4.
OCDO causes GR nuclear localization, regulates GR transcriptional activity and induces cell cycle progression. (A) Representative immunofluorescence image of three different experiments of GR nuclear localization. MDA-MB231 cells were cultured in complete medium with dextran-coated charcoal-stripped FBS for 24 h and then treated for 24 h with either the solvent vehicle (control), 0.5 µM cortisol, or 5 µM OCDO and analyzed by indirect immunofluorescence with a confocal microscope (LSM 780; Zeiss) confocal microscope, 63×, using anti-GR (1:100) primary rabbit monoclonal antibody and a secondary rabbit Alexa fluor-488 secondary goat polyclonal antibody. The nuclei were stained with DAPI. Cells (100 per slide) were analyzed for nuclear GR localization using Jacop plugin in ImageJ v1.51. (Scale bars, 10 µm.) The experiments were performed in triplicate. (B) qRT-PCR analysis of SGK1 and MKP1 mRNA expression in MDA-MB231 tumor cells treated either with solvent vehicle (control), 0.5 µM cortisol, 5 µM OCDO, or 0.5 µM cortisol + 5 µM OCDO for 24 h. Data are the means ± SEM of three experiments performed in triplicate, **P < 0.01, ***P < 0.001, one-way ANOVA, Tukey’s posttest. (C) Effect of OCDO on the transcriptional modulatory activity of RORα, RORγ, and FXR. (Left) HEK293T cells were cotransfected with pSG5-RORα and a RORE-Luc plasmid and treated with or without 10 µM 7-ketocholestrol (7KC) or 1 or 10 µM OCDO for 24 h. (Center) Cells were transfected with pCMV-RORγ and a RORE-Luc plasmid and treated with the solvent-vehicle, 1 or 10 µM OCDO with or without 10 µM SR1078 for 24 h. (Right) Cells were transfected with pSG5-FXR, pSG5-RXR, and the tk-EcRE-Luc plasmid and incubated with either the solvent-vehicle, 1 or 10 µM OCDO with or without 10 µM chenodeoxycholic acid (CDCA). Luciferase activity was measured and normalized per microgram of proteins then expressed as percent activity relative to vehicle-treated cells and represented the mean of three independent experiments performed in triplicate (±SEM), ***P < 0.001, one-way ANOVA, Tukey’s posttest. ns, not significant. (D) Representative cell cycle analysis by flow cytometry of three independent experiments. ShC and shGR6 MDA-MB231 cells cultured for 48 h in serum-free medium were treated with the solvent vehicle (control) or 5 µM OCDO for 7 h. Cells were stained with BrdU and propidium iodide. The percentages of cells within the G0/G1, S, and G2/M phases of the cycle were calculated using FlowJo software. Numbers in the panels indicate the percentages of cells within G0/G1, S, and G2/M phases of the cell cycle.
Fig. S5.
Fig. S5.
Scheme of the metabolic balance between OCDO and DDA.

References

    1. Poirot M, Silvente-Poirot S. Cholesterol-5,6-epoxides: Chemistry, biochemistry, metabolic fate and cancer. Biochimie. 2013;95:622–631. - PubMed
    1. Segala G, et al. 5,6-Epoxy-cholesterols contribute to the anticancer pharmacology of tamoxifen in breast cancer cells. Biochem Pharmacol. 2013;86:175–189. - PubMed
    1. de Medina P, et al. Dendrogenin A arises from cholesterol and histamine metabolism and shows cell differentiation and anti-tumour properties. Nat Commun. 2013;4:1840. - PMC - PubMed
    1. Silvente-Poirot S, Poirot M. Cancer. Cholesterol and cancer, in the balance. Science. 2014;343:1445–1446. - PubMed
    1. de Medina P, Paillasse MR, Segala G, Poirot M, Silvente-Poirot S. Identification and pharmacological characterization of cholesterol-5,6-epoxide hydrolase as a target for tamoxifen and AEBS ligands. Proc Natl Acad Sci USA. 2010;107:13520–13525. - PMC - PubMed

Publication types