. 2017 Oct 31;114(44):E9308-E9317.
doi: 10.1073/pnas.1713625114. Epub 2017 Oct 12.

WD40-repeat 47, a microtubule-associated protein, is essential for brain development and autophagy

Collaborators, Affiliations

WD40-repeat 47, a microtubule-associated protein, is essential for brain development and autophagy

Meghna Kannan et al. Proc Natl Acad Sci U S A. .

Abstract

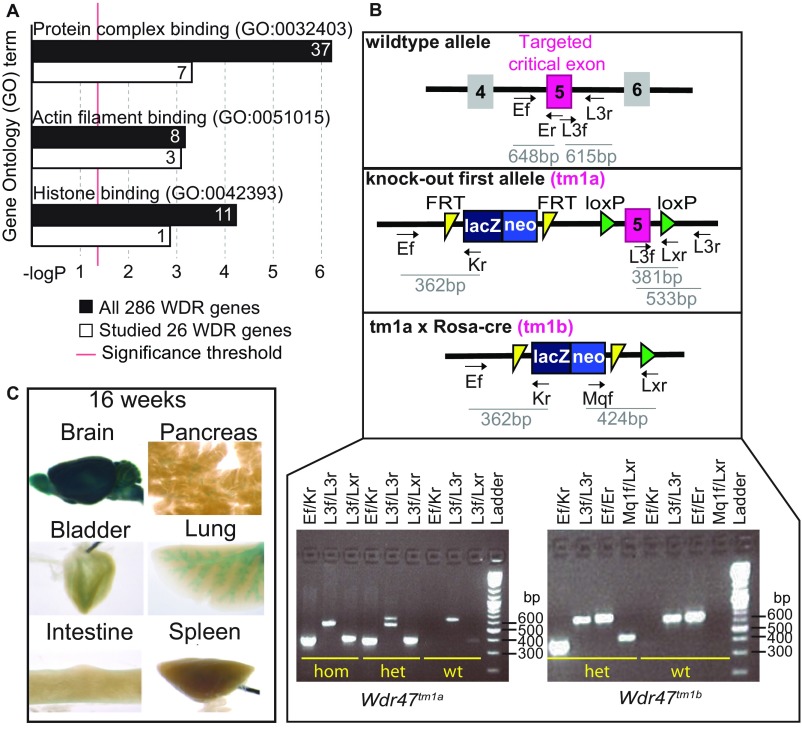
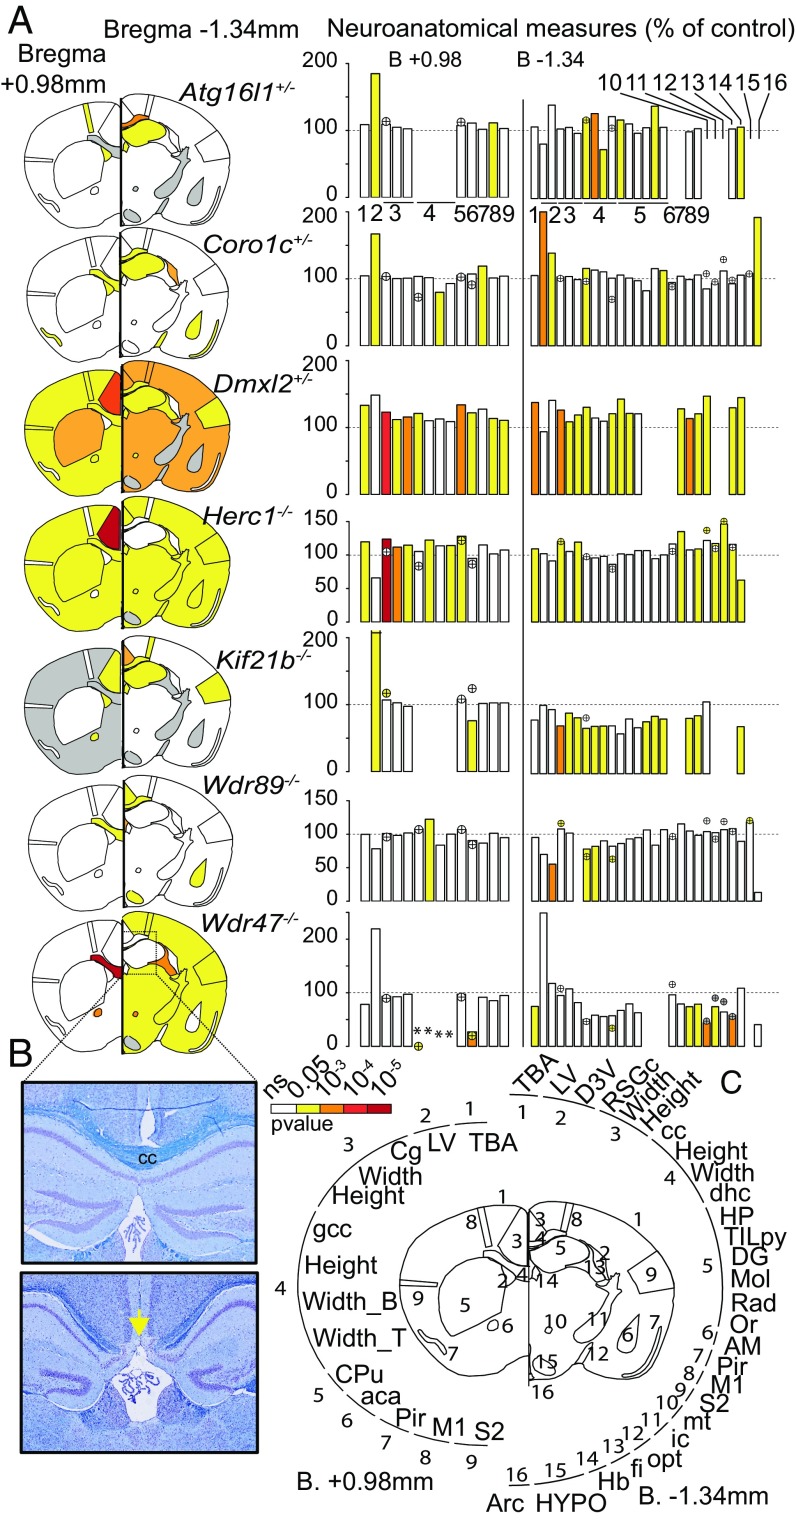
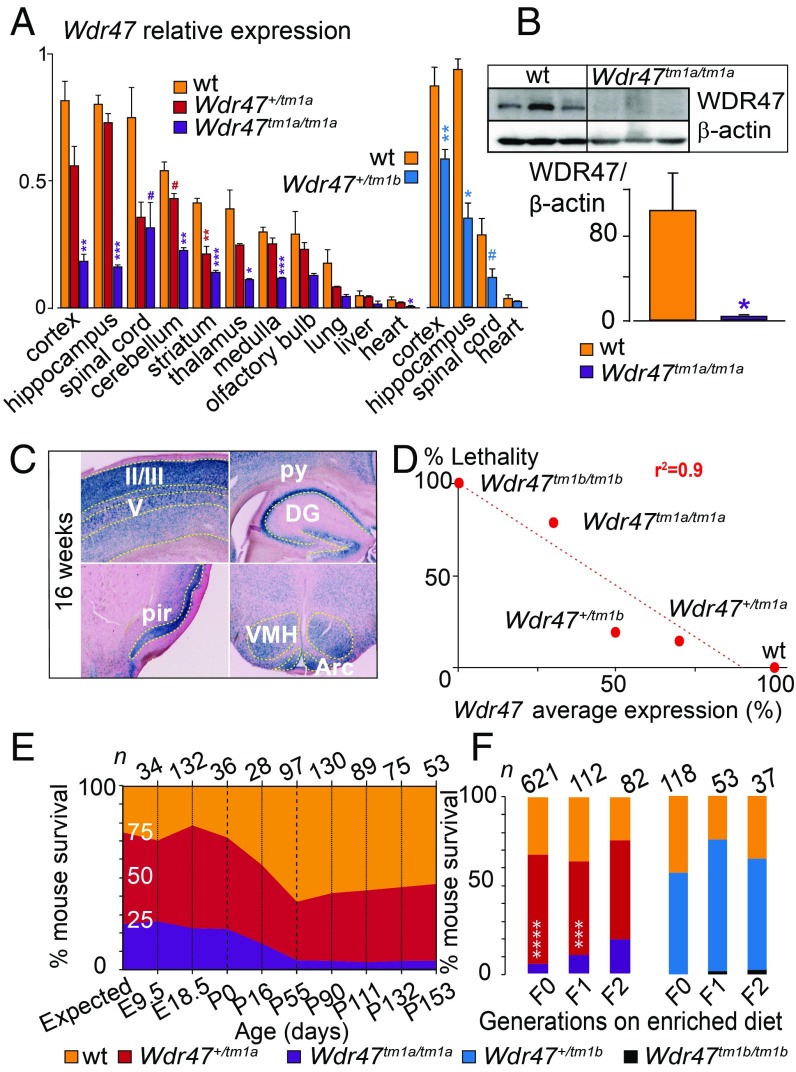
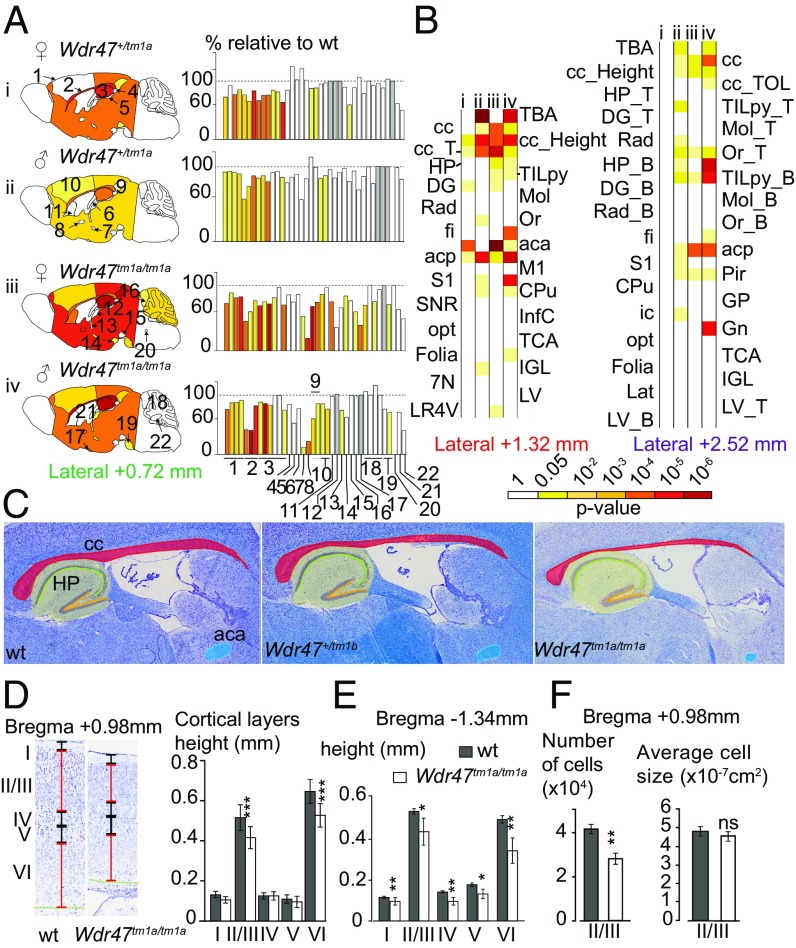
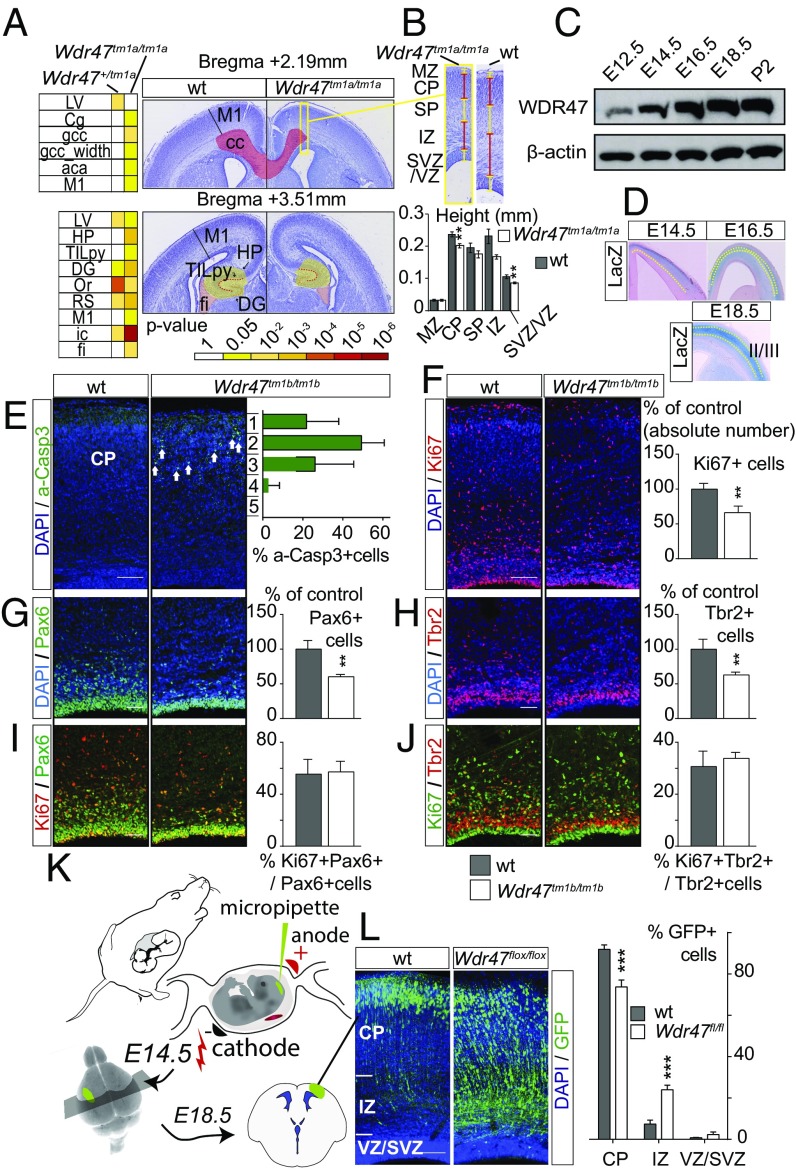
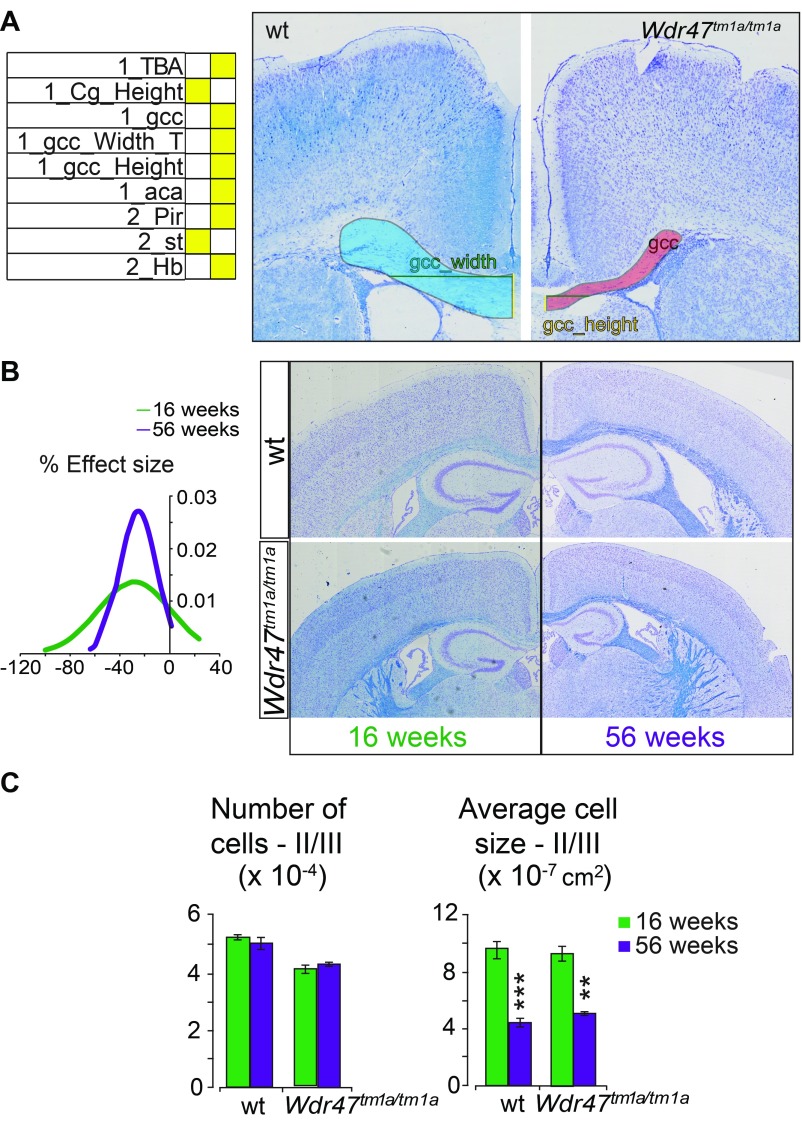
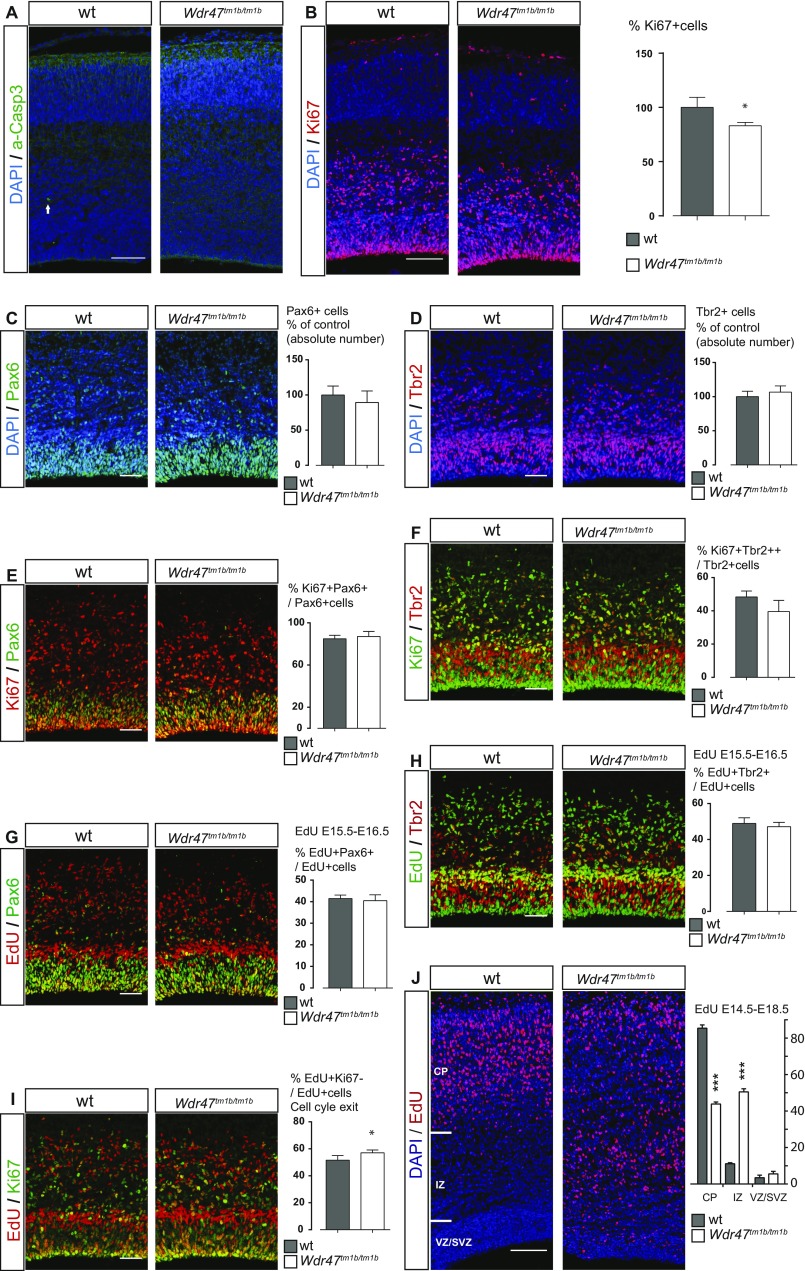
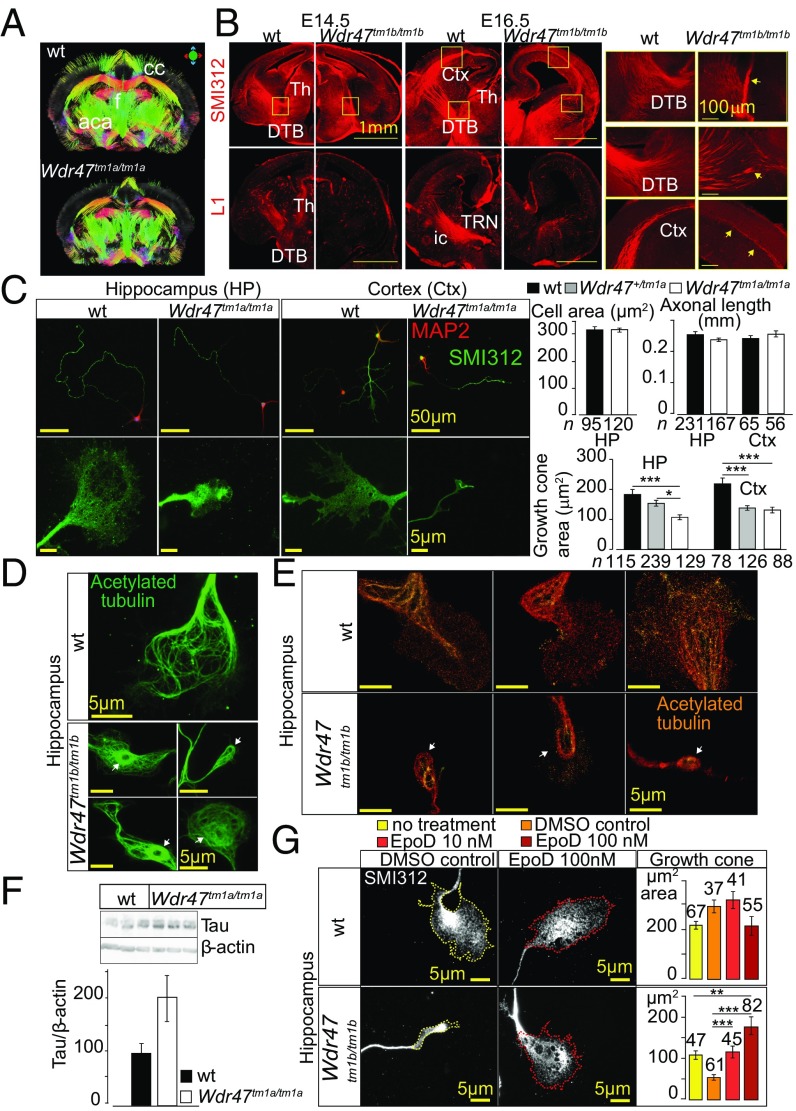
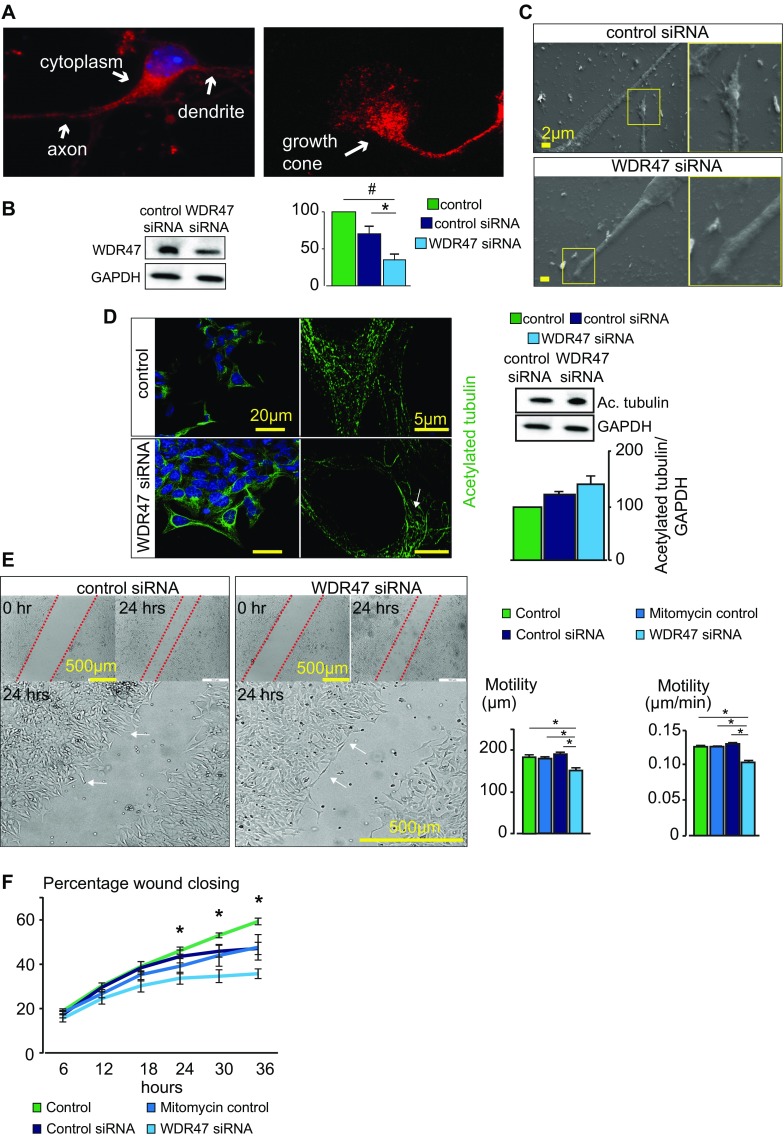
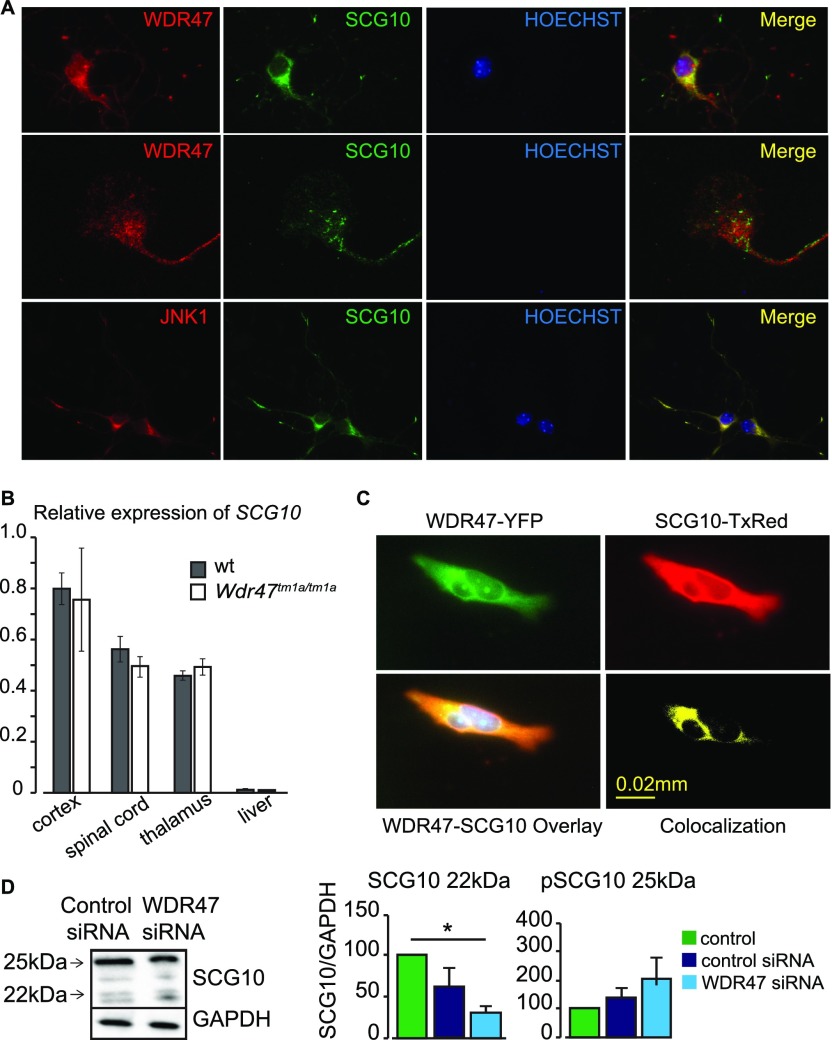
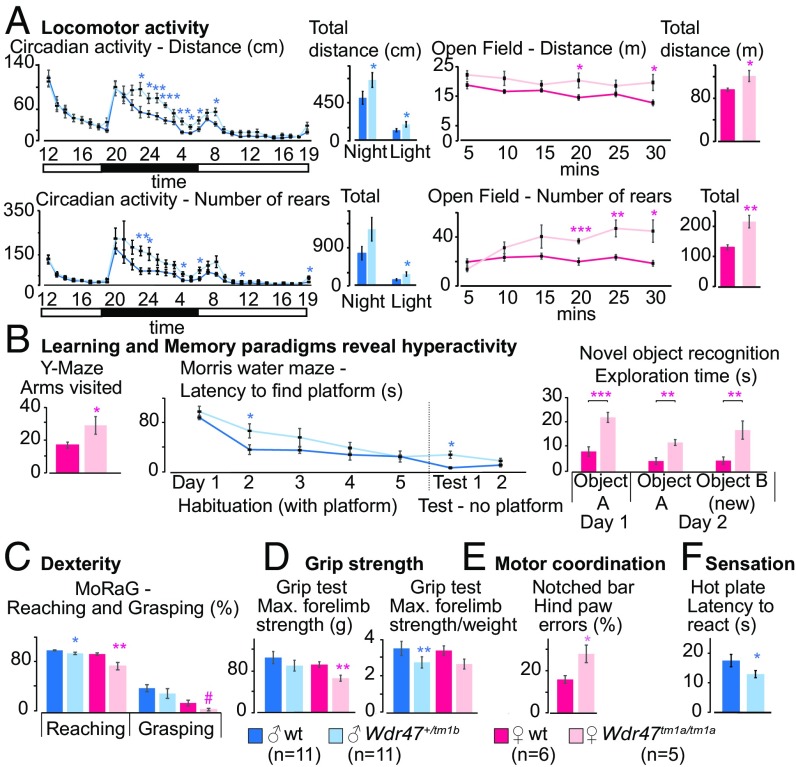
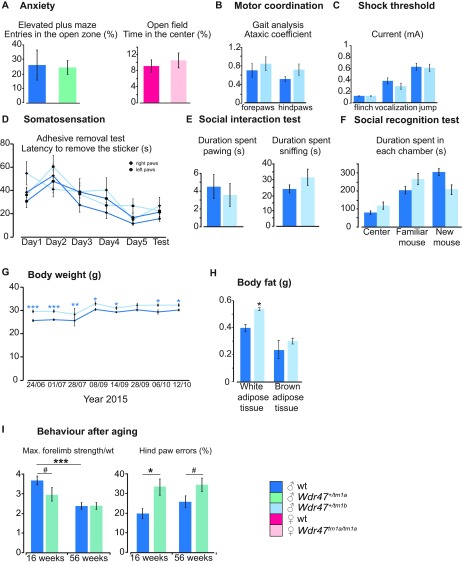
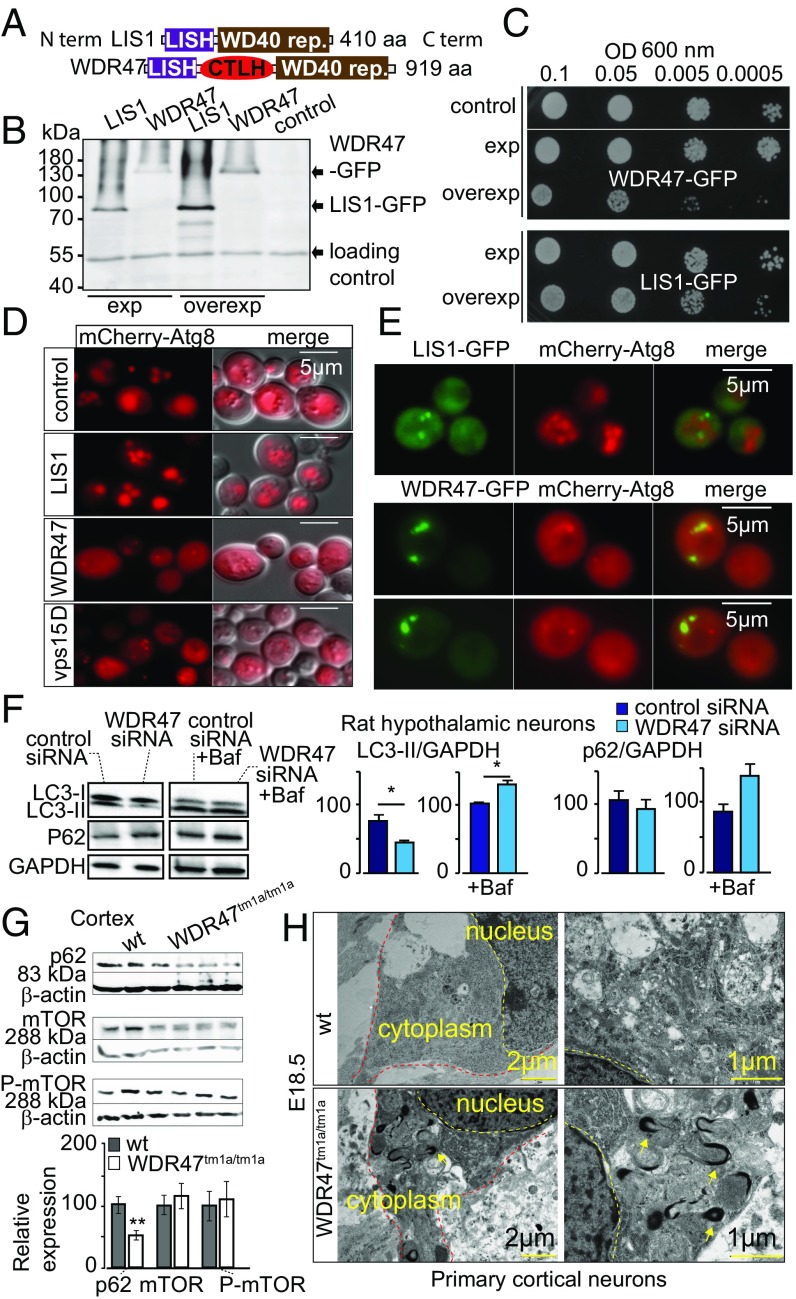
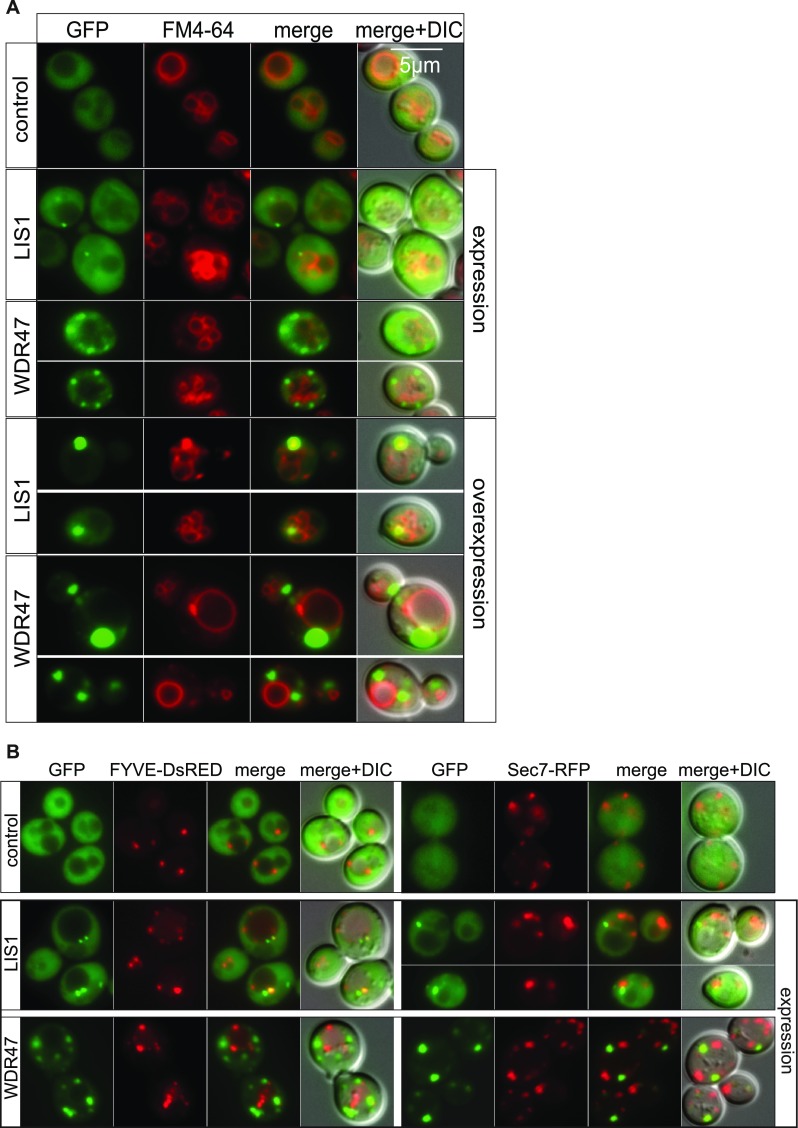
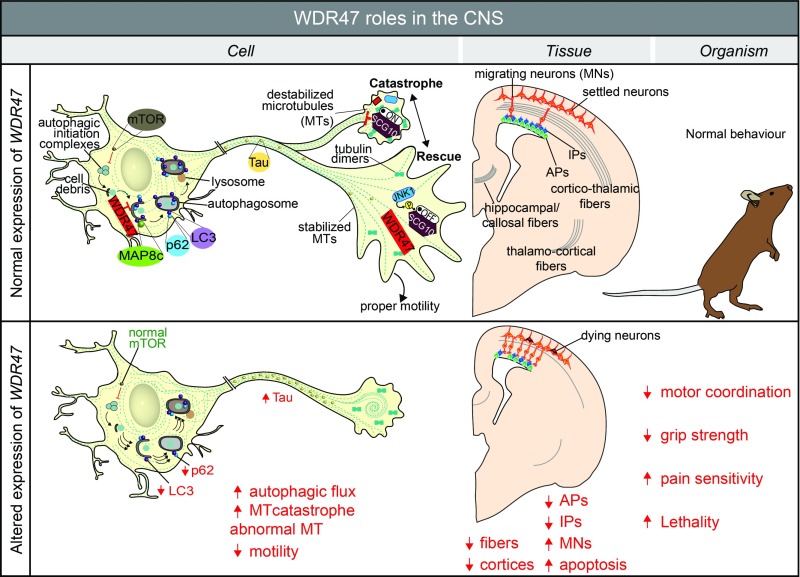
The family of WD40-repeat (WDR) proteins is one of the largest in eukaryotes, but little is known about their function in brain development. Among 26 WDR genes assessed, we found 7 displaying a major impact in neuronal morphology when inactivated in mice. Remarkably, all seven genes showed corpus callosum defects, including thicker (Atg16l1, Coro1c, Dmxl2, and Herc1), thinner (Kif21b and Wdr89), or absent corpus callosum (Wdr47), revealing a common role for WDR genes in brain connectivity. We focused on the poorly studied WDR47 protein sharing structural homology with LIS1, which causes lissencephaly. In a dosage-dependent manner, mice lacking Wdr47 showed lethality, extensive fiber defects, microcephaly, thinner cortices, and sensory motor gating abnormalities. We showed that WDR47 shares functional characteristics with LIS1 and participates in key microtubule-mediated processes, including neural stem cell proliferation, radial migration, and growth cone dynamics. In absence of WDR47, the exhaustion of late cortical progenitors and the consequent decrease of neurogenesis together with the impaired survival of late-born neurons are likely yielding to the worsening of the microcephaly phenotype postnatally. Interestingly, the WDR47-specific C-terminal to LisH (CTLH) domain was associated with functions in autophagy described in mammals. Silencing WDR47 in hypothalamic GT1-7 neuronal cells and yeast models independently recapitulated these findings, showing conserved mechanisms. Finally, our data identified superior cervical ganglion-10 (SCG10) as an interacting partner of WDR47. Taken together, these results provide a starting point for studying the implications of WDR proteins in neuronal regulation of microtubules and autophagy.

Keywords: WD40-repeat proteins; autophagy; corpus callosum agenesis; microcephaly; neurogenesis.


Conflict of interest statement

The authors declare no conflict of interest.

Figures

Fig. S1.
Fig. S1.
Gene ontology (GO) term analysis, Wdr47 genotyping strategy, and LacZ profiling. (A) Gene enrichment analysis of molecular function for 286 hand-curated WDR murine genes vs. 26 WDR genes analyzed in this study. x Axis shows the negative logarithm (with base 10) of the P value, and y axis represents the GO term. (B) Allelic construction of KO mouse models and genotyping strategy; tm1a refers to the KO-first allele, and tm1a crossed with ROSA Cre deleter produces tm1b (complete KO). The illustration locates the seven primers designed to specifically target each component of the construction. Expected amplicon size is shown below each primer pair. A PCR example of the primer combinations used to genotypes Wdr47tm1a and Wdr47tm1b mice is shown in Lower Right. (C) Adult mice LacZ expression patterns across a selection of six tissues (brain, pancreas, bladder, lung, intestine, and spleen) accessible through the International Mouse Phenotyping Consortium (www.mousephenotype.org/data/genes/MGI:2139593) website.
Fig. 1.
Fig. 1.
Relevance of mouse WDR genes in adult brain morphogenesis. (A) Brain features plotted in two coronal planes according to P values for seven WDR genes (n = 3 per group). White indicates P > 0.05, and gray indicates no data. Histograms of percentage changes relative to WT animals (100%) are colored according to the significance level. Circles with crosses indicate cell count measurements. Statistical analyses were carried out using the linear mixed model framework within Phenstat (56). *Agenesis of the assessed region. (B) Brain images at Bregma −1.34 mm stained with cresyl violet and luxol blue showing the corpus callosum (cc) in WT (Upper) and agenesis of the cc in Wdr47−/− (Lower). The yellow arrow shows the agenesis (absence) of the corpus callosum. (Magnification: 20×.) (C) Numbers around the circle show assessed brain regions (a description is provided in Dataset S2). aca, anterior part of anterior commissure; AM, amygdala; Arc, arcuate nucleus; B, bottom; Cg, cingulate cortex; CPu, caudate putamen; D3V, dorsal third ventricle; DG, dentate gyrus; dhc, dorsal hippocampal commissure; fi, fimbria; gcc, genu of cc; Hb, habenula; HP, hippocampus; HYPO, hypothalamus; ic, internal capsule; LV, lateral ventricles; M1, motor cortex; Mol, molecular layer of HP; mt, mammillothalamic tract; ns, not significant; opt, optical nerve; Or, oriens layer of HP; Pir, piriform cortex; Rad, radiatum layer of HP; RSGc, retrosplenial granular cortex; S2, somatosensory cortex; T, top; TBA, total brain area; TILpy, total pyramidal cell layer.
Fig. 2.
Fig. 2.
Characterization of Wdr47 mouse models. (A) Wdr47 relative expression using qRT-PCR in Wdr47+/tm1a (n = 3), Wdr47tm1a/tm1a (n = 3), and WT (n = 3) across 11 tissues and in Wdr47+/tm1b (n = 3) and WT (n = 3) across 4 tissues (cortex, hippocampus, spinal cord, and heart). Normalization was done using GNAS (guanine nucleotide-binding protein, alpha-stimulating). (B) WDR47 protein profiling in cortex of WT (n = 3) and Wdr47tm1a/tm1a (n = 3). Normalization was done using β-actin. (C) LacZ staining in adult Wdr47+/tm1a across the cortex, pyramidal cells (py), dendate gyrus (DG), piriform cortex (pir), arcuate nucleus (Arc), and ventromedial part (VMH) of the hypothalamus. (Magnification: 20×.) (D) Correlation between Wdr47 average expression and percentage mouse lethality; 843 Wdr47tm1a and 242 Wdr47tm1b were used. A linear regression was fitted (r2 = 0.9). (E) Mouse survival outcome carried out at nine time points both in Wdr47tm1a males and in Wdr47tm1a females. Expected ratio indicates 25% for WT, 50% for Wdr47+/tm1a, and 25% for Wdr47tm1a/tm1a. (F) Mouse survival outcome on supplementation in fortified diet with extra lipids and folic acid (3 vs. 0.7 mg) in Wdr47tm1a and Wdr47tm1b across three generations. Plots are represented as mean + SEM. Statistical analysis was done using Student’s t test (two-tailed; A and B) and χ2 test relative to expected counts (F). *P < 0.05; **P < 0.01; ***P < 0.001; ****P < 1E-06; #P < 0.07.
Fig. 3.
Fig. 3.
Major fiber tracts defects and microcephaly in adult male and female mice. (A) Heat map of 22 brain regions quantified at lateral 0.72 mm (Fig. S2B and Dataset S8) across Wdr47+/tm1a and Wdr47tm1a/tm1a, both male and female, vs. respective WT (n = 3 in each group). Histograms of percentage changes in comparison with WT (100%). (B) Heat map of 25 and 31 sagittal brain regions quantified at lateral 1.32 mm and 2.52 mm in male and female Wdr47+/tm1a and Wdr47tm1a/tm1a, respectively. (C) Sagittal sections stained with cresyl violet and luxol blue in mice with reducing relative expression of Wdr47. (Magnification: 20×.) (D) Height of cortical layers in adult Wdr47tm1a/tm1a (n = 6) compared with WT (n = 6) at Bregma +0.98 mm. (E) Height of cortical layers at Bregma −1.34 mm in Wdr47tm1a/tm1a compared with WT. (F) Number of cells and cell sizes in layers II/III in Wdr47tm1a/tm1a (n = 6) compared with WT (n = 6). Plots are represented as mean + SEM. *P < 0.05 (Student’s t test, two-tailed); **P < 0.01 (Student’s t test, two-tailed); ***P < 0.001 (Student’s t test, two-tailed). 7N, facial nucleus; aca, anterior part of anterior commissure; acp, posterior part of anterior commissure; B, bottom; cc, corpus callosum; CPu, caudate putamen; DG, dentate gyrus; fi, fimbria; Gn, geniculate nucleus; GP, globus pallidus; HP, hippocampus; ic, internal capsule; IGL, internal granule cell layer; InfC, inferior colliculus; Lat, lateral cerebellar nucleus; LR4V, fourth ventricle; LV, lateral ventricles; M1, motor cortex; Mol, molecular layer of HP; ns, not significant; opt, optical nerve; Or, oriens layer of HP; Pir, piriform cortex; Rad, radiatum layer of HP; S2, somatosensory cortex; SNR, substantia nigra; T, top; TBA, total brain area; TCA, total cerebellar area; TILpy, total pyramidal cell layer.
Fig. S2.
Fig. S2.
Sagittal sections of interest in adult mice (16 wk of age). (A) Representative image of histological workflow and specific lateral positions at which sagittal sections were cut for quantitative analysis. (B) Regions quantified using ImageJ have been traced on the representative image of the sagittal section 7 of interest lateral 0.72 mm. (C) Representative image of sagittal section 8 of interest (lateral 1.32 mm). (D) Representative image of sagittal section 9 of interest (lateral 2.52 mm). All brain sections were stained using cresyl violet and luxol blue. 4V, fourth ventricle; 7N, facial nucleus; aca, anterior part of anterior commissure; acp, posterior part of anterior commissure; AD, anterodorsal thalamic nucleus; B, bottom; cc, corpus callosum; Cg, cingulate cortex; Cpu, caudate putamen; DG, dentate gyrus; DS, dorsal subiculum; f, fornix; fi, fimbria; Folia, number of folia; fp, fibre of pons; Gn, geniculate nucleus; GP, globus pallidus; hif, hippocampal fissure; HP, hippocampus; ic, internal capsule; IGL, internal granular layer of cerebellum; InfC, inferior colliculus; Lat, lateral cerebellar nucleus; LR4V, fourth ventricle; LSV, ventral part of lateral septal nucleus; LV, lateral ventricle; M1, primary motor cortex; M2, secondary motor cortex; Med, medial cerebellar nucleus; Mn, mammilary nucleus; Mol, molecular layer of HP; och, optic chiasm; opt, optic tract; Or, oriens layer of HP; Pir, piriform cortex; Pn, pontine nuclei; Rad, radiatum layer of HP; S1, primary somatosensory cortex; sm, stria medullaris; SN substantia nigra; SNR, substantia nigra region; T, top; TB_Height1, height at Bregma +0.86 mm; TB_Height2, height at Bregma −1.34 mm; TB_Width, width of the total brain; TBA, total brain area; TCA, total cerebellar area; TILpy, total internal length of pyramidal cell layer of HP; TOL, total outer length. (Magnification: 20×.)
Fig. S3.
Fig. S3.
Comparison between male and female Wdr47 mice using sagittal sections. (A) Correlation between phenotypic severity in fornix (f), anterior commissure anterior part (aca), and corpus callosum (cc) and percentage relative expression in both male and female. (B) Heat map of the effect size of the 95 neuroanatomical phenotypes (Dataset S8) quantified on three selected sagittal sections in three KO models (n = 3, male, female); nd refers to no data. 4V, fourth ventricle; 7N, facial nucleus; aca, anterior part of anterior commissure; acp, posterior part of anterior commissure; AD, anterodorsal thalamic nucleus; B, bottom; cc, corpus callosum; Cg, cingulate cortex; Cpu, caudate putamen; DG, dentate gyrus; DS, dorsal subiculum; f, fornix; fi, fimbria; Folia, number of folia; fp, fibre of pons; Gn, geniculate nucleus; GP, globus pallidus; hif, hippocampal fissure; HP, hippocampus; ic, internal capsule; IGL, internal granular layer of cerebellum; InfC, inferior colliculus; Lat, lateral cerebellar nucleus; LR4V, fourth ventricle; LSV, ventral part of lateral septal nucleus; LV, lateral ventricle; M1, primary motor cortex; M2, secondary motor cortex; Med, medial cerebellar nucleus; Mn, mammilary nucleus; Mol, molecular layer of HP; och, optic chiasm; opt, optic tract; Or, oriens layer of HP; Pir, piriform cortex; Pn, pontine nuclei; Rad, radiatum layer of HP; S1, primary somatosensory cortex; sm, stria medullaris; SN substantia nigra; SNR, substantia nigra region; T, top; TB_Height1, height at Bregma +0.86 mm; TB_Height2, height at Bregma −1.34 mm; TB_Width, width of the total brain; TBA, total brain area; TCA, total cerebellar area; TILpy, total internal length of pyramidal cell layer of HP; TOL, total outer length.
Fig. S4.
Fig. S4.
Impact of enriched diet on brain anatomy. Schematic representation of brain features plotted in two coronal planes according to P values for chow diet- (A) and enriched diet-fed (B) mice. The first schematic image represents the striatum section (Bregma +0.98 mm), and the second represents the hippocampus section (Bregma −1.34 mm). White indicates P value higher than 0.05, and gray is no data (nd) for absence of data. Histograms of percentage changes relative to WT animals (100%) are colored according to the significance level are shown at the bottom. Section 1–1: 1_TBA; 2: 1_LV; 3: 1_Cg, 1_Cg_Width, 1_Cg_Height; 4: 1_gcc, 1_gcc_Height, 1_gcc_Width_T, 1_gcc_Width_B; 5: 1_CPu; 6: 1_aca; 7: 1_Pir; 8: 1_M1; 9: 1_S2. Section 2–1: 2_TBA; 2: 2_LV, 2_D3V; 3: 2_RSGc, 2_RSGc_Width, 2_RSGc_Height; 4: 2_cc, 2_cc_Width, 2_cc_Height, 2_dhc; 5: 2_HP, 2_TILpy, 2_DG, 2_Mol, 2_Rad, 2_Or; 6: 2_AM; 7: 2_Pir; 8: 2_M1; 9: 2_S2; 10: 2_mt; 11: 2_ic; 12: 2_opt; 13: 2_fi; 14: 2_Hb (a full description is in Dataset S2). ns, not significant.
Fig. S5.
Fig. S5.
Coronal sections of interest at embryonic age E18.5. Regions quantified using ImageJ have been traced on representative images of the three coronal sections of interest. (A) Critical section 4 at 2.19 mm, (B) critical section 5 at 3.51 mm, and (C) critical section 6 at 6.75 mm. Parameter names are described in Dataset S8. All brain sections were stained using cresyl violet. 3V, 3rd ventricle; 4V, 4th ventricle; aca, anterior commissure; Aq, aqueduct; Cg, cingulate cortex; CN, cochlear nucleus; CPu, caudate putamen; D3V, dorsal 3rd ventricule; DG, dentate gyrus; EGL, external granule cell layer; fi, fimbria; Folia, number of folia; gcc, genu of corpus callosum; HP, hippocampus; I, insular cortex; IC, inferior colliculus; ic, internal capsule; LR4V, lateral recess of 4th ventricle; LV, lateral ventricules; M1, motor cortex; Mol, molecular Layer of HP; ne, neuroepithelium; Or, Oriens layer of HP; Pons, pons; py, pyramidal tract; Rad, radiatum layer of HP; RS, retrosplenial granular cortex; S1, primary somatosensory cortex; S2, secondary somatosensory cortex; SC, superior colliculus; T, top; TBA, total brain area; TILpy, total internal length of pyramidal layer. (Magnification: 20×.)
Fig. 4.
Fig. 4.
Wdr47 is a key regulator in multiple steps of the neurogenic program. (A) Heat map of neuroanatomical defects in Wdr47tm1a at E18.5 (n = 4 Wdr47tm1a/tm1a, n = 5 Wdr47+/tm1a, n = 5 WT) (Dataset S9) and images illustrating neuroanatomical anomalies. (Magnification: 20×.) (B, Upper) Zoom in of boxed area in A showing height of neocortical layers in sections stained with cresyl violet from WT (n = 5) and Wdr47tm1a/tm1a (n = 4) embryos at E18.5. (B, Lower) Quantification of individual cortical layers. **P < 0.01 (Student’s t test, two-tailed). (C) Western blot of WDR47 expression in WT cortical tissues from E12.5 to P2. β-actin is used as a loading control. (D) LacZ expression pattern in E14.5 to E18.5 Wdr47+/tm1a across the cortex (n = 3 per group). (E) Percentage of apoptotic cells in each bin of cortical plate from E18.5 WT (n = 3) and Wdr47tm1b/tm1b (n = 3) cortices [activated caspase 3+ (a-Casp3) in green]. Arrows point to a-Casp3+ cells. (F) E18.5 WT (n = 4) and Wdr47tm1b/tm1b (n = 4) cortices showing cycling progenitors (Ki67+ in red). (G and H) E18.5 WT (n = 3) and Wdr47tm1b/tm1b (n = 3) cortices showing apical progenitors (APs; Pax6+ in green) and intermediate progenitors (IPs; Tbr2+ in red). (I and J) E18.5 WT (n = 3) and Wdr47tm1b/tm1b (n = 3) cortices showing cycling APs (Pax6+ in green and Ki67+ in red) and cycling IPs (Tbr2+ in red and Ki67+ in green). **P < 0.01 (Student’s t test, two-tailed). (K) In utero electroporation procedure. (L) E18.5 WT (n = 3) and Wdr47flox/flox (n = 3) cortices electroporated at E14.5 with NeuroD:Cre-GFP. The percentage of GFP+ cells represents neurons from the region highlighted in L. Plots are represented as mean + SEM. Images are produced using confocal microscopy, and nuclei counterstaining are performed with DAPI (blue). Wdr47tm1b/tm1b is expressed as proportion of control (FH). aca, anterior part of anterior commissure; cc, corpus callosum; Cg, cingulate cortex; CP, cortical plate; DG, dentate gyrus; fi, fimbria; HP, hippocampus; ic, internal capsule; IZ, intermediate zone; LV, lateral ventricles; M1, motor cortex; MZ, marginal zone; Or, oriens layer; RS, retrosplenial granular cortex; SP, subplate; SVZ, subventricular zone; TILpy, total pyramidal cell layer; VZ, ventricular zone. (Scale bars: E, F, and L, 100 µm; GJ, 50 µm.) ***P < 0.0001 (two-way ANOVA followed by Bonferroni correction).
Fig. S6.
Fig. S6.
Neuroanatomical characterization of P8 and 16- and 56-wk old mice. (A) Heat map of neuroanatomical defects in Wdr47tm1a KO mice at P8 (n = 2 Wdr47tm1a/tm1a, n = 4 Wdr47+/tm1a, n = 3 WT) (Dataset S9) and representative images illustrating neuroanatomical anomalies, such as reduced primary motor cortex (M1) thickness at Bregma 2.19 mm. (Magnification: 20×.) (B) Plot of a normal distribution (based on density function) representing the effect size of 38 neuroanatomical measurements recorded on coronal plane in mice ages 56 wk old in comparison with mice at 16 wk old (male, n = 3) (Dataset S9). No visual difference is evident in the image montage of WT and Wdr47tm1a/tm1a mice coronal brain sections at 16 and 56 wk of age. (Magnification: 20×.) (C) Number and average size of cells in layers II/III of the cortex in mice ages 16 and 56 wk old (male, n = 3). All plots are represented as mean + SEM. Statistical analysis was done using Student’s t test (two-tailed). **P < 0.01; ***P < 0.001. aca, anterior part of anterior commissure; Cg, cingulate cortex; gcc, genu of the corpus callosum; Hb, habenula; Pir, piriform cortex; T, top; TBA, total brain area.
Fig. S7.
Fig. S7.
Wdr47 deletion does not affect early stages of cortical development. (A) E16.5 WT and Wdr47tm1b/tm1b cortices showing apoptotic cells (activated Caspase3+ in green). Arrow points to a-Caspase3+ cell. (B) E16.5 WT (n = 3) and Wdr47tm1b/tm1b (n = 4) cortices showing cycling progenitors (Ki67+ in red). *P < 0.05 (Student’s t test, two-tailed). (C and D) E16.5 WT (n = 3) and Wdr47tm1b/tm1b (n = 4) cortices showing apical progenitors (C; Pax6+ in green) and intermediate progenitors (D; Tbr2+ in red). (E and F) E16.5 WT (n = 3) and Wdr47tm1b/tm1b (n = 4) cortices showing cycling apical progenitors (E; Pax6+ in green and Ki67+ in red) and cycling intermediate progenitors (F; Tbr2+ in red and Ki67+ in green). (G and H) E16.5 WT (n = 3) and Wdr47tm1b/tm1b (n = 4) cortices showing newborn apical progenitors (G; Pax6+ in green and newborn cells injected with EdU at E15.5 in red) and newborn intermediate progenitors (H; Tbr2+ in red and newborn cells injected with EdU at E15.5 in green). (I) E16.5 WT (n = 3) and Wdr47tm1b/tm1b (n = 5) cortices showing newborn cells (injected with EdU at E15.5 in red) and cycling progenitors (Ki67+ in green). *P < 0.05 (Student’s t test, two-tailed). (J) E18.5 WT (n = 3) and Wdr47tm1b/tm1b (n = 3) cortices injected with EdU at E14.5 quantified as percentage of EdU+ cells in several brain regions as indicated on the image. All plots are represented as mean + SEM. All representative images were produced using confocal microscopy, and nuclei counterstaining were performed with DAPI (blue). Wdr47tm1b/tm1b expressed as proportion of control (BD). CP, cortical plate; IZ, intermediate zone; SVZ, subventricular zone; VZ, ventricular zone. (Scale bars: A, B, and J, 100 µm; CI, 50 µm.) ***P < 0.0001 (two-way ANOVA followed by Bonferroni correction).
Fig. 5.
Fig. 5.
Microtubule-stabilizing role of WDR47 at the growth cone. (A) MRI in Wdr47tm1a/tm1a male. aca, anterior part of the anterior commissure; cc, corpus callosum; f, fornix. (B) Confocal microscopy images of projection patterns in the developing brain using axonal and commissural markers at E14.5 (n = 2) and E16.5 (n = 2). Ctx, cortex; DTB, diencephalon–telencephalon barrier; ic, internal capsule; Th, thalamus; TRN, thalamic reticular nucleus. (Scale bars: Left and Center, 1 mm; and Right, 100 μm.) (C) Fluorescent microscopy images of primary neurons derived from WT and Wdr47tm1a/tm1a embryos at E17.5 stained with anti-MAP2 (red) and SMI-312R (green) in hippocampal (HP) and cortical (Ctx) primary neuronal cultures. Area of cell body, length of axon, and area of growth cones were quantified using ImageJ and analyzed using the Kruskal–Wallis test. (Scale bars: Upper, 50 μm; Lower, 5 μm.) (D) Microtubule architecture studied in the growth cones of hippocampal primary neurons by staining for acetylated tubulin. White arrows show odd ring-like arrangements. (E) Superresolution single-molecule localization microscopy of hippocampal growth cone stained with acetylated tubulin in Wdr47tm1b/tm1b. (Scale bar: 5 μm.) (F) Western blot analysis of endogenous Tau levels in three Wdr47tm1a/tm1a compared with WT (n = 3). Quantification of relative protein expression is normalized against β-actin. (G) Images of primary hippocampal neurons derived from Wdr47tm1b/tm1b and WT embryos at E17.5 treated with 10 and 100 nM EpoD. Growth cone area was quantified using ImageJ after 1.5 h of treatment. (Scale bar: 5 μm.) ***P < 0.001; **P < 0.01; *P < 0.05.
Fig. S8.
Fig. S8.
WDR47 subcellular localization and neuronal wound assay. (A) Subneuronal localization of WDR47 using immunofluorescence (red) in primary cortical cultures of WT mice. (Magnification: 65×/one oil objective.) (B) Western blot verification of WDR47 knockdown in rat GT1-7 hypothalamus-derived neuronal cells in WDR47 siRNA-treated cells compared with control siRNA cells 24 h posttransfection (n = 7). (C) Scanning electron micrographs of control siRNA and WDR47 siRNA neurons at the level of the axon and growth cone in the migration zone. (Scale bar: 2 μm.) (D) Representative confocal (Left) and SR-SIM (Right) fluorescent micrographs of acetylated tubulin networks in control siRNA (Upper) and WDR47 siRNA-treated cells (Lower). The white arrow shows a highly convoluted structure in the perinuclear region. Western blot analysis of acetylated tubulin is carried out in control siRNA compared with WDR47 siRNA-treated cells. Normalization is done using housekeeping gene GAPDH. (Scale bars: Left, 20 μm; Right, 5 μm.) (E, Left) Transmission light micrographs of an in vitro 36-h neuronal migration assay of rat GT1-7 neuronal cells treated with control or WDR47 siRNA. The dashed red lines show the edge of the wound. White arrows indicate neurons at the edge of the wound. (E, Right) Average migration distance and migration velocity (micrometers per minute) in WDR47 siRNA-treated cells compared with the mitomycin control group or control siRNA group (n = 4 in each group). (F) Percentage of wound closure is shown over time in WDR47 siRNA-treated cells (n = 4). All plots are represented as mean ± SEM. #P < 0.07; *P < 0.05 (Student’s t test, two-tailed).
Fig. S9.
Fig. S9.
SCG10 interacts with WDR47. (A) Colocalization images of WDR47 with SCG10 and SCG10 with JNK1. (B) Relative expression of SCG10 transcripts in n = 3 Wdr47tm1a/tm1a mice using qRT-PCR compared with WT across four tissues (cortex, spinal cord, thalamus, and liver) plotted as mean + SEM. (C) Colocalization of SCG10 and WDR47 in GT1-7 hypothalamic neuronal cells. Upper Left shows expression in GT1-7 cells transfected with pEYFP-WDR47 (green). Upper Right shows expression of SCG10 labeled with Texas red anti-SCG10 antibody (red). Lower Left is the overlay of Upper, and Lower Right is the 3D colocalization of WDR47 and SCG10. (D) Western blot analysis of SCG10 relative protein levels in response to WDR47 siRNA treatment. GAPDH is used as a loading control. Statistical analysis was done using Student’s t test (two-tailed). *P < 0.05. (Magnification: A, Top and Bottom, 20×/one dry objective; A, Middle, 65×/one oil objective.)
Fig. 6.
Fig. 6.
Assessment of behavioral traits in Wdr47 mouse models. Mice were analyzed for behavioral anomalies using 16 tests (Dataset S11). Here, we show a selection of results for two cohorts: one male (11 mice Wdr47+/tm1b vs. 11 mice WT) and one female (5 mice Wdr47tm1a/tm1a vs. 7 mice WT). (A) Traveled distance in centimeters and numbers of rears for circadian activity recorded for 32 h and open-field activity for a duration of 30 min. (B) Learning and memory were tested using the Y maze (short-term memory), Morris water maze (spatial memory), and novel object recognition with retention time of 24 h (long-term memory). (C) Skilled movements evaluated using the MoRaG. (D) Grip strength for both forelimb and hind limb. (E) Motor coordination assessed using the notch bar. (F) Pain sensitivity evaluated by the latency to react to heat. All plots are represented as mean ± SEM. *P < 0.05; **P < 0.01; ***P < 0.001.
Fig. S10.
Fig. S10.
Additional assessment of whole-body traits in Wdr47 mice. (A) Anxiety assessed using two tests: the elevated plus maze and the open-field test. (B) Ataxic-like movements recorded using the gait analysis. (C) Pain sensitivity evaluated using the shock threshold at which the mouse reacts by flinching, vocalization, or jumping. (D) Touch sensitivity evaluated using the adhesive removal test. (E) Social behavior studied using the social interaction test. (F) Social memory tested using the social recognition test. (G) Body weight measurements in male mice at eight different time points. (H) Weight of white adipose tissue and brown adipose tissue in KO mice compared with matched WTs. (I) Behavioral assessment in aged mice (56 wk old). Comparison between forelimb strength and hind paw errors at 16 and 56 wk of age mice using eight Wdr47+/tm1a vs. eight matched WT mice (male; same cohort evaluated at both ages). Number of mice used for AH: female: n = 5 Wdr47tm1a/tm1a, n = 7 matched WT; male: n = 12 Wdr47+/tm1a, n = 5 matched WT. All plots are represented as mean ± SEM. *P < 0.05; **P < 0.01; ***P < 0.001; #P < 0.07.
Fig. 7.
Fig. 7.
WDR47 is a key effector of autophagy. (A) WDR47 and LIS1 structures. (B) Western blot on yeast protein extracts with anti-GFP antibodies. (C) Drop test growth assays done on WT yeast cells (BY4742) transformed with pAG413 [low-copy number centromere (CEN) plasmid; expression] or pAG423 (2 microns; overexpression) plasmids bearing LIS1 or WDR47. Midlog phase cultures of the indicated yeast cells serially diluted to the indicated OD600 and spotted onto synthetic medium without histidine (SC-His). Growth evaluated after 2 d of incubation at 30 °C. (D) WT BY4742 (control) or vps15Δ (negative control) yeast cells transformed with mCherry-Atg8 plasmid and WT BY4742 cells cotransformed with expression plasmid (pAG413) bearing LIS1 or WDR47 cDNA observed by fluorescent microscopy after incubation for 4 h in nitrogen starvation medium (SD-N) to induce autophagy. (Scale bars: 5 μm.) (E) Living WT yeast cells (BY4742) expressing human LIS1-GFP or WDR47-GFP and mCherry-Atg8 observed by fluorescence microscopy after induction of autophagy by incubation in SD-N medium. (F) Western blot quantification of LC3 and p62 relative protein levels in the presence and absence of Bafilomycin A1 (Baf) treatment in response to WDR47 siRNA treatment. GAPDH was used as a loading control. (G) Western blot images of p62, mTOR, and phospho-mTOR in the cortex of WT and Wdr47tm1a/tm1a. Quantification of relative protein expression normalized against β-actin is plotted as mean ± SEM (n = 6 Wdr47tm1a/tm1a and n = 9 WT, male and female). *P < 0.05; **P < 0.01. (H) Transmission EM of cortical neurons from Wdr47tm1a/tm1a embryos (n = 3) at E18.5 compared with WT (n = 3). (Scale bars: Left, 2 μm; Right, 1 μm.)
Fig. S11.
Fig. S11.
WDR47 and LIS1 localization in yeast. (A) Living WT yeast cells (BY4742) expressing or overexpressing human LIS1-GFP or WDR47-GFP observed by fluorescence microscopy after staining of the vacuoles with the FM4-64 lipid dye. Merge shows the merge between the GFP and DsRED images, and Merge + DIC shows the merge between the GFP, DsRED, and DIC images. (B) Living WT yeast cells (BY4742) expressing human LIS1-GFP or WDR47-GFP observed by fluorescence microscopy to study localization in endosomal compartment positive for FYVE-DsRED (a probe for PtdIns3P that is localized on endosomes in yeast) and the Golgi complex (labeled with Sec7). (Magnification: 100×/1.45 oil objective.)
Fig. 8.
Fig. 8.
Summary of WDR47 working model. At the cellular level, WDR47 acts as a stabilizer of microtubules. SCG10, a microtubule destabilizer at the growth cone, is regulated by JNK1 through phosphorylation. In the cytoplasm, WDR47 negatively regulates p62 and LC3-mediated autophagy. Reduced expression of Wdr47 leads to destabilization of the microtubules, increased Tau and autophagic flux, and decreased cell motility. At the tissue level, the loss of Wdr47 yields fiber tract defects, including corpus callosum agenesis, microcephaly, and thinner cortices, that are linked to a reduced number of progenitors, increased number of neurons in the intermediate zone, and elevated number of dying neurons in the cortical upper layers. At the organism level, these defects may explain impairment in motor coordination, reduced grip strength, and increased pain sensitivity. AP, apical progenitor; IP, intermediate progenitor; MN, migrating neuron; MT, microtubule.

References

    1. Andrade MA, Perez-Iratxeta C, Ponting CP. Protein repeats: Structures, functions, and evolution. J Struct Biol. 2001;134:117–131. - PubMed
    1. Sondek J, Bohm A, Lambright DG, Hamm HE, Sigler PB. Crystal structure of a G-protein beta gamma dimer at 2.1A resolution. Nature. 1996;379:369–374. - PubMed
    1. Stirnimann CU, Petsalaki E, Russell RB, Müller CW. WD40 proteins propel cellular networks. Trends Biochem Sci. 2010;35:565–574. - PubMed
    1. Smith TF, Gaitatzes C, Saxena K, Neer EJ. The WD repeat: A common architecture for diverse functions. Trends Biochem Sci. 1999;24:181–185. - PubMed
    1. Hurtley S. Spatial cell biology. Location, location, location. Introduction. Science. 2009;326:1205. - PubMed

Publication types

MeSH terms

Substances

LinkOut - more resources