. 2017 Oct 27;17(1):174.
doi: 10.1186/s12870-017-1112-5.

Genome-wide analysis of wheat calcium ATPases and potential role of selected ACAs and ECAs in calcium stress

Affiliations

Genome-wide analysis of wheat calcium ATPases and potential role of selected ACAs and ECAs in calcium stress

Roohi Aslam et al. BMC Plant Biol. .

Abstract

Background: P2- type calcium ATPases (ACAs-auto inhibited calcium ATPases and ECAs-endoplasmic reticulum calcium ATPases) belong to the P- type ATPase family of active membrane transporters and are significantly involved in maintaining accurate levels of Ca2+, Mn2+ and Zn2+ in the cytosol as well as playing a very important role in stress signaling, stomatal opening and closing and pollen tube growth. Here we report the identification and possible role of some of these ATPases from wheat.

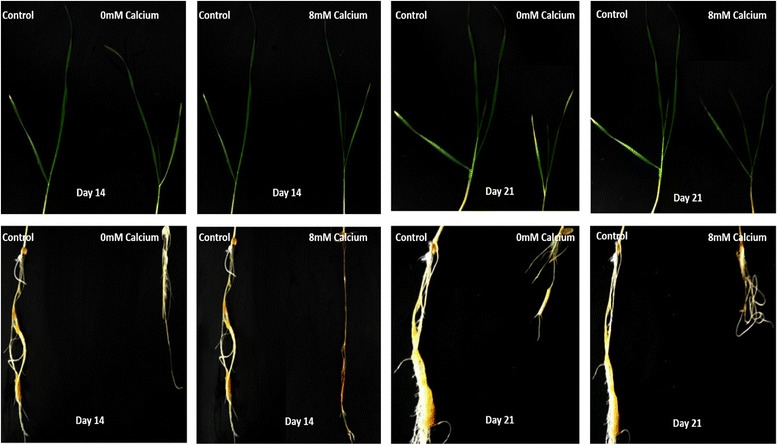
Results: In this study, ACA and ECA sequences of six species (belonging to Poaceae) were retrieved from different databases and a phylogenetic tree was constructed. A high degree of evolutionary relatedness was observed among P2 sequences characterized in this study. Members of the respective groups from different plant species were observed to fall under the same clade. This pattern highlights the common ancestry of P2- type calcium ATPases. Furthermore, qRT-PCR was used to analyse the expression of selected ACAs and ECAs from Triticum aestivum (wheat) under calcium toxicity and calcium deficiency. The data indicated that expression of ECAs is enhanced under calcium stress, suggesting possible roles of these ATPases in calcium homeostasis in wheat. Similarly, the expression of ACAs was significantly different in plants grown under calcium stress as compared to plants grown under control conditions. This gives clues to the role of ACAs in signal transduction during calcium stress in wheat.

Conclusion: Here we concluded that wheat genome consists of nine P2B and three P2A -type calcium ATPases. Moreover, gene loss events in wheat ancestors lead to the loss of a particular homoeolog of a gene in wheat. To elaborate the role of these wheat ATPases, qRT-PCR was performed. The results indicated that when plants are exposed to calcium stress, both P2A and P2B gene expression get enhanced. This further gives clues about the possible role of these ATPases in wheat in calcium management. These findings can be useful in future for genetic manipulations as well as in wheat genome annotation process.

Keywords: ACAs; Calcium; ECAs; P2- type; qRT-PCR.


Conflict of interest statement

Ethics approval and consent to participate

Dr. Alvina Gul Kazi from “Wheat Wide Crosses” lab at National Agriculture and Research Council (NARC) Pakistan identified and provided Wheat seeds (var. Sehar-06). Sehar-06 is a widely cultivated wheat variety in Pakistan.

Consent for publication

Not applicable.

Competing interests

The authors declare that they have no competing interests.

Publisher’s Note

Springer Nature remains neutral with regard to jurisdictional claims in published maps and institutional affiliations.

Figures

Fig. 1
Fig. 1
Molecular Phylogenetic analysis by Maximum Likelihood method. Tree with highest log likelihood is shown in the figure. For tree construction, the positions containing gaps were eliminated. There were a total of 372 positions in the final dataset
Fig. 2
Fig. 2
Growth of wheat plants using hydroponic culture on calcium deficiency, toxicity and control media on 14th and 21st day of growth. Reduction in volume of Triticum aestivum roots grown under calcium deficiency and toxicity as compared to control after 14 and 21 days of growth on control medium. The shoots grown under calcium deficiency and toxicity displayed chlorosis symptoms and reduction in length
Fig. 3
Fig. 3
Average FW values of Triticum aestivum plants grown under calcium deficiency and toxicity plotted against average FW values of Triticum aestivum plants grown under control conditions. A significant difference was evaluated using Student’s t-test, where P < 0.05 * = significant difference. The data indicate that Plants grown under control conditions i.e., normal 2 mM Ca concentration in the solution grow well and gain more weight as compared to plants grown under calcium deficiency (0 mM Ca concentration in solution) and toxicity (8 mM ca concentration in solution)
Fig. 4
Fig. 4
qRT-PCR data indicating the expression of ECA1 and ECA3 in Triticum aestivum shoots and roots under calcium deficiency/toxicity and control. The experiment was repeated thrice and three biological reps and three technical reps were used each time. The fold difference was evaluated relative to baseline D0 control. The significant differences in expression of ECA1 and ECA3 genes in plants grown under calcium deficiency and toxicity conditions as compared to plants grown under control conditions were evaluated using student’s t-test. Significant differences are indicated by * where P < 0.05. Standard error bars have been shown for data obtained from real time PCR. Y-axis shows the fold difference, whereas, the treatments are given on X-axis. Differences in colors of the bars are used to indicate the days of growth
Fig. 5
Fig. 5
qRT-PCR data indicating the expression of ACA2, ACA3 and ACA4 in Triticum aestivum shoots and roots under calcium deficiency/toxicity and control conditions. The experiment was repeated thrice and three biological reps and three technical reps were used each time. The fold difference was evaluated relative to baseline D0 control. The significant difference in expression of ACA2, ACA3 and ACA4 genes in plants grown under calcium stress (deficiency/toxicity) as compared to plants grown under control conditions was evaluated using student’s t-test. The significant differences are indicated by * where P < 0.05. Standard error bars have been shown for data obtained from real time PCR. Y-axis shows the fold difference, whereas, the treatments are given on X-axis. Differences in colors of the bars are used to indicate the days of growth

Similar articles

Cited by

References

    1. Axelsen KB, Palmgren MG. Evolution of substrate specificities in the P-type ATPase superfamily. J Mol Evol. 1998;46(1):84–101. doi: 10.1007/PL00006286. - DOI - PubMed
    1. Mills RF, Doherty ML, López-Marqués RL, Weimar T, Dupree P, Palmgren MG, et al. ECA3, a Golgi-localized P2A-type ATPase, plays a crucial role in manganese nutrition in Arabidopsis. Plant Physiol. 2008;146(1):116–128. doi: 10.1104/pp.107.110817. - DOI - PMC - PubMed
    1. Pedersen CN, Axelsen KB, Harper JF, Palmgren MG. Evolution of plant P-type ATPases. Frontiers in Plant Science. 2012;3:31. - PMC - PubMed
    1. Ferrol N, Bennett AB. A single gene may encode differentially localized Ca2+−ATPases in tomato. Plant Cell. 1996;8(7):1159–1169. - PMC - PubMed
    1. Wimmers LE, Ewing NN, Bennett AB. Higher plant ca (2+)-ATPase: primary structure and regulation of mRNA abundance by salt. Proc Natl Acad Sci. 1992;89(19):9205–9209. doi: 10.1073/pnas.89.19.9205. - DOI - PMC - PubMed

LinkOut - more resources