. 2017 Oct 27;18(1):827.
doi: 10.1186/s12864-017-4213-5.

Comprehensive analysis of GASA family members in the Malus domestica genome: identification, characterization, and their expressions in response to apple flower induction

Affiliations

Comprehensive analysis of GASA family members in the Malus domestica genome: identification, characterization, and their expressions in response to apple flower induction

Sheng Fan et al. BMC Genomics. .

Abstract

Background: The plant-specific gibberellic acid stimulated Arabidopsis (GASA) gene family is critical for plant development. However, little is known about these genes, particularly in fruit tree species.

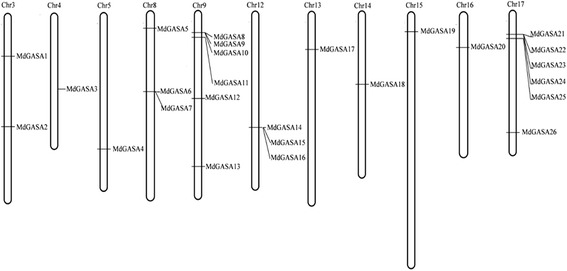
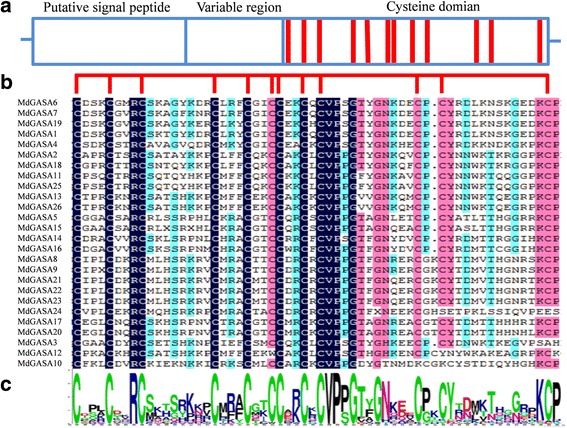
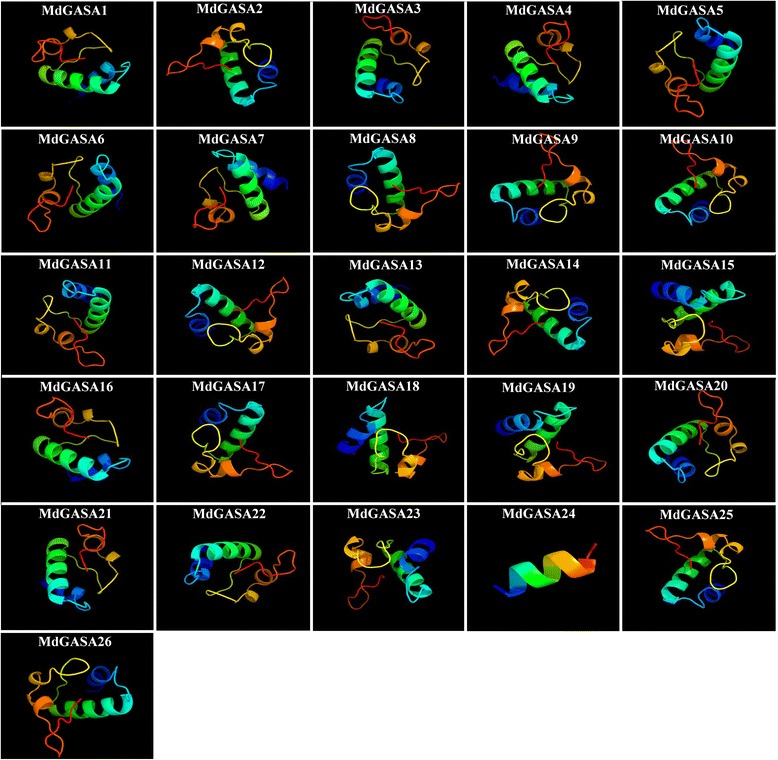
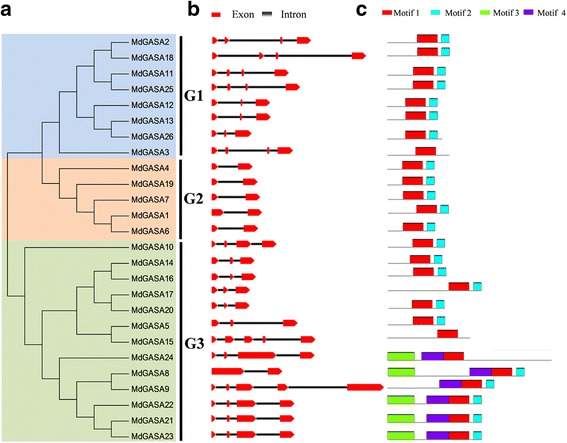
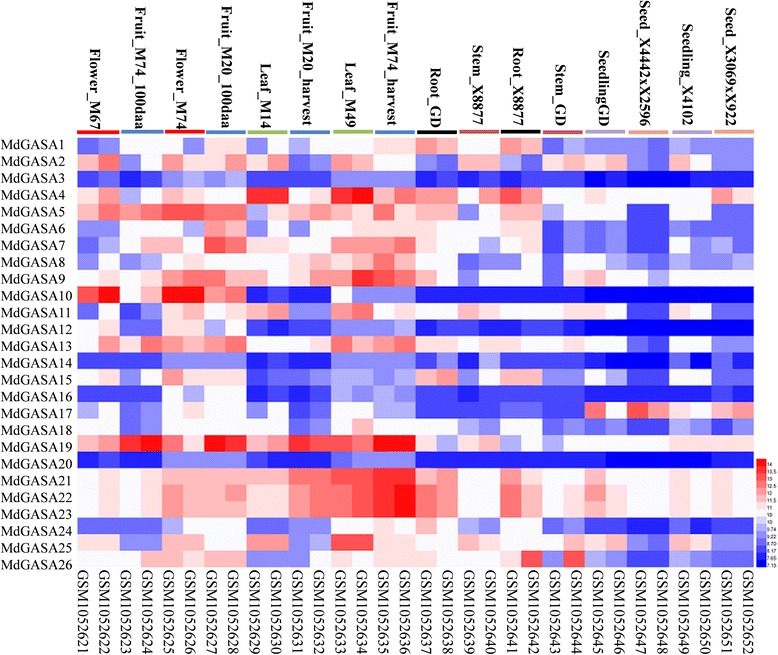
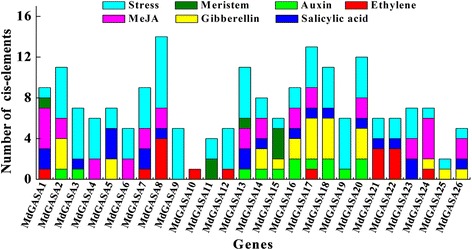
Results: We identified 15 putative Arabidopsis thaliana GASA (AtGASA) and 26 apple GASA (MdGASA) genes. The identified genes were then characterized (e.g., chromosomal location, structure, and evolutionary relationships). All of the identified A. thaliana and apple GASA proteins included a conserved GASA domain and exhibited similar characteristics. Specifically, the MdGASA expression levels in various tissues and organs were analyzed based on an online gene expression profile and by qRT-PCR. These genes were more highly expressed in the leaves, buds, and fruits compared with the seeds, roots, and seedlings. MdGASA genes were also responsive to gibberellic acid (GA3) and abscisic acid treatments. Additionally, transcriptome sequencing results revealed seven potential flowering-related MdGASA genes. We analyzed the expression levels of these genes in response to flowering-related treatments (GA3, 6-benzylaminopurine, and sugar) and in apple varieties that differed in terms of flowering ('Nagafu No. 2' and 'Yanfu No. 6') during the flower induction period. These candidate MdGASA genes exhibited diverse expression patterns. The expression levels of six MdGASA genes were inhibited by GA3, while the expression of one gene was up-regulated. Additionally, there were expression-level differences induced by the 6-benzylaminopurine and sugar treatments during the flower induction stage, as well as in the different flowering varieties.

Conclusion: This study represents the first comprehensive investigation of the A. thaliana and apple GASA gene families. Our data may provide useful clues for future studies and may support the hypotheses regarding the role of GASA proteins during the flower induction stage in fruit tree species.

Keywords: Apple; Characterization; Expression profile; Flower induction; GASA gene.


Conflict of interest statement

Ethics approval and consent to participate

Malus domescica (‘Yanfu No. 6’ and ‘Nagafu No. 2’) were widely planted in China. They were not listed in the appendices I, II and III of the Convention on the Trade in Endangered Species of Wild Fauna and Flora (https://cites.org/eng/app/appendices.php). All the available materials used in our study were grown in the Apple Demonstration Nursery of Yangling Modern Agriculture Technology Park (Northwest A&F University). Samples collection complied with the institutional, national and international guidelines. This article did not contain any studies with human participants or animals performed byany of authors. No specific permits were required.

Consent for publication

Not applicable.

Competing interests

The authors declare that they have no competing interests.

Publisher’s Note

Springer Nature remains neutral with regard to jurisdictional claims in published maps and institutional affiliations.

Figures

Fig. 1
Fig. 1
Locations of MdGASA genes on each apple chromosome
Fig. 2
Fig. 2
Alignment of the GASA domain from MdGASA proteins. a Analysis of GASA protein structures, red column represented their conserved twelve cysteines. b Multiple alignments of the MdGASA protein sequences. Their conserved GASA domains were indicated. c Sequence logo analysis of the conserved GASA domains. Each stack represented their amino acids
Fig. 3
Fig. 3
Predicted dimensional structures of MdGASA proteins
Fig. 4
Fig. 4
Analysis of MdGASA gene structures. a An unrooted phylogenetic tree constructed based on MdGASA protein sequences. b Exon-intron composition analysis, red boxes and black line were exon and intron positions, respectively. c Conserved motifs analysis, details motifs can be seen Fig. S2
Fig. 5
Fig. 5
Phylogenetic analysis of apple and Arabidopsis thaliana GASA genes. Protein designations: Arabidopsis (At, blue triangle) and apple (Md, red circle)
Fig. 6
Fig. 6
Analysis of evolutionary relationships among GASA gene family members. Relative positive positions were depicted according to the apple chromosomes, colored lines were syntenic regions of the apple genome. (b) Synteny analysis of GASA genes between Arabidopsis and apple, relative positive positions were depicted according to the apple and Arabidopsis chromosomes, colored lines were syntenic regions of apple and Arabidopsis genome
Fig. 7
Fig. 7
MdGASA gene expression profiles in different tissues and in different apple varieties. Relative expression profiles are based the online database (E-GEOD-42873)
Fig. 8
Fig. 8
Analysis of MdGASA expression levels in different ‘Nagafu No. 2’ tissues. Each value represents the mean ± standard error of three biological replicates. Means followed by small letters are significantly different at the 0.05 level
Fig. 9
Fig. 9
Analysis of flowering-related MdGASA expression levels in response to GA3 (a) and 6-BA (b) treatments. Samples were collected at 30, 40, 50, 60, 70, and 80 days after full bloom (DAFB), with water used as a control. Each value represents the mean ± standard error of three replicates. Means followed by small letters are significantly different at the 0.05 level
Fig. 10
Fig. 10
Analysis of flowering-related MdGASA expression levels in response to sugar (a) and in different apple varieties (‘Nagafu No. 2’ and ‘Yanfu No. 6’) (b). Samples were collected at 30, 40, 50, 60, 70, and 80 days after full bloom (DAFB), with water used as a control. Each value represents the mean ± standard error of three replicates. Means followed by small letters are significantly different at the 0.05 level
Fig. 11
Fig. 11
Predicted cis-elements in the MdGASA promoters. The 1.5-kb sequences of 26 MdGASA genes were analyzed with the PlantCARE program

Similar articles

Cited by

References

    1. Shi LF, Gast RT, Gopalraj M, Olszewski NE. Characterization of a shoot-specific, Ga3-regulated and Aba-regulated gene from tomato. Plant J. 1992;2(2):153–159. - PubMed
    1. Herzog M, Dorne AM, Grellet F. GASA, a gibberellin-regulated gene family from Arabidopsis Thaliana related to the tomato GAST1 gene. Plant Mol Biol. 1995;27(4):743–752. doi: 10.1007/BF00020227. - DOI - PubMed
    1. Ben-Nissan G, Lee JY, Borohov A, Weiss D. GIP, a Petunia Hybrida GA-induced cysteine-rich protein: a possible role in shoot elongation and transition to flowering. Plant J. 2004;37(2):229–238. doi: 10.1046/j.1365-313X.2003.01950.x. - DOI - PubMed
    1. Furukawa T, Sakaguchi N, Shimada H. Two OsGASR genes, rice GAST homologue genes that are abundant in proliferating tissues, show different expression patterns in developing panicles. Genes Genet Syst. 2006;81(3):171–180. doi: 10.1266/ggs.81.171. - DOI - PubMed
    1. Nahirnak V, Rivarola M, de Urreta MG, Paniego N, Hopp HE, Almasia NI, Vazquez-Rovere C. Genome-wide analysis of the Snakin/GASA gene family in Solanum Tuberosum cv. Kennebec. Am J Potato Res. 2016;93(2):172–188. doi: 10.1007/s12230-016-9494-8. - DOI

MeSH terms

LinkOut - more resources