Comparative Study
. 2017 Oct 27;18(1):46.
doi: 10.1186/s12865-017-0229-5.

Transcriptomic data from two primary cell models stimulating human monocytes suggest inhibition of oxidative phosphorylation and mitochondrial function by N. meningitidis which is partially up-regulated by IL-10

Affiliations
Comparative Study

Transcriptomic data from two primary cell models stimulating human monocytes suggest inhibition of oxidative phosphorylation and mitochondrial function by N. meningitidis which is partially up-regulated by IL-10

Unni Gopinathan et al. BMC Immunol. .

Abstract

Background: Biological interpretation of DNA microarray data may differ depending on underlying assumptions and statistical tests of bioinformatics tools used. We used Gene Set Enrichment Analysis (GSEA) and Ingenuity Pathway Analysis (IPA) to analyze previously generated DNA microarray data from human monocytes stimulated with N. meningitidis and IL-10 ("the model system"), and with meningococcal sepsis plasma before and after immunodepletion of IL-10 ("the patient plasma system"). The objectives were to compare if the two bioinformatics methods resulted in similar biological interpretation of the datasets, and to identify whether GSEA provided additional insight compared with IPA about the monocyte host response to meningococcal activation.

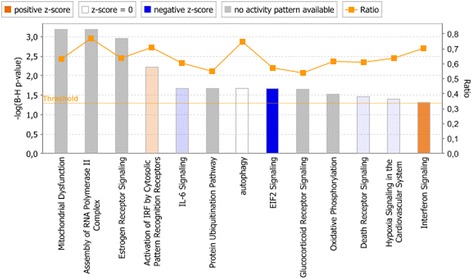
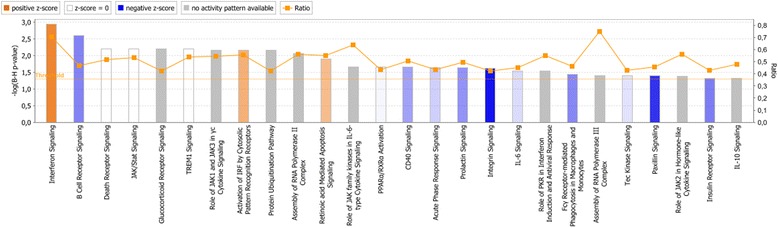
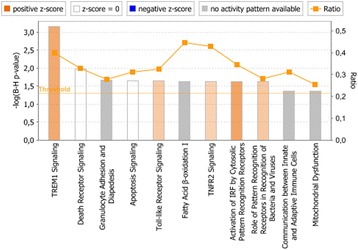
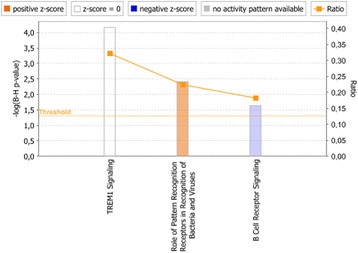
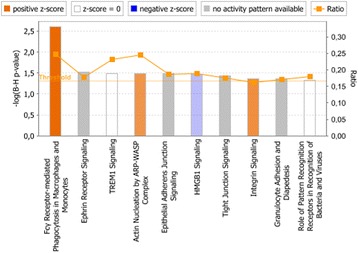
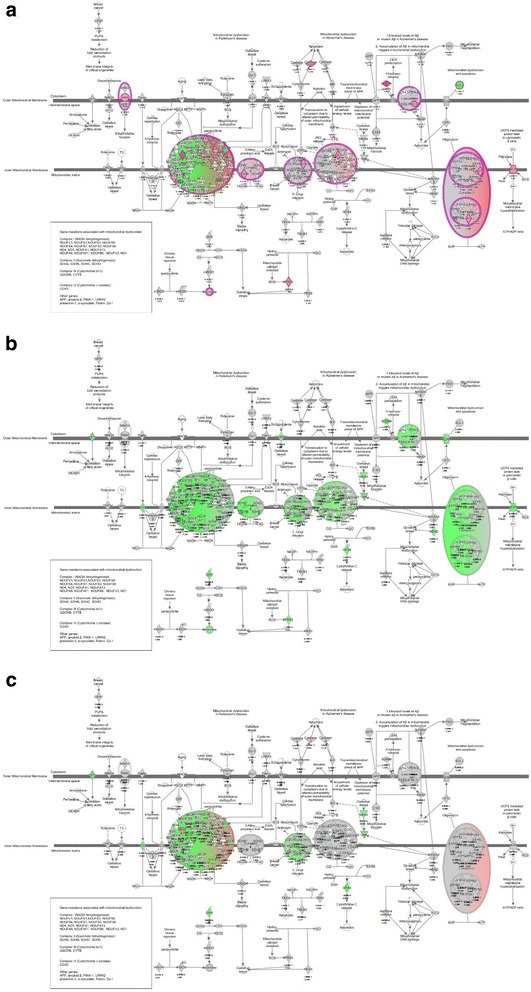
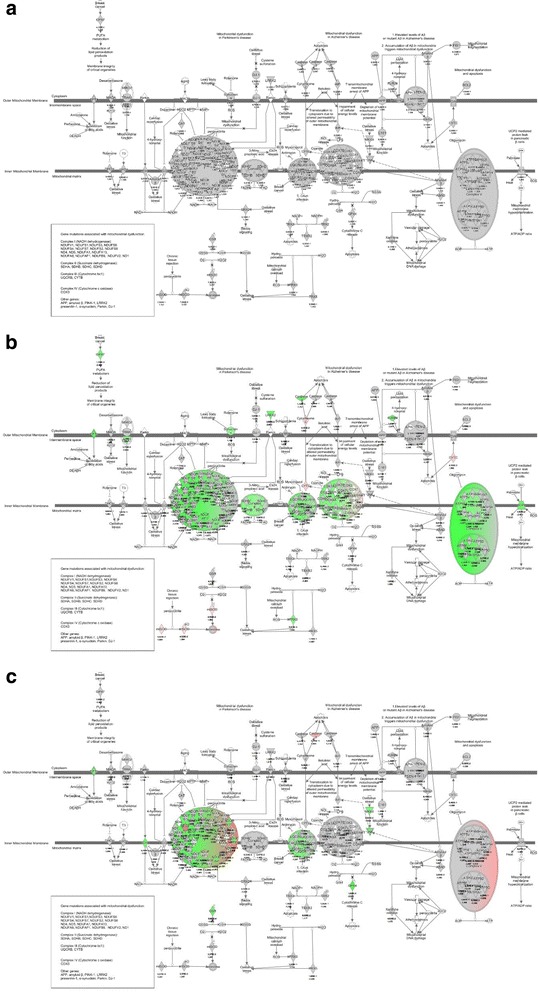
Results: In both experimental models, GSEA and IPA identified genes associated with pro-inflammatory innate immune activation, including TNF-signaling, Toll-like receptor signaling, JAK-STAT-signaling, and type I and type II interferon signaling. GSEA identified genes regulated by the presence of IL-10 with similar gene sets in both the model system and the patient plasma system. In the model system, GSEA and IPA in sum identified 170 genes associated with oxidative phosphorylation/mitochondrial function to be down-regulated in monocytes stimulated with meningococci. In the patient plasma system, GSEA and IPA in sum identified 122 genes associated with oxidative phosphorylation/mitochondrial dysfunction to be down-regulated by meningococcal sepsis plasma depleted for IL-10. Using IPA, we identified IL-10 to up-regulate 18 genes associated with oxidative phosphorylation/mitochondrial function that were down-regulated by N. meningitidis.

Conclusions: Biological processes associated with the gene expression changes in the model system of meningococcal sepsis were comparable with the results found in the patient plasma system. By combining GSEA with IPA, we discovered an inhibitory effect of N. meningitidis on genes associated with mitochondrial function and oxidative phosphorylation, and that IL-10 partially reverses this strong inhibitory effect, thereby identifying, to our knowledge, yet another group of genes where IL-10 regulates the effect of LPS. We suggest that relying on a single bioinformatics tool together with an arbitrarily chosen filtering criteria for data analysis may result in overlooking relevant biological processes and signaling pathways associated with genes differentially expressed between compared experimental conditions.

Keywords: Bioinformatics; Gene expression; Gene set enrichment analysis; Ingenuity pathway analysis; Interleukin-10; Meningococcal sepsis; N. Meningitidis; mRNA.


Conflict of interest statement

Ethics approval and consent to participate

This study used DNA microarray data generated from the use of patient plasma samples (n = 6), previously collected after informed consent from parents, relatives, or patients, and used in accordance with ethics approval from the Regional Medical Ethics Committee of Health Region I in Norway (Biobank material access number 948; Studies of meningococcal disease; Oslo University Hospital, Oslo, Norway). The clinical and microbiological data on each patient has previously been reported [26]. Human monocytes elutriated from heparinized whole blood collected from consenting, healthy donors was also used for the experiments that generated the data for this study, and were used in accordance with ethics approval from the Regional Medical Ethics Committee of Health Region I in Norway (Biobank material access number 908; Human monocytes and lymphocytes; Oslo University Hospital, Oslo, Norway).

Consent for publication

Not applicable.

Competing interests

The authors declare that they have no competing interests.

Publisher’s Note

Springer Nature remains neutral with regard to jurisdictional claims in published maps and institutional affiliations.

Figures

Fig. 1
Fig. 1
Canonical pathways significantly enriched in human monocytes when comparing Nm vs ctr. Significantly enriched canonical pathways were identified with a right-tailed Fisher’s Exact Test that calculates a P-value determining the probability that each canonical pathway associated with the dataset was due to chance alone. The P-values were corrected for multiple testing using the Benjamini-Hochberg method for correcting the FDR. The z-score indicates predicted activation state of the canonical pathway. Blue color or lighter shades of blue indicate a negative z-score and down-regulation of the pathway, and orange color or lighter shades of orange indicate a positive z-score and up-regulation of the pathway. Ratio denotes the number of significantly expressed genes compared with the total number of genes associated with the canonical pathway
Fig. 2
Fig. 2
Canonical pathways significantly enriched in human monocytes when comparing Nm + IL-10 vs ctr. Significantly enriched canonical pathways were identified with a right-tailed Fisher’s Exact Test that calculates a P-value determining the probability that each canonical pathway associated with the dataset was due to chance alone. The P-values were corrected for multiple testing using the Benjamini-Hochberg method for correcting the FDR. The z-score indicates predicted activation state of the canonical pathway. Blue color or lighter shades of blue indicate a negative z-score and down-regulation of the pathway, and orange color or lighter shades of orange indicate a positive z-score and up-regulation of the pathway. Ratio denotes the number of significantly expressed genes compared with the total number of genes associated with the canonical pathway
Fig. 3
Fig. 3
Canonical pathways significantly enriched in human monocytes stimulated with IL-10 immunodepleted plasma vs low LPS plasma. Significantly enriched canonical pathways were identified with a right-tailed Fisher’s Exact Test that calculates a P-value determining the probability that each canonical pathway associated with the dataset was due to chance alone. The P-values were corrected for multiple testing using the Benjamini-Hochberg method for correcting the FDR. The z-score indicates predicted activation state of the canonical pathway. Blue color or lighter shades of blue indicate a negative z-score and down-regulation of the pathway, and orange color or lighter shades of orange indicate a positive z-score and up-regulation of the pathway. Ratio denotes the number of significantly expressed genes compared with the total number of genes associated with the canonical pathway
Fig. 4
Fig. 4
Canonical pathways significantly enriched in human monocytes stimulated with patient plasma with IL-10 vs low LPS plasma. Significantly enriched canonical pathways were identified with a right-tailed Fisher’s Exact Test, that calculates a P-value determining the probability that each canonical pathway associated to the dataset was due to chance alone. The P-values were corrected for multiple testing using the Benjamini-Hochberg method for correcting the FDR, and a P-value of <0.05 was set as threshold for statistical significance. The z-score indicates predicted activation state of the canonical pathway. Blue color or lighter shades of blue indicate a negative z-score and down-regulation of the pathway, and orange color or lighter shades of orange indicate a positive z-score and up-regulation of the pathway. Ratio denotes the number of significantly expressed genes compared with the total number of genes associated with the canonical pathway
Fig. 5
Fig. 5
Canonical pathways significantly enriched in human monocytes stimulated with Nm + IL-10 vs Nmabc. aSignificantly enriched canonical pathways were identified with a right-tailed Fisher’s Exact Test, that calculates a P-value determining the probability that each canonical pathway associated to the dataset was due to chance alone. The P-values were corrected for multiple testing using the Benjamini-Hochberg method for correcting the FDR. bThe z-score indicates predicted activation state of the canonical pathway. Blue color or lighter shades of blue indicate a negative z-score and down-regulation of the pathway, and orange color or lighter shades of orange indicate a positive z-score and up-regulation of the pathway. cRatio denotes the number of significantly expressed genes compared with the total number of genes associated with the canonical pathway
Fig. 6
Fig. 6
Mitochondrial dysfunction in IPA in human monocytes. a Expression levels when comparing Nm + IL-10 vs Nm. b Expression levels when comparing Nm vs ctr. c Expression levels when comparing Nm + IL-10 vs ctr
Fig. 7
Fig. 7
Mitochondrial dysfunction in IPA before and after immunodepletion of IL-10. a Expression levels when comparing patient plasma with IL-10 vs IL-10 immunodepleted plasma. b Expression levels when comparing patient plasma with IL-10 vs low LPS plasma. c Expression levels when comparing IL-10 immunodepleted plasma vs low LPS plasma

Similar articles

Cited by

References

    1. Singer M, Deutschman CS, Seymour CW, Shankar-Hari M, Annane D, Bauer M, et al. The Third International Consensus Definitions for Sepsis and Septic Shock (Sepsis-3). JAMA. 2016;315(8):801–10. - PMC - PubMed
    1. Kaukonen K-M, Bailey M, Suzuki S, Pilcher D, Bellomo R. Mortality related to severe sepsis and septic shock among critically ill patients in Australia and New Zealand, 2000-2012. JAMA. 2014;311(13):1308–1316. doi: 10.1001/jama.2014.2637. - DOI - PubMed
    1. Stevenson EK, Rubenstein AR, Radin GT, Wiener RS, Walkey AJ. Two decades of mortality trends among patients with severe sepsis: a comparative meta-analysis. Crit Care Med. 2014;42(3):625–631. doi: 10.1097/CCM.0000000000000026. - DOI - PMC - PubMed
    1. Wong HR. Genome-wide expression profiling in pediatric septic shock. Pediatr Res. 2013;73(4 Pt 2):564–569. doi: 10.1038/pr.2013.11. - DOI - PMC - PubMed
    1. Tang BM, Huang SJ, McLean AS. Genome-wide transcription profiling of human sepsis: a systematic review. Crit Care Lond Engl. 2010;14(6):R237. doi: 10.1186/cc9392. - DOI - PMC - PubMed

Publication types

MeSH terms