. 2017 Oct 27;18(1):202.
doi: 10.1186/s13059-017-1331-y.

The human lncRNA LINC-PINT inhibits tumor cell invasion through a highly conserved sequence element

Affiliations

The human lncRNA LINC-PINT inhibits tumor cell invasion through a highly conserved sequence element

Oskar Marín-Béjar et al. Genome Biol. .

Abstract

Background: It is now obvious that the majority of cellular transcripts do not code for proteins, and a significant subset of them are long non-coding RNAs (lncRNAs). Many lncRNAs show aberrant expression in cancer, and some of them have been linked to cell transformation. However, the underlying mechanisms remain poorly understood and it is unknown how the sequences of lncRNA dictate their function.

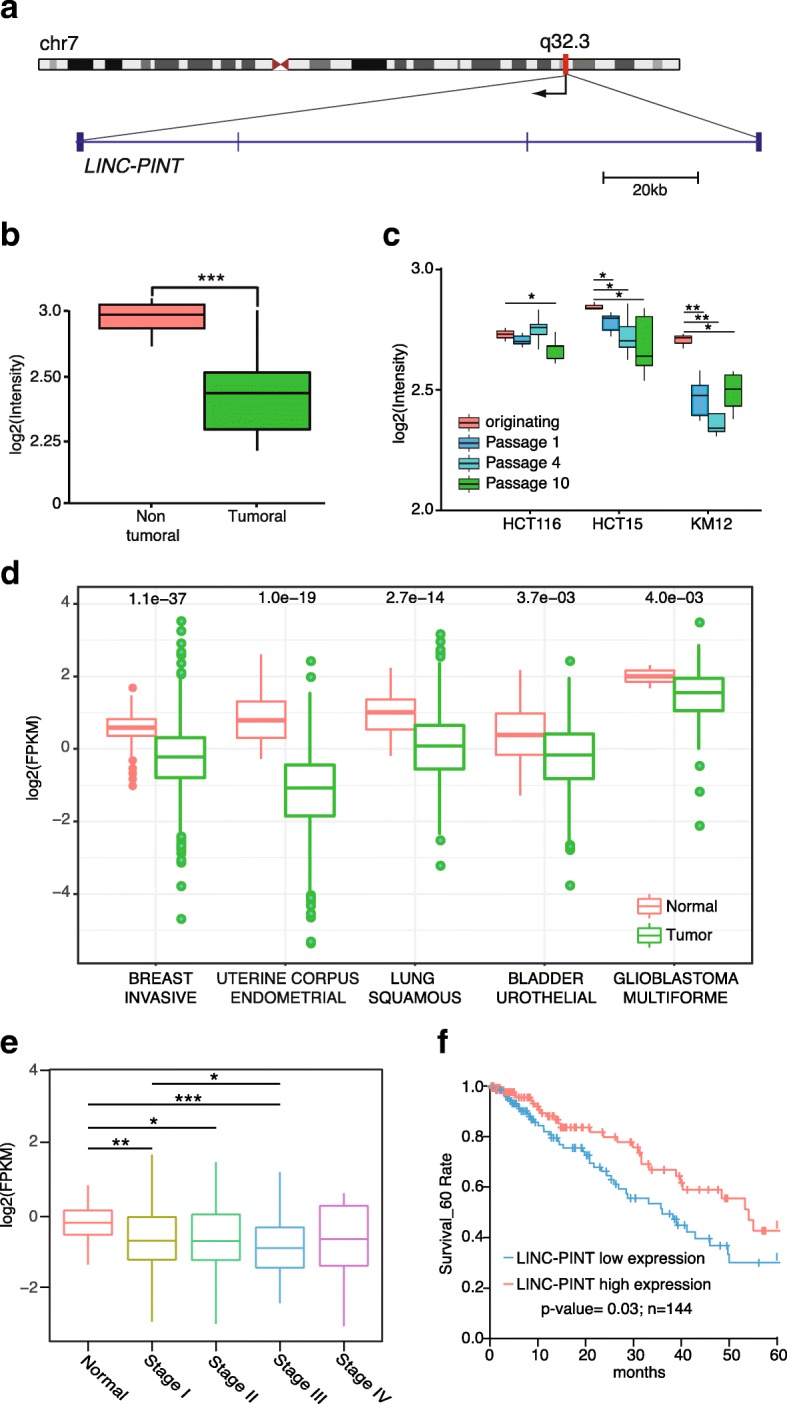
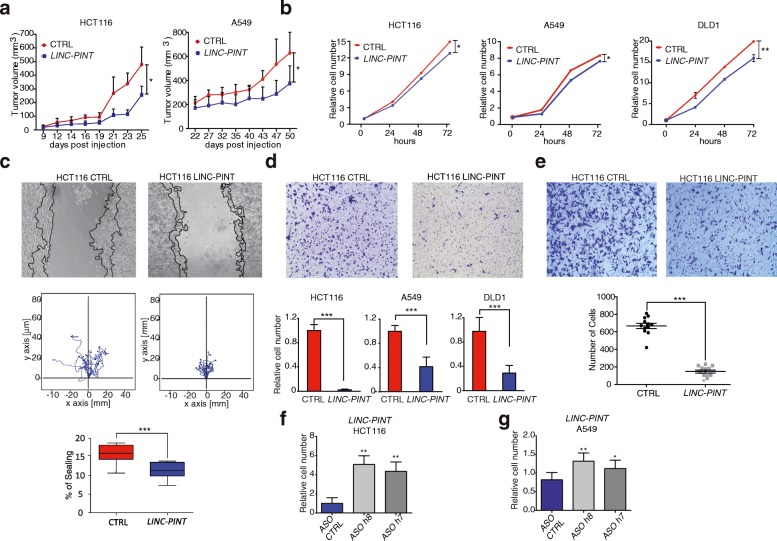
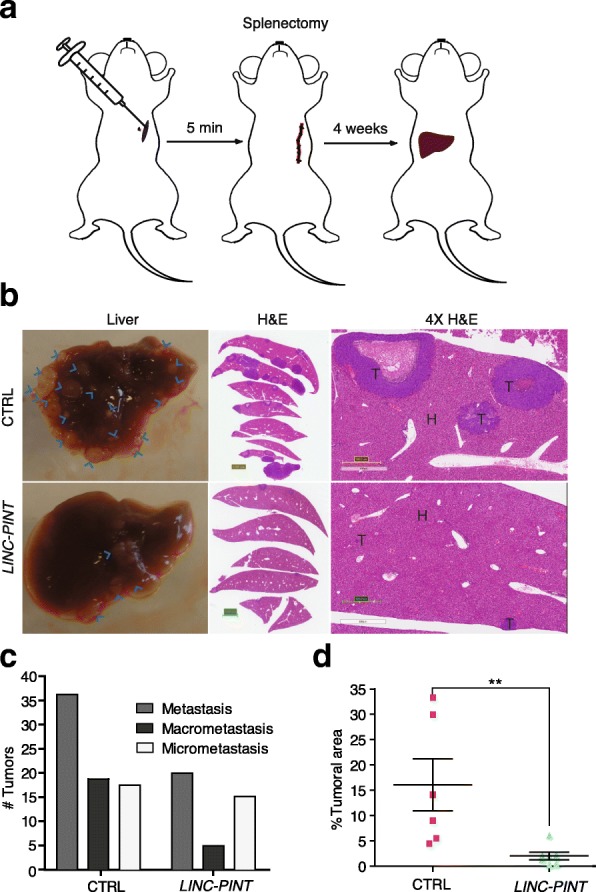
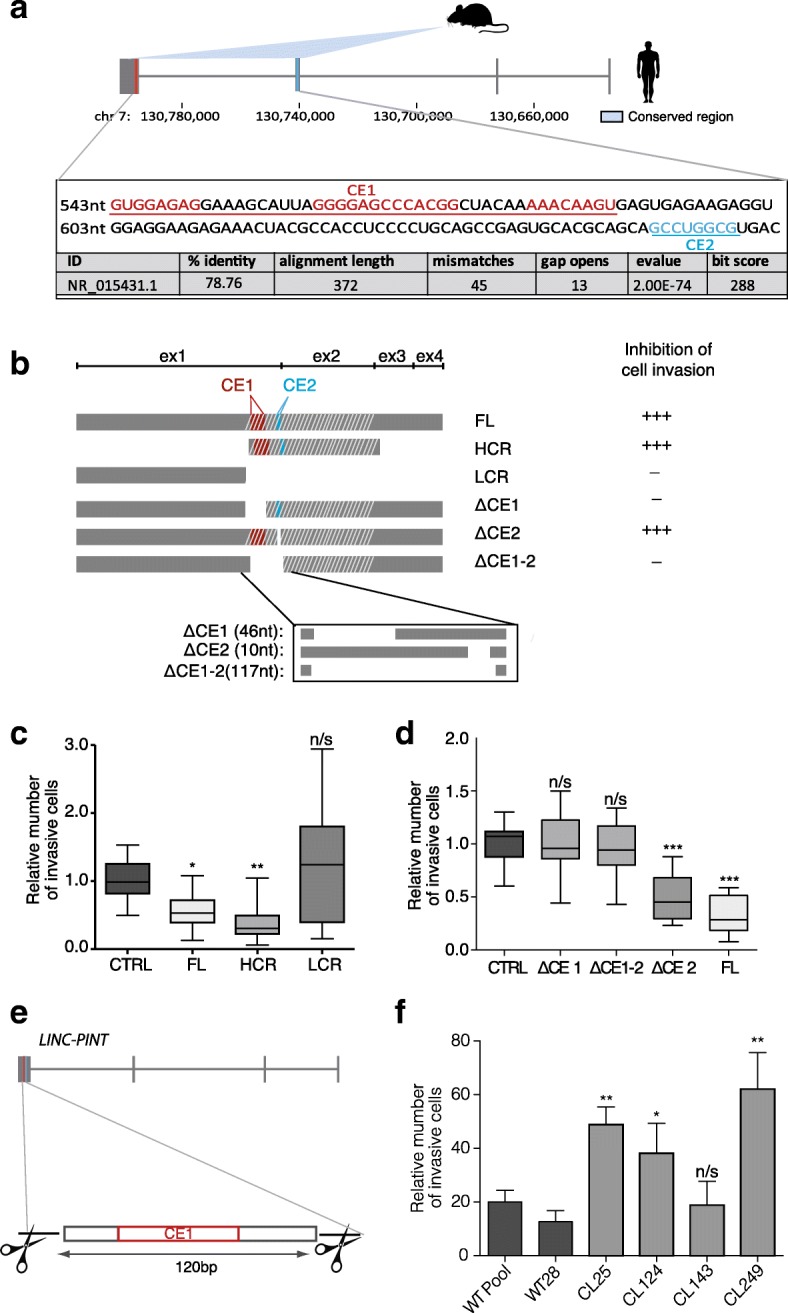
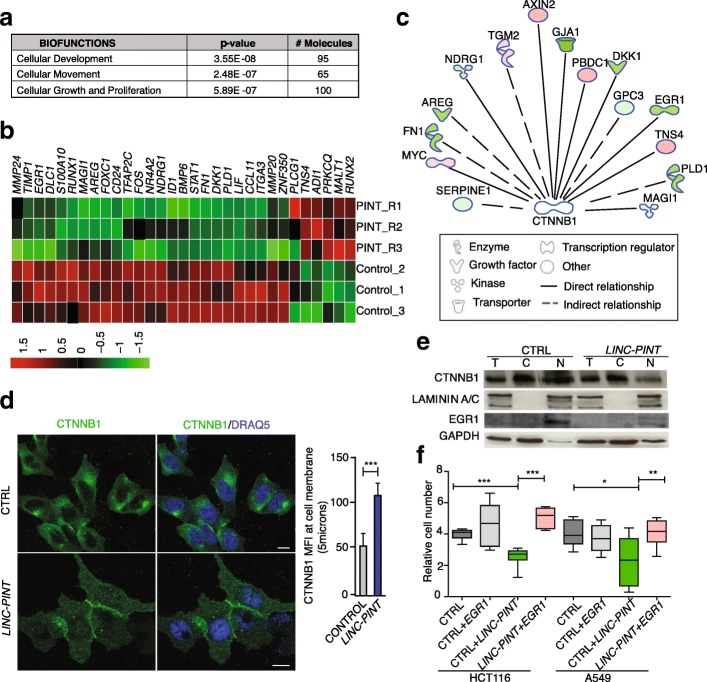
Results: Here we characterize the function of the p53-regulated human lncRNA LINC-PINT in cancer. We find that LINC-PINT is downregulated in multiple types of cancer and acts as a tumor suppressor lncRNA by reducing the invasive phenotype of cancer cells. A cross-species analysis identifies a highly conserved sequence element in LINC-PINT that is essential for its function. This sequence mediates a specific interaction with PRC2, necessary for the LINC-PINT-dependent repression of a pro-invasion signature of genes regulated by the transcription factor EGR1.

Conclusions: Our findings support a conserved functional co-dependence between LINC-PINT and PRC2 and lead us to propose a new mechanism where the lncRNA regulates the availability of free PRC2 at the proximity of co-regulated genomic loci.

Keywords: Cancer; Cell invasion; Epigenetic regulation; LncRNA; PRC2.


Conflict of interest statement

Competing interests

None of the authors have any competing interests.

Publisher’s Note

Springer Nature remains neutral with regard to jurisdictional claims in published maps and institutional affiliations.

Figures

Fig. 1
Fig. 1
LINC-PINT is downregulated in cancer and it correlates negatively with malignancy. a Schematic representation of LINC-PINT (MKLN1-AS1 or LOC378805, FLJ43663 transcript variant 1). b LINC-PINT expression in colorectal (CRC) (n = 30) and normal tissue samples (n = 4). Data are obtained from GSE35602. c LINC-PINT expression in a collection of xenograft models at in vivo passages 1, 4, and 10 (P1, P4, and P10) along with originating cell lines (P0) GSE48433. d LINC-PINT expression across cancer types in non-tumoral and tumoral tissues analyzed by RNA-seq from TCGA. P values were calculated using Wilcoxon signed rank test. e LINC-PINT levels in lung adenocarcinoma tumor samples of different stages (TCGA). f Kaplan–Meier analyses of the correlations between LINC-PINT expression level and overall survival of 144 patients with lung adenocarcinoma (TCGA). Data are shown as mean ± SD
Fig. 2
Fig. 2
LINC-PINT overexpression inhibits the migration and invasion capability of lung and colon cancer cells. a Xenograft growth in nude mice injected with HCT116 CTRL cells (n = 6) or LINC-PINT overexpressing HCT116 cells (n = 6). Mean and standard deviation is shown. *P value < 0.05 determined by Student’s t-test. b Relative numbers at indicated times of control cells (transduced with empty vector) or cells expressing LINC-PINT. c Wound healing assay of control and LINC-PINT overexpressing HCT116 cells. Representative image of the invaded area as captured 12 h after the scratch (black lines depict the invasive front at 0 and 12 h, respectively) (upper panel). Medium plots represent single-cell tracks taken every 5 min for 12 h to ten different cells. d Invasion capacity of 105 HCT116, A549, DLD1 CTRL cells and their equivalent LINC-PINT overexpressing cells analyzed using transwell chambers coated with Matrigel at 36 h. The number of invading cells is counted from images of five random fields per transwell. Data are shown as mean ± SD of the fold change of invading cells relative to control cell line of three independent biological replicates. e Cell transmigration across collagen-coated membranes. Control HCT116 and LINC-PINT overexpressing cells were allowed to migrate across collagen-coated wells for 24 h. Total number of cells in the lower side of the membrane was counted on images taken from five random fields per transwell. Data are represented as mean ± SD of migrating cells from three independent biological replicates. f, g HCT116 and A549 LINC-PINT cells were transfected with two independent antisense oligos (ASO) to knockdown LINC-PINT (ASO h5 and ASO h7), or a control ASO, and their invasion capacity was quantified as in (d)
Fig. 3
Fig. 3
Enforced expression of LINC-PINT decreases metastasis initiation of CRC cells. ad Intrasplenic mice inoculation with 2.5 × 105 HCT116 control cells (CTRL) (n = 6) or LINC-PINT overexpressing HCT116 cells (LINC-PINT) (n = 6). a Schematic representation of liver metastasis mice model induced by intrasplenic injection of colon cancer cells. b Representative pictures of liver metastases (blue arrows) at time of sacrifice (left), hematoxylin and eosin (H&E)-stained sections scanned on an Aperio Scan Scope AT (middle) and 4X magnifications of H&E slides; healthy and tumoral tissue is pointed out with (H) and (T), respectively. c Quantification of number of liver metastasis, micrometastases ≤ 2 mm and macrometastases ≥ 2 mm. d Graphic representation of percentage of tumoral area per mice liver quantified on Aperio Image Scope (Leica Biosystems, Buffalo Grove, IL, USA) (*P < 0.05, P < 0.01 two-tailed Student’s t-test)
Fig. 4
Fig. 4
A highly conserved short region of LINC-PINT is required for its function. a Schematic representation of alignment signatures found for mouse Lincpint and the orthologus human LINC-PINT using slncky Evolution Browser [10]; the conserved region between mouse and human is emphasized and the conserved sequences between mammals [12] are underlined in red (CE1) and blue (CE2). Conservation values of BLAST are summarized in the bottom table. b Schematic representation of FL LINC-PINT clone and the LINC-PINT mutants; HCR, LCR, CE1 deletion (ΔCE1), CE2 deletion (ΔCE2), and CE1-2 deletion (ΔCE1-2) (left), and the invasion phenotype observed upon their expression. c, d Invasion assay performed as in Fig. 2d in HCT116 cells expressing the indicated forms of LINC-PINT or an empty vector (CTRL). e Schematic of LINC-PINT fragment deletion by CRISPR-Cas9. f Invasion phenotype of HCT116 cellular clones with homozygous deletion of CE1 sequence (CL25, CL124, CL143, and CL249) or normal cells (WT pool and WT28). Significance was determined by Mann–Whitney U test (*P < 0.05, **P < 0.01)
Fig. 5
Fig. 5
LINC-PINT represses the expression of an invasion signature and induces CTNNB1 translocation. a Biological functions associated with genes differentially expressed upon LINC-PINT overexpression in HCT116 cells. b Heatmap representation of genes differentially expressed (DE) in HCT116 overexpressing LINC-PINT vs. HCT116 CTRL cells, involved in tumor cell adhesion, as defined by IPA (green, downregulation; red, upregulation). c Connection between CTNNB1 and genes regulated by LINC-PINT involved in cell movement and proliferation as predicted by IPA. d Immunoflorescence images of CTNNB1 (green) and DRAQ5 (blue, nuclear specific marker) in control cells (CTRL) and LINC-PINT overexpressing HCT116 cells (LINC-PINT). Scale bars: 20 μm (left). The fluorescence intensities of CTNNB1 are quantified by tracing a scanning line of 5 μm across the plasma membrane of the cell (right). e Subcellular fractionation and western blot analysis performed in HCT116. Three different fractions are loaded; total cell fraction (T), cytoplasmic fraction (C), and nuclear fraction (N) and probed for CTNNB1 and EGR1. GAPDH was used as cytoplasmic marker and LAMININ A/C as nuclear marker. f EGR1 overexpression restores invasive capacity of LINC-PINT overexpressing A549 and HCT116. Cells were either transduced with an empty vector (CTRL) or with LIC-PINT (LINC-PINT) and then transiently transfected to overexpress EGR1 (CTRL + EGR1 or LINC-PINT + EGR1). Data are from three biological replicates represented as mean ± SD of the fold change of invading cells. Significance was determined by one tail t-test (*P < 0.05, **P < 0.01, ***P < 0.001)
Fig. 6
Fig. 6
PRC2 mediates LINC-PINT-dependent silencing of invasion genes. a Level of enrichment in SUZ12 immunoprecipitates of the indicated coding and non-coding RNAs in HCT116 cells. IgG is used as control. b EZH2 and SUZ12 proteins bound to LINC-PINT or antisense RNA (control RNA) when incubated with nuclear extracts. An unspecific cross-reacting protein is shown as control. c Expression changes of genes in LINC-PINT overexpressing HCT116 cells upon EZH2 depletion by shRNA. d, e SUZ12 (d) or H3K27me3 (e) enrichment in promoter regions of LINC-PINT-regulated genes in control or LINC-PINT HCT116 cells. Enrichment values are relative to the input. Mean ± SD of three qPCR replicates of a representative experiment are shown. f FA crosslinking and immunoprecipitation (fRIP) of SUZ12-bound LINC-PINT in HCT116. qRT-PCR identifies the LINC-PINT region bound by PRC2 in vivo. The scheme represents the location of the oligos along LINC-PINT transcript; E exon, I intron. g RNAs corresponding to FL or different fragments of LINC-PINT or its antisense sequence (AS-FL) were obtained by in vitro transcription. Their interaction with recombinant purified PRC2 was tested by RNA pull-down and SUZ12 and EZH2 was detected by western blot

References

    1. Maurano MT, Humbert R, Rynes E, Thurman RE, Haugen E, Wang H, Reynolds AP, Sandstrom R, Qu H, Brody J, et al. Systematic localization of common disease-associated variation in regulatory DNA. Science. 2012;337:1190–1195. doi: 10.1126/science.1222794. - DOI - PMC - PubMed
    1. Djebali S, Davis CA, Merkel A, Dobin A, Lassmann T, Mortazavi A, Tanzer A, Lagarde J, Lin W, Schlesinger F, et al. Landscape of transcription in human cells. Nature. 2012;489:101–108. doi: 10.1038/nature11233. - DOI - PMC - PubMed
    1. Rinn JL, Chang HY. Genome regulation by long noncoding RNAs. Annu Rev Biochem. 2012;81:145–166. doi: 10.1146/annurev-biochem-051410-092902. - DOI - PMC - PubMed
    1. Engreitz JM, Ollikainen N, Guttman M. Long non-coding RNAs: spatial amplifiers that control nuclear structure and gene expression. Nat Rev Mol Cell Biol. 2016;17:756–770. doi: 10.1038/nrm.2016.126. - DOI - PubMed
    1. Gutschner T, Diederichs S. The hallmarks of cancer: a long non-coding RNA point of view. RNA Biol. 2012;9:703–719. doi: 10.4161/rna.20481. - DOI - PMC - PubMed

Publication types

Substances