. 2018 Apr 15:621:939-947.
doi: 10.1016/j.scitotenv.2017.10.154. Epub 2017 Nov 1.

Analysis of airborne microbial communities using 16S ribosomal RNA: Potential bias due to air sampling stress

Affiliations

Analysis of airborne microbial communities using 16S ribosomal RNA: Potential bias due to air sampling stress

Huajun Zhen et al. Sci Total Environ. .

Abstract

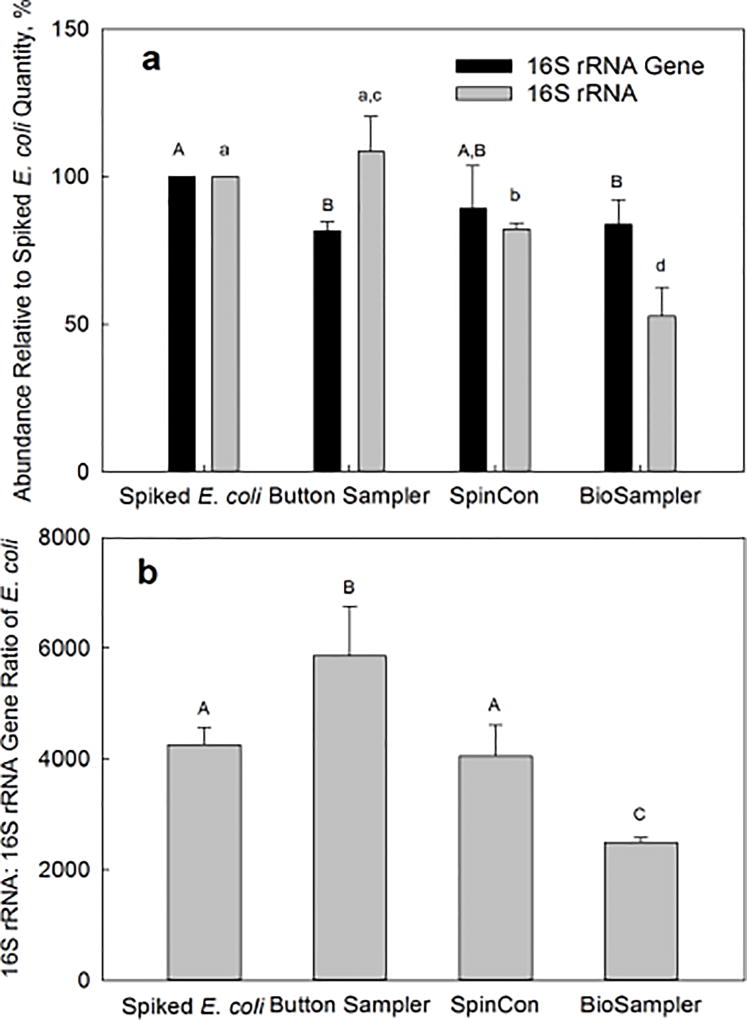
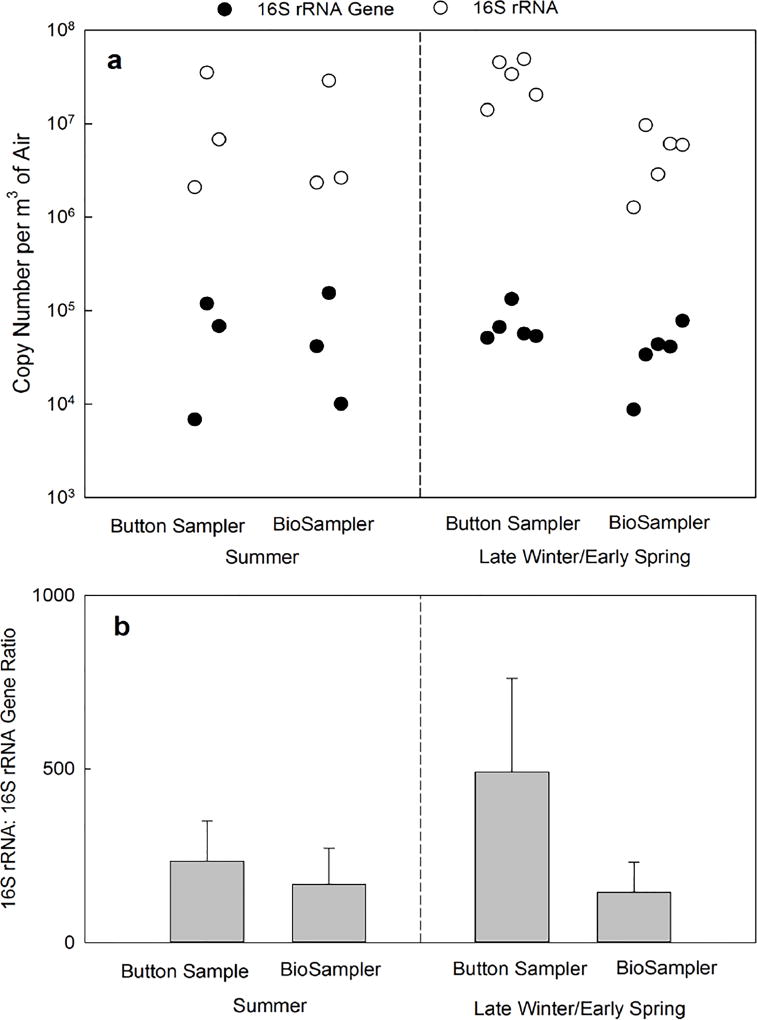
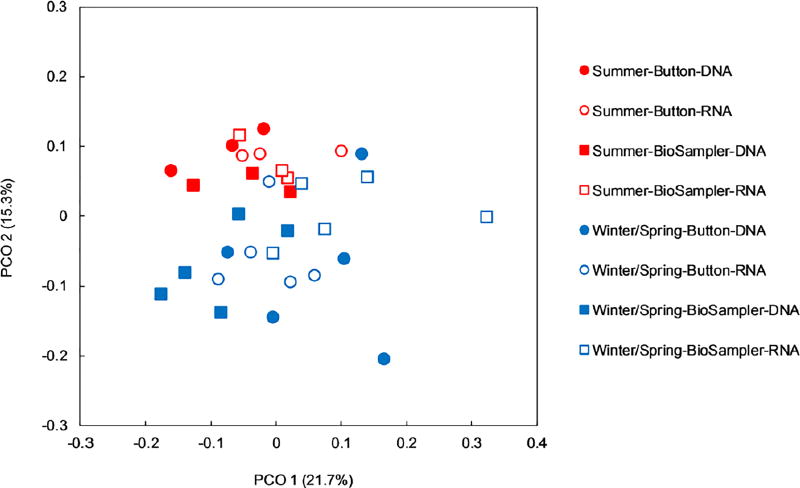
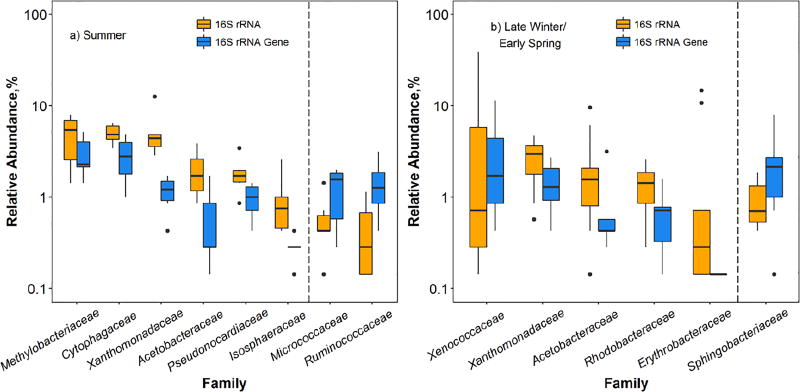
A limited number of studies have been conducted to analyze ribosomal RNA (rRNA, present in the ribosome) in bioaerosol samples to identify currently or potentially active airborne microbes, although its genomic counterpart, the rRNA gene (on the chromosome) has been frequently targeted for airborne microbial community analysis. A knowledge gap still exists regarding whether the bioaerosol rRNA abundances are affected by the bioaerosol collection process. We investigated the effect of air sampling stress on the measurement and characterization of 16S rRNA for bioaerosols in the laboratory and field experiments using quantitative polymerase chain reaction (qPCR) and high-throughput sequencing techniques. In a laboratory study, known quantities of freshly grown Escherichia coli cells were spiked onto the filter of a Button Aerosol Sampler and into liquids of BioSampler and SpinCon air samplers and then exposed to sampling stress when the samplers were operated for 2h. We found that the recovered cellular 16S rRNA abundance as determined by qPCR was dependent on sampler type. Further, two devices (Button Aerosol Sampler and BioSampler) that exhibited markedly different efficiency in preserving 16S rRNA were employed in an outdoor environment to collect bioaerosols simultaneously on eight days in two different seasons. The abundance of 16S rRNA in the outdoor air sample (1.3×10⁶-4.9×10⁷copies/m3) was about two orders of magnitude higher than that of 16S rRNA gene (6.9×10³-1.5×10⁵copies/m3). The 16S rRNA sequences revealed a different bacterial community compared with 16S rRNA gene-based results across all samples, and this difference depended on the sampling device. In addition, a number of bacterial taxa exhibited higher abundance in the 16S rRNA gene sequences than in 16S rRNA sequences, which suggests the potential activities of certain microbes in airborne phase. Overall, this study highlights the importance of sampling device selection when analyzing RNA in bioaerosols.

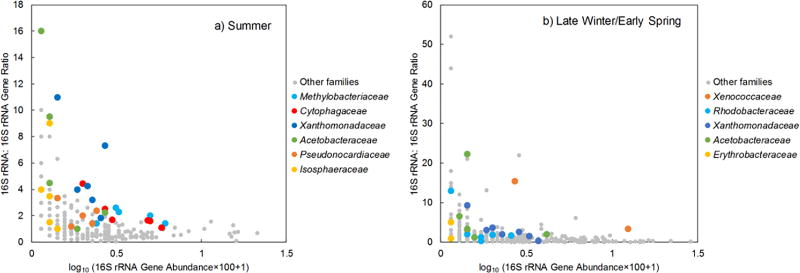
Keywords: 16S rRNA sequencing; Bioaerosols; Microbial community; Sampling device; Stress; rRNA:rDNA ratio.


Figures

Figure 1
Figure 1
The effect of sampling device on the 16S rRNA:16S rRNA gene ratio for E. coli cells spiked into the three samplers (Button sampler, SpinCon sampler, and BioSampler) and recovered after two hours of active sampling of particle-free air. Each bar group (or bar) from left to right shows the average for 10, 4, 3 and 3 samples respectively; error bars are one standard deviation. Bars with different capital letters (A or B) or small letters (a, b, c or d) are statistically different (Fisher’s LSD, p<0.05). a) The abundance of 16S rRNA gene and 16S rRNA recovered from each sampler compared to an initially spiked reference quantity of 16S rRNA gene or 16S rRNA. b) The 16S rRNA:16S rRNA gene ratio of E. coli cells spiked into three samplers and recovered after two hours of active air sampling of particle-free air compared with the ratio of initially spiked E. coli cells.
Figure 2
Figure 2
a) The abundance of bacterial 16S rRNA gene (closed circle) and 16S rRNA (open circle) in air samples collected by Button sampler and BioSampler simultaneously in an outdoor environment for two hours on three different days in summer (left) and five different days in late winter/early spring (right). The paired 16S rRNA gene and 16S rRNA data points are aligned vertically and positioned on the x-axis in order of sampling date. b) The 16S rRNA:16S rRNA gene ratio of bioaerosol samples collected by Button sampler and BioSampler simultaneously in an outdoor environment for two hours on three different days in summer (left) and five different days in late winter/early spring (right). The bars are averages and error bars show one standard deviation.
Figure 3
Figure 3
Weighted UniFrac-based bacterial diversity principal coordinate analysis of outdoor air samples collected by two devices (Button sampler: round markers; BioSampler: square markers) in two seasons (summer: red markers; late winter/early spring: blue markers) and analyzed based on 16S rRNA gene (DNA, filled markers) and 16S rRNA sequences (RNA, open markers).
Figure 4
Figure 4
Bacterial genera that exhibited different relative abundances (p<0.05) in 16S rRNA and 16S rRNA gene sequences of outdoor bioaerosols collected in two seasons. Each boxplot represents the results of six samples collected in a) summer and ten samples collected in b) late winter/early spring. To the left of the dashed line: bacteria genera showing higher relative abundance in 16S rRNA sequences than in 16S rRNA gene sequences; to the right of the dashed line: bacteria genera exhibiting lower relative abundance in 16S rRNA sequences than in 16S rRNA gene sequences. In each boxplot, the line through the middle represents the median. The bottom and top of each box are the 25th and 75th percentiles. Outliers are indicated with points beyond the whiskers and are defined as the data points lower (or higher) than 1.5 interquartile (the difference between the upper and lower quartiles) range of the lower (or higher) quartile.
Figure 5
Figure 5
The relationship between 16S rRNA:16S rRNA gene ratio and relative abundance of 16S rRNA gene in a) summer and b) late winter/early spring air samples collected in an outdoor environment. Each point represents individual bacterial family detected in one sample. Colored points represent those bacterial families that exhibited significantly higher relative abundances of 16S rRNA than 16S rRNA gene.

Similar articles

Cited by

References

    1. Woese CR. Bacterial evolution. Microbiol. Rev. 1987;51:221–271. - PMC - PubMed
    1. Van de Peer Y, Chapelle S, De Wachter R. A quantitative map of nucleotide substitution rates in bacterial rRNA. Nucleic Acids Res. 1996;24:3381–3391. - PMC - PubMed
    1. Keer JT, Birch L. Molecular methods for the assessment of bacterial viability. J. Microbiol. Methods. 2003;53:175–183. - PubMed
    1. Josephson KL, Gerba CP, Pepper IL. Polymerase chain reaction detection of nonviable bacterial pathogens. Appl. Environ. Microbiol. 1993;59:3513–3515. - PMC - PubMed
    1. England LS, Holmes SB, Trevors JT. Persistence of viruses and DNA in soil. World Journal of Microbiology & Biotechnology. 1998;14(2):163–169.

LinkOut - more resources