Comparative Study
. 2017 Dec 15;292(50):20756-20768.
doi: 10.1074/jbc.M117.790519. Epub 2017 Oct 27.

A pivotal role for a conserved bulky residue at the α1-helix of the αI integrin domain in ligand binding

Affiliations
Comparative Study

A pivotal role for a conserved bulky residue at the α1-helix of the αI integrin domain in ligand binding

Zhengli Wang et al. J Biol Chem. .

Abstract

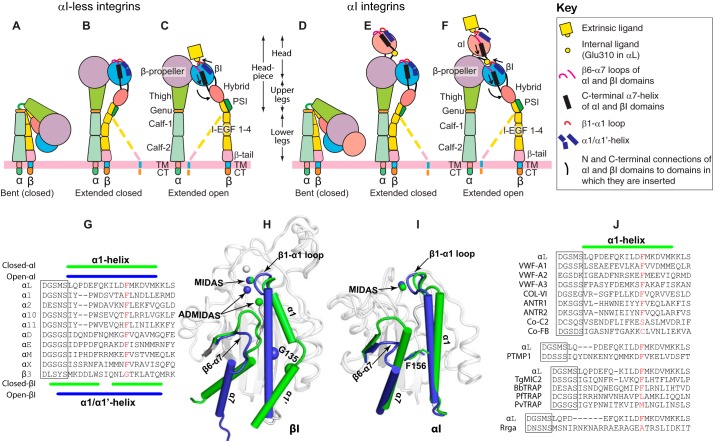
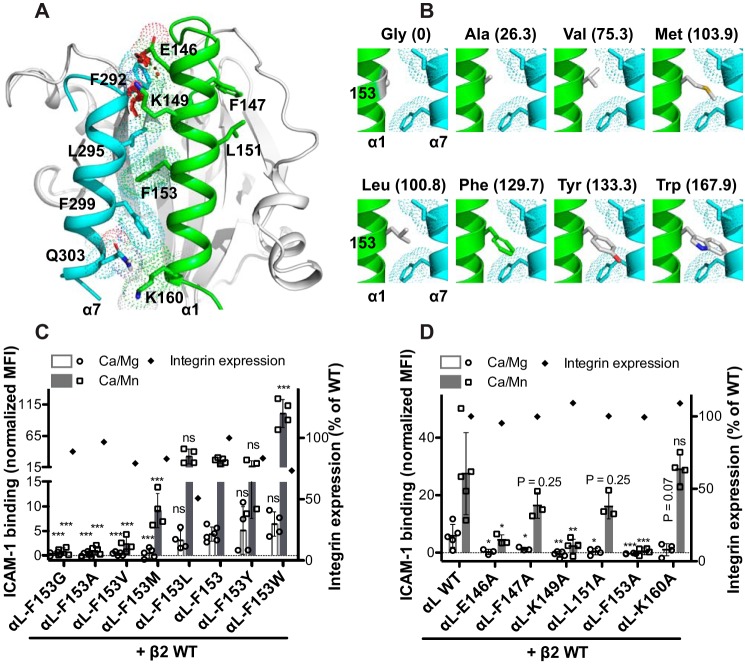
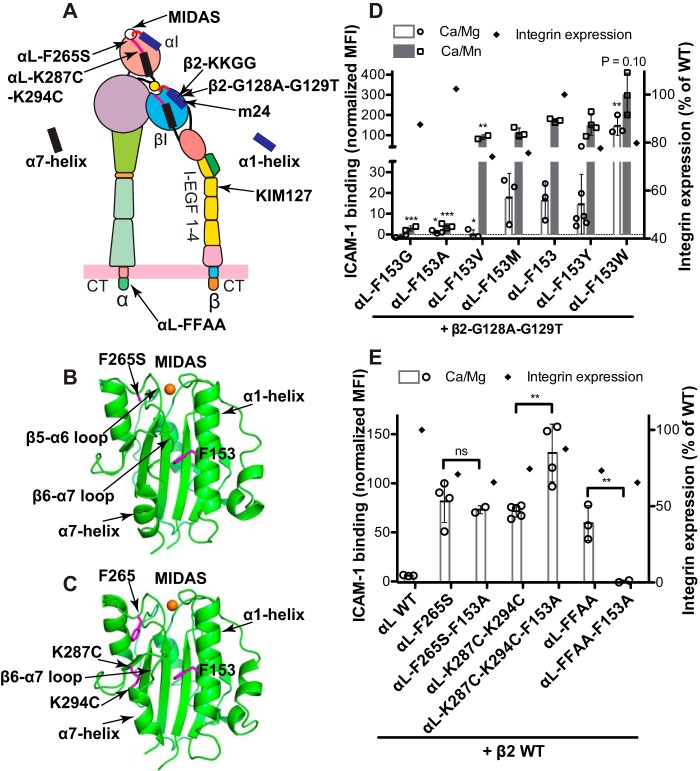
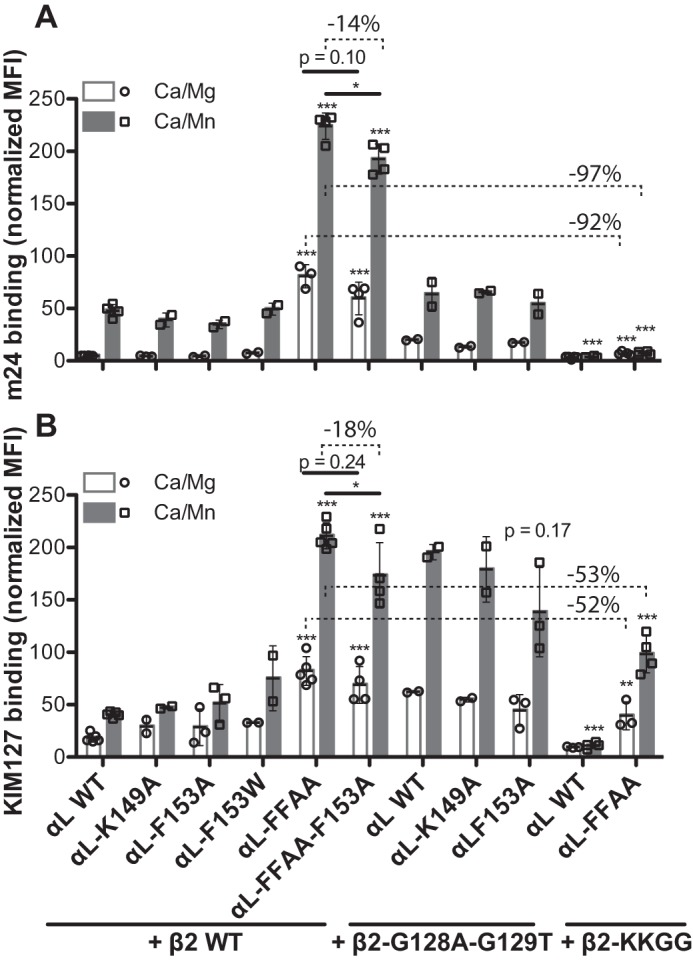
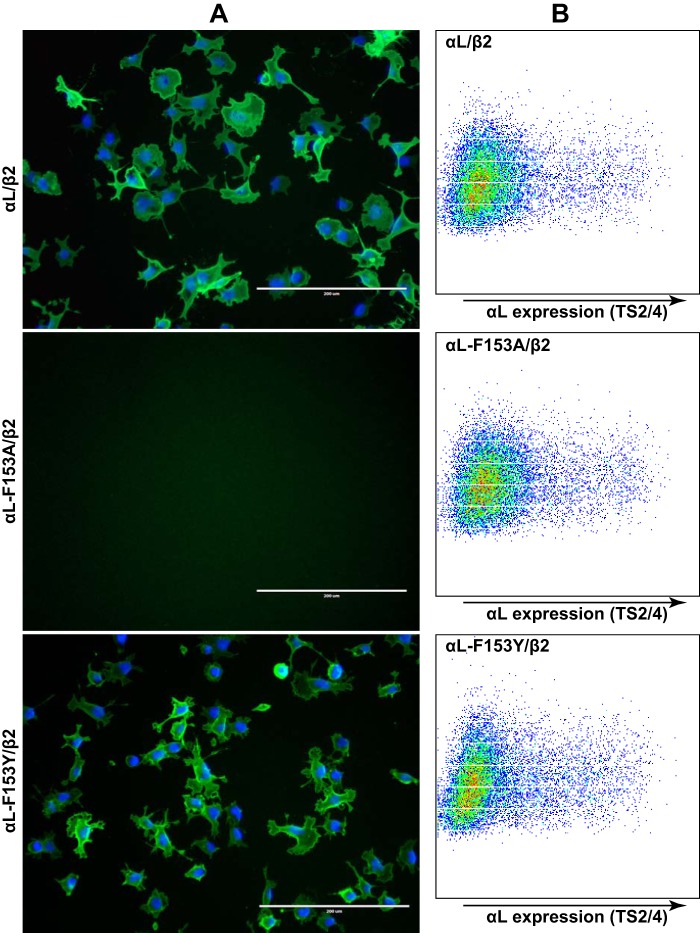
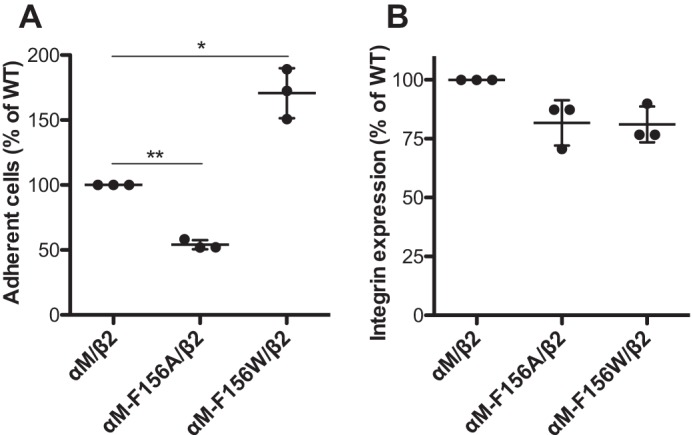
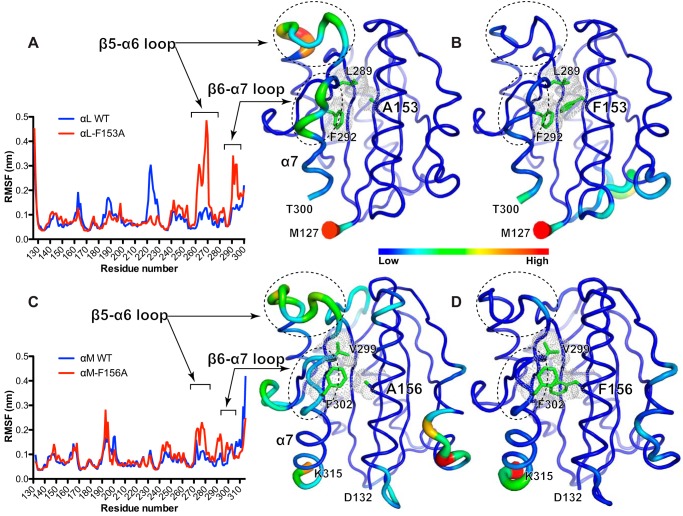
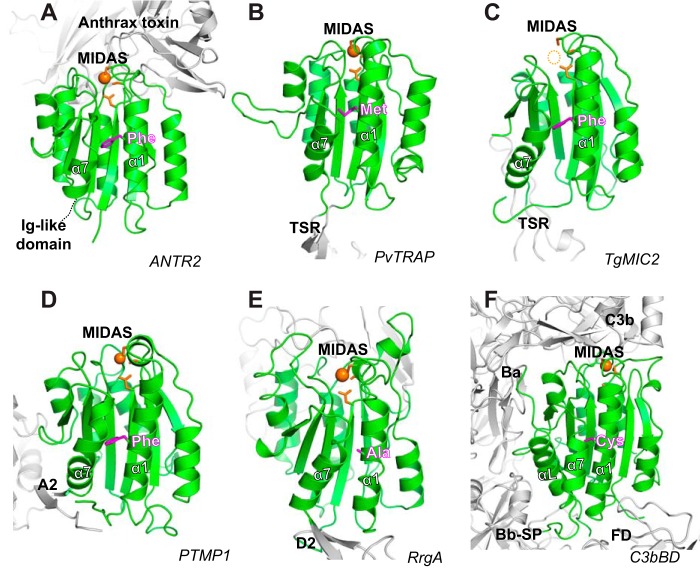
The ligand-binding βI and αI domains of integrin are the best-studied von Willebrand factor A domains undergoing significant conformational changes for affinity regulation. In both βI and αI domains, the α1- and α7-helixes work in concert to shift the metal-ion-dependent adhesion site between the resting and active states. An absolutely conserved Gly in the middle of the α1-helix of βI helps maintain the resting βI conformation, whereas the homologous position in the αI α1-helix contains a conserved Phe. A functional role of this Phe is structurally unpredictable. Using αLβ2 integrin as a model, we found that the residue volume at the Phe position in the α1-helix is critical for αLβ2 activation because trimming the Phe by small amino acid substitutions abolished αLβ2 binding with soluble and immobilized intercellular cell adhesion molecule 1. Similar results were obtained for αMβ2 integrin. Our experimental and molecular dynamics simulation data suggested that the bulky Phe acts as a pawl that stabilizes the downward ratchet-like movement of β6-α7 loop and α7-helix, required for high-affinity ligand binding. This mechanism may apply to other von Willebrand factor A domains undergoing large conformational changes. We further demonstrated that the conformational cross-talk between αL αI and β2 βI could be uncoupled because the β2 extension and headpiece opening could occur independently of the αI activation. Reciprocally, the αI activation does not inevitably lead to the conformational changes of the β2 subunit. Such loose linkage between the αI and βI is attributed to the αI flexibility and could accommodate the αLβ2-mediated rolling adhesion of leukocytes.

Keywords: VWA domain; cell adhesion; cell migration; integrin; leukocyte; von Willebrand factor.


Conflict of interest statement

The authors declare that they have no conflicts of interest with the contents of this article

Figures

Figure 1.
Figure 1.
Integrin domain organization and the allosteric signal relay in the global and local conformational changes. A–C, the three major conformational states of integrins without the αI domain. D–F, the three major conformational states of integrins with an αI domain inserted into the β-propeller domain of α subunit. The local conformational changes of the α1-helix, α7-helix, and the β subunit hybrid domain were indicated by arrows. Potential intermediate conformations of β subunit are shown as dashed lines. G, sequence alignment of the α1-helixes of the αI domains. The α1/α1′-helix sequence of the β3 integrin βI domain was shown for comparison. H, structure comparison of the β3 βI domain in the closed (PDB code 3T3P) and open conformations (PDB code 2VDR). I, structure comparison of the αM αI domain in the closed (PDB code 1JLM) and open conformations (PDB code 1IDO). The closed and open conformations of α1/α1′-helix and α7-helix are shown in green and blue, respectively. Metal ions of the MIDAS and ADMIDAS are shown as spheres. β3-Gly-135 is shown as a Cα sphere. The αM-Phe-156, equivalent to αL-Phe-153, is shown as sticks. J, structure-based sequence alignment of the α1-helix from the selected VWA domains. The DXSXS motifs of the MIDAS are boxed. Residues that are equivalent to αL-Phe-153 are shown in red.
Figure 2.
Figure 2.
Effect of mutations in the α1-helix of αI domain on αLβ2 ligand binding. A, conformations of the α1-helix and α7-helix of αL αI domain. The crystal structures of the αL αI domain in the closed (PDB code 1ZOP) and the open (PDB code 1MQA) conformations are superimposed, and the conformations of α1-helix in the open state (in green) and α7-helix in the closed state (in cyan) are shown. The residues at the interface of α1-helix and α7-helix are shown as sticks with dotted surfaces. The van der Waals overlaps (steric clashes) between the interfacial residues are indicated as red disks. B, structural comparison of the amino acids used for the substitution of αL-Phe-153. The αL-Phe-153 was mutated in silico using PyMOL. The rotamers that have minimal or no steric clashes with their surroundings were selected. The volumes (Å3) of amino acid side chains occupying in protein interiors are shown in parentheses (66). C and D, ICAM-1 binding of HEK293FT cells transfected with β2 WT and αL containing indicated α1-helix mutations. The ICAM-1 binding was measured by flow cytometry in the presence of 1 mm Ca2+/Mg2+ (Ca/Mg) or 0.2 mm Ca2+ plus 2 mm Mn2+ (Ca/Mn) and presented as the MFI normalized to integrin expression. The data are means ± S.D. (n ≥ 3). Two-tailed t tests were used to compare the wild type and the mutants in the same conditions. *, p < 0.05; **, p < 0.01; ***, p < 0.001; ns, p > 0.05. Only the mean values are shown for the integrin expression.
Figure 3.
Figure 3.
The combined effect of the αL-Phe-153 mutations and the active αL or β2 mutations on αLβ2 ligand binding. A, model of αLβ2 integrin at the extended open headpiece conformation. The locations of the indicated mutations and the epitopes of mAbs m24 and KIM127 are shown. B, crystal structure of the αL αI domain with the active F265S mutation (PDB code 3TCX). C, crystal structure of the αL αI domain with the K287C and K294C mutations (PDB code 1T0P). The MIDAS Mg2+ ions are shown as orange spheres. The side chains of selected residues are shown as sticks. D, ICAM-1 binding of the HEK293FT cells transfected with the indicated αL-Phe-153 mutants and the active β2-G128A/G129T mutant. E, ICAM-1 binding of the HEK293FT cells transfected with β2 wild type and the αL subunits having the αL-F153A mutation combined with the active αL-F265S, αL-K287C/K294C or αL-FFAA mutation. The ICAM-1 binding was measured by flow cytometry in the presence of 1 mm Ca2+/Mg2+ (Ca/Mg) or 0.2 mm Ca2+ plus 2 mm Mn2+ (Ca/Mn) and presented as the MFI normalized to integrin expression. The data are means ± S.D. (n ≥ 3; for αl-F153G, n = 2). Two-tailed t tests were used to compare the wild type and the mutants in the same conditions or as indicated. *, p < 0.05; **, p < 0.01; ***, p < 0.001; ns, p > 0.05. Only the mean values are shown for the integrin expression.
Figure 4.
Figure 4.
Effect of the αI α1-helix mutations on αLβ2 conformational change. HEK293FT cells were transfected with the indicated combination of αL and β2 constructs. The cells were incubated with mAb m24 (A) that reports αLβ2 headpiece opening or KIM127 (B) that reports αLβ2 extension in the presence of 1 mm Ca2+/Mg2+ (Ca/Mg) or 0.2 mm Ca2+ plus 2 mm Mn2+ (Ca/Mn). The mAb binding was measured by flow cytometry and presented as the MFI normalized to αLβ2 expression measured by TS2/4 binding. The data are means ± S.D. (n ≥ 3; except for αl-K149A and αl-F153W, n = 2). Two-tailed t tests were used to compare the wild type and the mutants in the same conditions or as indicated. *, p < 0.05; **, p < 0.01; ***, p < 0.001. The numbers of percentages indicate the decreased levels of mAb binding.
Figure 5.
Figure 5.
Effect of αL-Phe-153 mutations on αLβ2-mediated cell adhesion and spreading. A, HEK293FT cells transfected with the indicated integrin αLβ2 constructs were seeded onto the plates coated with human ICAM-1-Fc (5 μg/ml coating concentration) at 37 °C for 1 h. The cells were fixed and immunostained with anti-αL mAb TS2/4 shown in green. The nuclei were stained with DAPI. Scale bar, 200 μm. B, flow cytometry plots showing integrin αLβ2 expression reported by mAb TS2/4 in the corresponding HEK293FT transfectants used in A. One representative experiment of more than three repeats is shown.
Figure 6.
Figure 6.
Effect of the αM-Phe-156 mutations on αMβ2-mediated cell adhesion. A, cell adhesion on immobilized human fibrinogen. HEK293FT cells transfected with indicated αMβ2 constructs and EGFP were washed with HEPES buffer and then seeded onto the 12-well cell culture plate that was precoated with 3 mg/ml human fibrinogen. The cells were incubated in the presence of 0.2 mm Ca2+ plus 2 mm Mn2+ at 37 °C for 1 h before washing and fixation. More than 20 images were randomly taken for each sample. The number of EGFP-positive adherent cells was counted for each image and averaged. The cell numbers were normalized to the wild-type level for each independent experiment. B, cell surface expression of αMβ2 in the same HEK293FT transfectants used for the cell adhesion assay in A. The cells were stained with APC-labeled anti-αM mAb ICRF44, and the mAb binding was measured by flow cytometry. The EGFP-positive cells were acquired for calculating the MFI of APC-ICRF44. The data are presented as percentages of the MFI of αMβ2 wild type. The data are means ± S.D. (n = 3). Two-tailed t tests were used to compare the wild type and the mutants. *, p < 0.05; **, p < 0.01.
Figure 7.
Figure 7.
Molecular dynamics simulations of the αL and αM αI domains. A, RMSF of the Cα positions in a 60-ns MD simulation of the αI domain of αL WT or αL-F153A mutant in the open conformation. B, cartoon models of the open αL αI domains with Ala-153 and Phe-153. C, RMSF of the Cα positions in a 100-ns MD simulation of the αI domain of αM WT or αM-F156A mutant in the open conformation. D, cartoon models of the open αM αI domains with Ala-156 and Phe-156. To indicate the fluctuations of the Cα atoms, the RMSF values in the plots were converted to B-factor values and shown in the cartoon models with the Cα color and cartoon putty scaled based on the B-factors. The regions of interest are circled in the cartoons and indicated in the RMSF plots. The residues of interest are shown as green sticks with the dots representing van der Waals surface.
Figure 8.
Figure 8.
Representative VWA structures. A–F, the crystal structures of VWA domains (in green) of human anthrax toxin receptor 2 bound with anthrax toxin (PDB code 1T6B) (A); P. vivax thrombospondin repeat anonymous protein (PDB code 4HQL) (B); T. gondii micronemal protein 2 (PDB code 4OKR) (C); blue mussel proximal thread matrix protein 1 (PDB code 4CN9) (D); S. pneumoniae pilus-related adhesion, RrgA (PDB code 2WW8) (E); and human complement C3b bound with factor B and factor D (PDB code 2XWB) (F). The DXSXS motif and metal ions of MIDAS are shown in orange. The residues of α1-helix that are equivalent to the Phe of integrin αI α1-helix are shown in magenta.

References

    1. Hynes R. O. (2002) Integrins: bi-directional, allosteric, signalling machines. Cell 110, 673–687 - PubMed
    1. Iwamoto D. V., and Calderwood D. A. (2015) Regulation of integrin-mediated adhesions. Curr. Opin. Cell Biol. 36, 41–47 - PMC - PubMed
    1. Sun Z., Guo S. S., and Fässler R. (2016) Integrin-mediated mechanotransduction. J. Cell Biol. 215, 445–456 - PMC - PubMed
    1. Humphrey J. D., Dufresne E. R., and Schwartz M. A. (2014) Mechanotransduction and extracellular matrix homeostasis. Nat. Rev. Mol. Cell Biol. 15, 802–812 - PMC - PubMed
    1. Springer T. A., and Dustin M. L. (2012) Integrin inside-out signaling and the immunological synapse. Curr. Opin. Cell Biol. 24, 107–115 - PMC - PubMed

Publication types

MeSH terms