. 2017 Dec 29;292(52):21676-21689.
doi: 10.1074/jbc.M117.792721. Epub 2017 Oct 27.

Interferon regulatory factor 5 (IRF5) suppresses hepatitis C virus (HCV) replication and HCV-associated hepatocellular carcinoma

Affiliations

Interferon regulatory factor 5 (IRF5) suppresses hepatitis C virus (HCV) replication and HCV-associated hepatocellular carcinoma

Ozge Cevik et al. J Biol Chem. .

Abstract

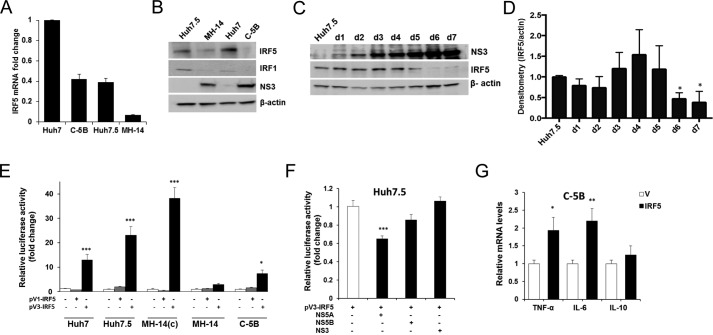
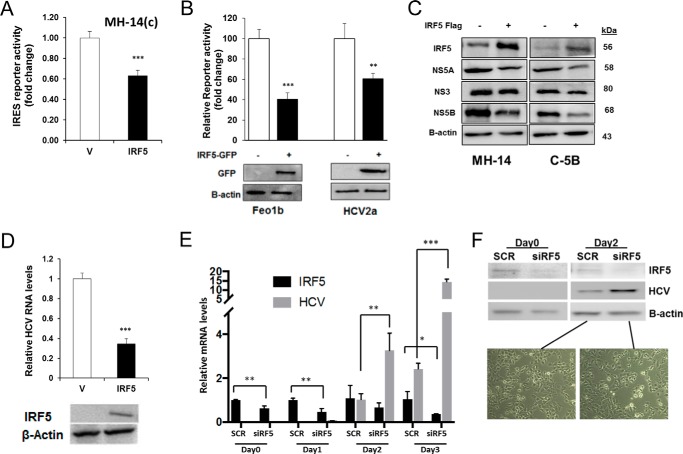
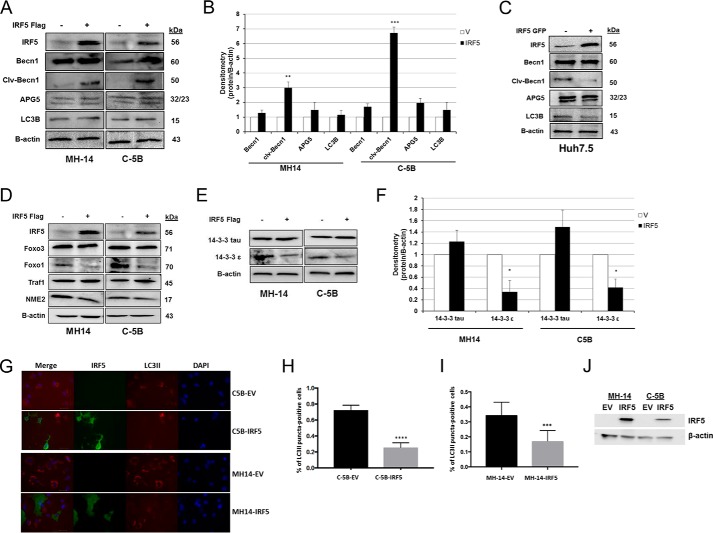
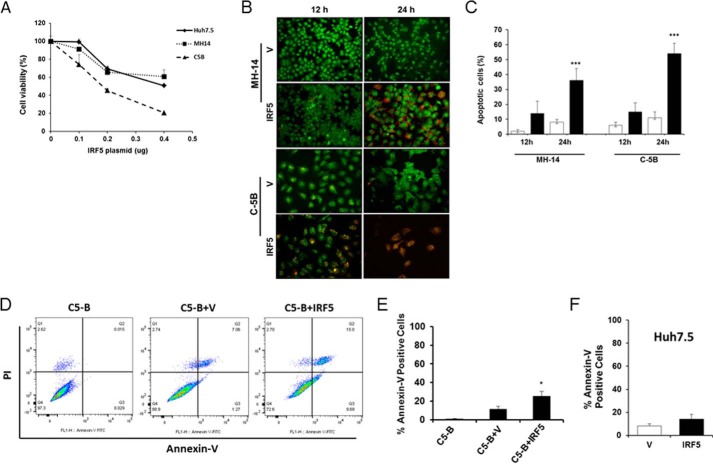
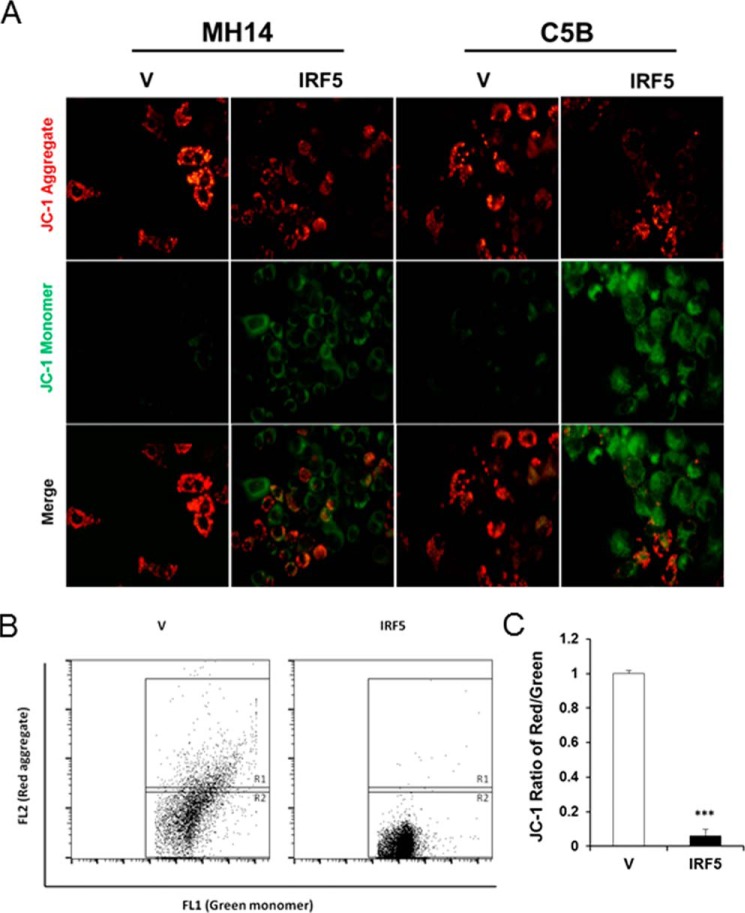
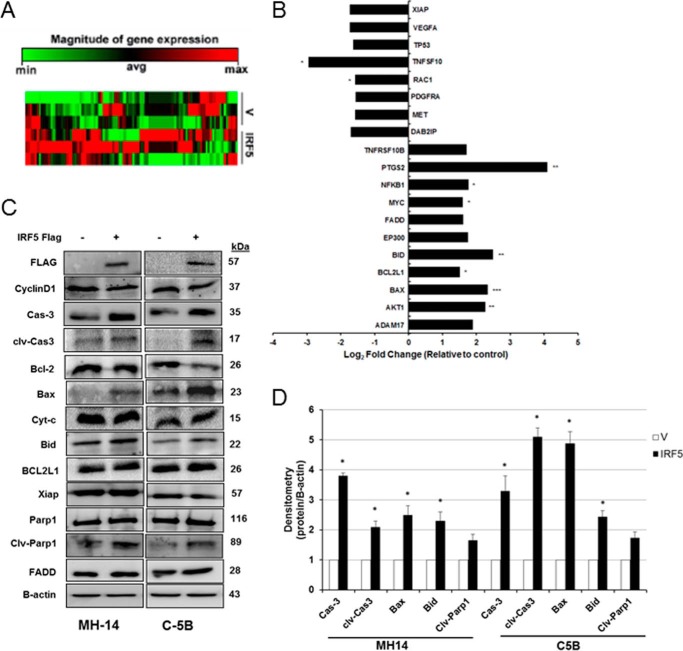
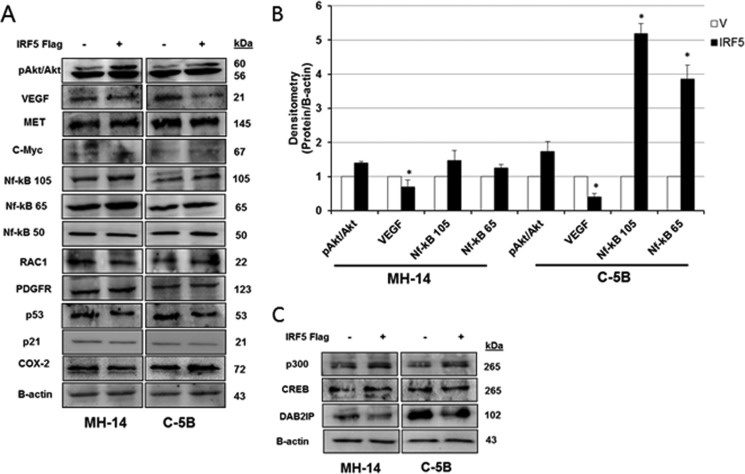
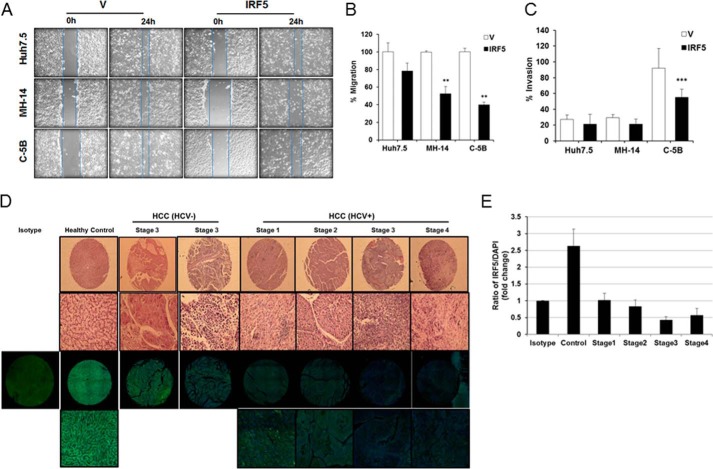
Hepatitis C virus (HCV) infection is a major risk factor for the development of chronic liver disease. The disease typically progresses from chronic HCV to fibrosis, cirrhosis, hepatocellular carcinoma (HCC), and death. Chronic inflammation associated with HCV infection is implicated in cirrhosis and HCC, but the molecular players and signaling pathways contributing to these processes remain largely unknown. Interferon regulatory factor 5 (IRF5) is a molecule of interest in HCV-associated HCC because it has critical roles in virus-, Toll-like receptor (TLR)-, and IFN-induced signaling pathways. IRF5 is also a tumor suppressor, and its expression is dysregulated in several human cancers. Here, we present first evidence that IRF5 expression and signaling are modulated during HCV infection. Using HCV infection of human hepatocytes and cells with autonomously replicating HCV RNA, we found that levels of IRF5 mRNA and protein expression were down-regulated. Of note, reporter assays indicated that IRF5 re-expression inhibited HCV protein translation and RNA replication. Gene expression analysis revealed significant differences in the expression of cancer pathway mediators and autophagy proteins rather than in cytokines between IRF5- and empty vector-transfected HCV replicon cells. IRF5 re-expression induced apoptosis via loss in mitochondrial membrane potential, down-regulated autophagy, and inhibited hepatocyte cell migration/invasion. Analysis of clinical HCC specimens supports a pathologic role for IRF5 in HCV-induced HCC, as IRF5 expression was down-regulated in livers from HCV-positive versus HCV-negative HCC patients or healthy donor livers. These results identify IRF5 as an important suppressor of HCV replication and HCC pathogenesis.

Keywords: Hepatitis C virus (HCV); hepatocellular carcinoma; immunosuppression; interferon regulatory factor (IRF); tumor suppressor gene; viral immunology.


Conflict of interest statement

The authors declare that they have no conflicts of interest with the contents of this article

Figures

Figure 1.
Figure 1.
IRF5 expression and immunoregulation function are downregulated in HCV-infected hepatocytes and HCV replicon cell lines. A, endogenous IRF5 expression was examined in cognate control Huh7 and Huh7.5 cells, HCV replicon–bearing MH-14 and C-5B cells by real-time qPCR. -Fold change was determined after normalization to β-actin levels with relative comparison with Huh7 levels. B, representative data from Western blot analysis of endogenous IRF5, IRF1, and NS3 protein expression. C and D, HCV-infected cell culture supernatants were used to infect naive Huh7.5 cells for 7 days. Representative Western blot data (C) and densitometry analysis of IRF5 protein expression (D) is shown. Data are representative of four independent experiments. E, relative transactivation of IRF5 promoters, pV1-IRF5 and pV3-IRF5, in cognate and replicon-bearing cell lines. -Fold change is shown after normalization to Renilla. F, same as E except plasmids encoding HCV viral proteins were transfected with the pV3-IRF5 promoter. G, IRF5 induces transient proinflammatory cytokine expression in C-5B cells. Empty vector (V) or 80 ng of GFP-IRF5 was transiently transfected, and TNFA, IL6, and IL10 mRNA levels were measured by real-time qPCR at 36 h post-transfection. Data were normalized to β-actin and plotted relative to empty vector control. Data are representative of duplicate data points from three independent replicates; plotted values are means ± S.D. (error bars) (*, p < 0.05; **, p < 0.001; ***, p < 0.0001).
Figure 2.
Figure 2.
IRF5 negatively modulates expression of HCV protein(s) and HCV RNA replication. A, MH-14(c) cells were co-transfected with 80 ng of GFP-IRF5 and the HCV IRES-Luc reporter. -Fold change in luciferase activity is shown after normalization to Renilla. B, same as in A except GFP-IRF5 and HCV IRES-Luc were transfected to Feo1b and HCV2a cells. A representative Western blot of GFP-IRF5 expression in transfected cells is shown. C, levels of HCV viral proteins in HCV replicon cells overexpressing IRF5 were determined by Western blot analysis. D, effect of ectopic IRF5 expression on replicating HCV RNA levels in C-5B cells. HCV RNA expression was analyzed by real-time qPCR 36 h after transfection of 0.1 μg of empty FLAG vector (V) or FLAG-IRF5 (IRF5). Data were normalized to β-actin levels and presented relative to empty vector control. E, Huh7 cells were transfected with scrambled (SCR) or IRF5 siRNAs (siRF5) for 48 h before infecting with purified virus stock for 3 days. IRF5 and HCV RNA levels were determined by real-time qPCR. F, representative Western blot from E showing IRF5 knockdown and HCV protein levels at days 0 and 2 of virus infection. Live cell images are from day 2 postinfection in Huh7 cells transfected with SCR or siIRF5. Images are representative of three independent transient transfections in each cell line. Images were taken at ×40 magnification. Data are representative of duplicate data points from three independent replicates; plotted values are means ± S.D. (error bars) (*, p < 0.05; **, p < 0.001; ***, p < 0.001).
Figure 3.
Figure 3.
IRF5 impairs HCV-induced autophagy. Effect of IRF5 on autophagy regulation in HCV replicon cells. A and B, MH-14 and C-5B cells were transiently transfected with 0.1 μg of FLAG-IRF5 plasmid for 36 h. Expression of key proteins involved in autophagy was analyzed by Western blotting. B, results from densitometry analysis of mediators in A. C, same as A except expression was examined in Huh7.5 cells. D–F, similar to A except additional proteins involved in autophagy were examined and quantified by densitometry analysis. G, representative images of C5B-EV, C5B-IRF5, MH14-EV, and MH14-IRF5 cells stained for IRF5 and LC3II. Images were taken at ×50 magnification; scale bar, 20 μm. The percentage of cells positive for LC3 puncta was calculated from three independent experiments, and the results are shown in H for C-5B cells and I for MH-14 cells. J, representative Western blot of IRF5 expression in MH-14 and C-5B cells transfected with FLAG-IRF5 or empty vector (EV) plasmid. Data are representative of three independent replicates; plotted values are means ± S.D. (error bars) (*, p < 0.05; **, p < 0.001; ***, p < 0.0001).
Figure 4.
Figure 4.
IRF5 enhances cell death in HCV replicon cells. A, cell viability as determined by the MTS assay is shown for Huh7.5, MH-14, and C-5B cells. Cells were transiently transfected with the indicated concentrations of FLAG-IRF5 plasmid and harvested 24 h later. Data are means ± S.D. (error bars) of six independent replicates. B, representative fluorescent images of AO and EtBr co-staining in MH-14 and C-5B cells transfected with 0.1 μg of empty vector (V) or FLAG-IRF5 plasmid (IRF5). Images were taken at ×20 magnification. C, summary of data from B showing the percentage of EtBr-positive (apoptotic) cells 12 and 24 h post-transfection. White bars, cells transfected with empty vector; black bars, cells transfected with FLAG-IRF5 plasmid. D, representative dot plots from flow cytometry analysis of C-5B cells left untransfected or transiently transfected with 80 ng of empty vector (V) or FLAG-IRF5 (IRF5) plasmid. Apoptosis was determined from Annexin V-FITC single-stained cells 12 h later. E, summary of data from D showing mean percentage of single-stained cells ± S.D. Plotted data are duplicate data points from three independent replicates. F, same as E except data are from Huh7.5 cells. *, p < 0.05; ***, p < 0.0001.
Figure 5.
Figure 5.
IRF5 induces loss of Δψm in HCV replicon cells. A, representative images from JC-1 staining of C-5B and MH-14 cells overexpressing empty vector (V) or FLAG-IRF5 (IRF5) plasmid. Red and green fluorescence represent aggregated (non-apoptotic) and monomeric (apoptotic) JC-1 staining, respectively. Images were taken at ×40 magnification. B, similar to A except JC-1 staining was analyzed by flow cytometry. Representative dot plots from C-5B cells are shown illustrating gating of JC-1 red-positive (R1) and JC-1 green-positive (R2) populations; the ratio represents the JC1-positive population. C, graphical summary of data from B. Data are representative of duplicate data points from three independent replicates; plotted values are means ± S.D. (error bars) (***, p < 0.0001).
Figure 6.
Figure 6.
Ectopic IRF5 alters the expression of genes associated with mitochondrial apoptosis. A, C-5B replicon cells were transiently transfected with empty vector (V) control or GFP-IRF5 (IRF5) plasmid, and 36 h later, total RNA was isolated for analysis of gene expression using the liver cancer RT2 ProfilerTM PCR array. Data from three independent replicates is shown in a clustergram (heat map) representing relative expression levels for all samples and all genes included on the real-time qPCR array. Red, up-regulated expression; green, down-regulated expression. B, same as A except data are represented as -fold change compared with the control group after normalization to housekeeping genes. Genes with >1.5-fold change in expression between empty vector control and IRF5-overexpressing cells are shown. C, representative Western blot of genes in the liver cancer RT2 ProfilerTM PCR array. Data are representative of three independent replicates performed in each cell line. D, summarized results from densitometry analysis of C. Data are from three independent replicates; plotted values are means ± S.D. (error bars) (*, p < 0.05; **, p < 0.001; ***, p < 0.0001).
Figure 7.
Figure 7.
Ectopic IRF5 alters the expression of genes associated with HCC pathogenesis. A–C, same as in Fig. 6 except genes related to cell survival and growth were analyzed. B, summarized results from densitometry analysis of protein expression. Data are representative of three independent replicates from each cell line. Plotted values are means ± S.D. (error bars) (*, p < 0.05).
Figure 8.
Figure 8.
IRF5 inhibits the migration and invasion potential of HCV replicon cells. A, wound-healing assays were performed on Huh7.5, MH-14, and C-5B cells after transient transfection with empty vector (V) or GFP-IRF5 plasmid. Representative images are shown from 0 and 24 h after scratch. Lines demarcate visible wound borders. B, graphical representation of data from the 24-h time point is shown from four independent experiments performed in duplicate. Plotted values are means ± S.D. (error bars) (**, p < 0.001). C, similar to A except Matrigel invasion assays were performed on the indicated cell lines 16 h post-transfection. Graphical representation of data is shown from three independent experiments performed in duplicate. Plotted values are means ± S.D. (***, p < 0.0001). D, IRF5 expression is lost in the livers of HCV-positive HCC patients. Representative H&E and immunofluorescence staining of individual cores from a human liver cancer tissue array is shown. Representative images are from n = 20 healthy liver, n = 20 HCV- and HBV-negative HCC, and n = 18 HCV-positive HCC tissue cores. The top two panels show results from H&E staining; the top panel shows full core (×4 magnification), and the bottom panel shows a ×20 magnified image. The bottom two panels show immunofluorescence staining at the same magnifications; IRF5 is Alexa Fluor 488 (green), DAPI is blue. Left, single panel shows negative isotype control staining for IRF5 in healthy control core. E, summarized data of IRF5 expression is from n = 20 healthy liver and n = 38 HCC tissue cores stained in D. The ratio of IRF5 to DAPI staining is plotted for each disease stage.

References

    1. Hajarizadeh B., Grebely J., Dore G. J. (2013) Epidemiology and natural history of HCV infection. Nat. Rev. Gastroenterol. Hepatol. 10, 553–562 - PubMed
    1. Mohd Hanafiah K., Groeger J., Flaxman A. D., and Wiersma S. T. (2013) Global epidemiology of hepatitis C virus infection: new estimates of age-specific antibody to HCV seroprevalence. Hepatology 57, 1333–1342 - PubMed
    1. Arzumanyan A., Reis H. M., and Feitelson M. A. (2013) Pathogenic mechanisms in HBV- and HCV-associated hepatocellular carcinoma. Nat. Rev. Cancer 13, 123–135 - PubMed
    1. Beales L. P., Holzenburg A., and Rowlands D. J. (2003) Viral internal ribosome entry site structures segregate into two distinct morphologies. J. Virol. 77, 6574–6579 - PMC - PubMed
    1. Barth H. (2015) Hepatitis C virus: is it time to say goodbye yet? Perspectives and challenges for the next decade. World J. Hepatol. 7, 725–737 - PMC - PubMed

Publication types

MeSH terms

Substances