. 2017 Dec 22;292(51):20818-20833.
doi: 10.1074/jbc.RA117.000220. Epub 2017 Oct 27.

Structural and functional effects of cytochrome b5 interactions with human cytochrome P450 enzymes

Affiliations

Structural and functional effects of cytochrome b5 interactions with human cytochrome P450 enzymes

Aaron G Bart et al. J Biol Chem. .

Abstract

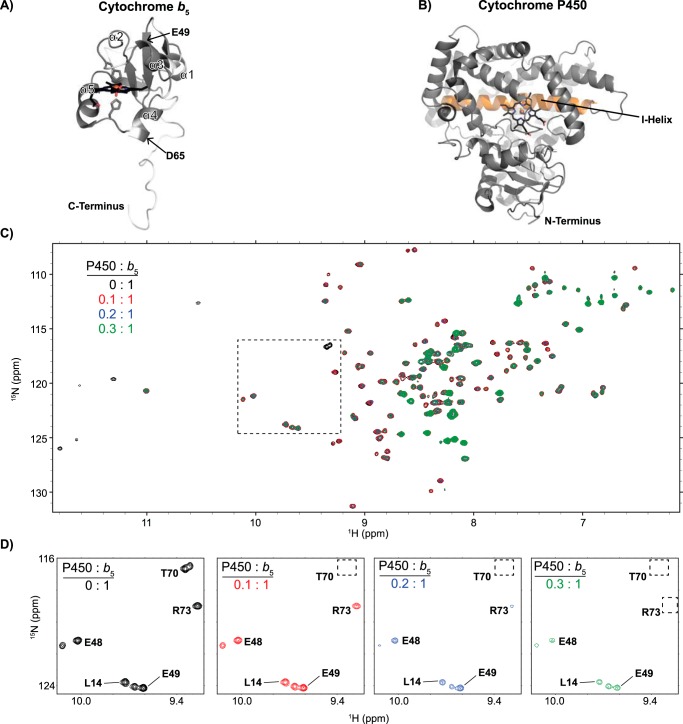
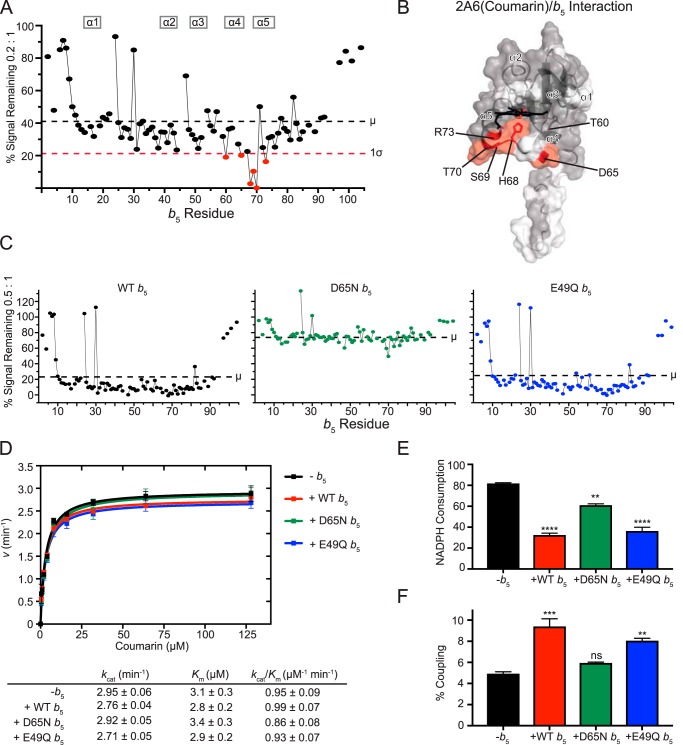
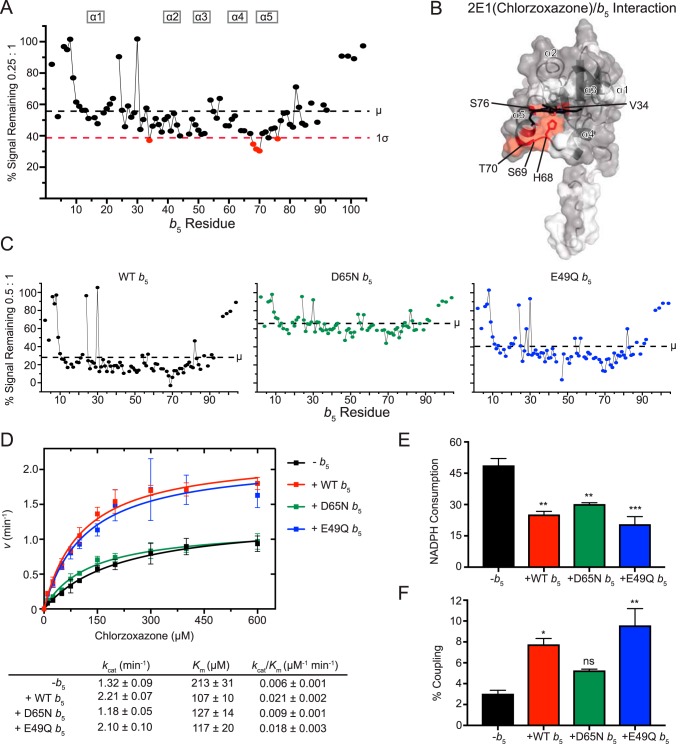
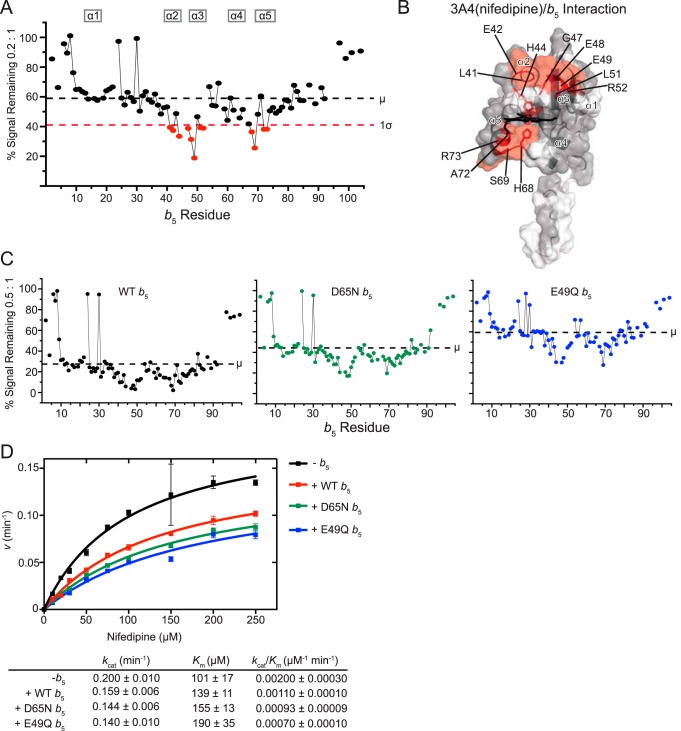
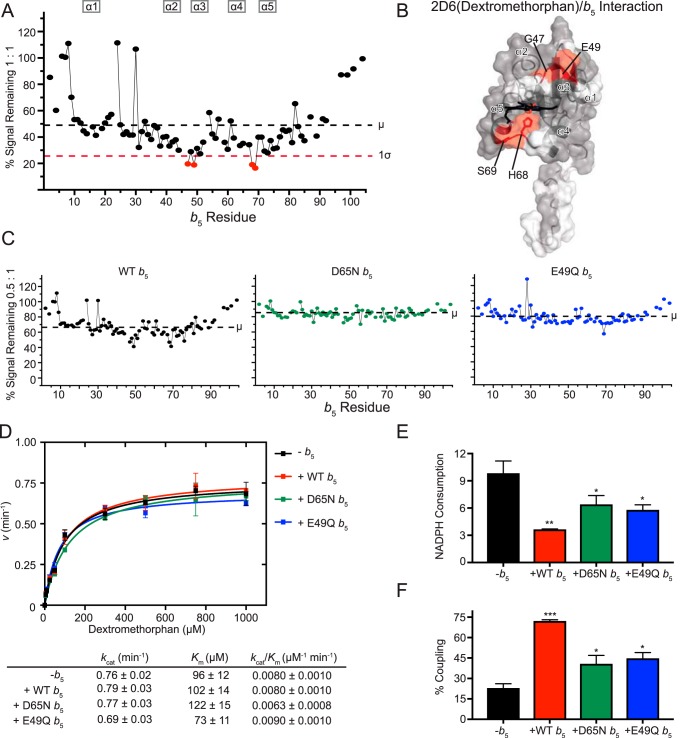
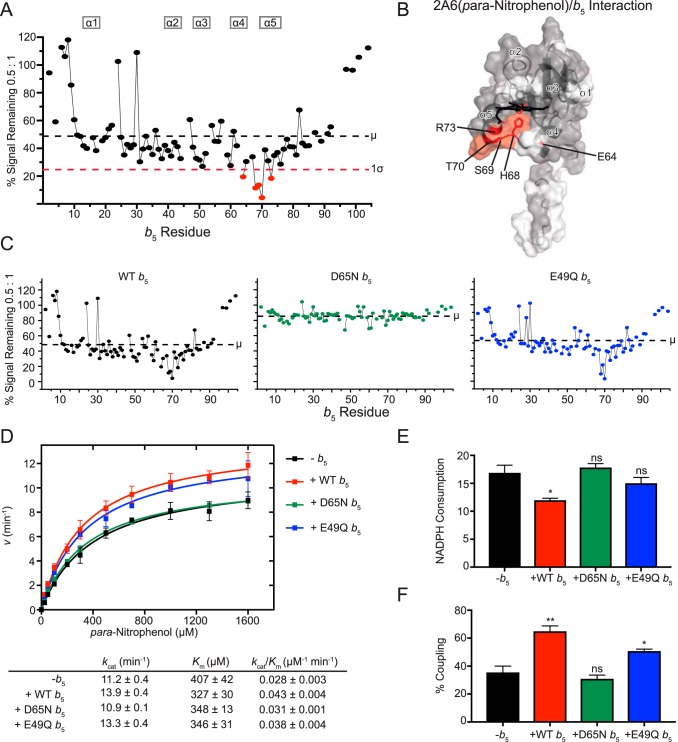
The small heme-containing protein cytochrome b5 can facilitate, inhibit, or have no effect on cytochrome P450 catalysis, often in a P450-dependent and substrate-dependent manner that is not well understood. Herein, solution NMR was used to identify b5 residues interacting with different human drug-metabolizing P450 enzymes. NMR results revealed that P450 enzymes bound to either b5 α4-5 (CYP2A6 and CYP2E1) or this region and α2-3 (CYP2D6 and CYP3A4) and suggested variation in the affinity for b5 Mutations of key b5 residues suggest not only that different b5 surfaces are responsible for binding different P450 enzymes, but that these different complexes are relevant to the observed effects on P450 catalysis.

Keywords: cytochrome; cytochrome P450; membrane protein; nuclear magnetic resonance (NMR); protein-protein interaction.


Conflict of interest statement

The authors declare that they have no conflicts of interest with the contents of this article

Figures

Figure 1.
Figure 1.
General structures of proteins in this study and overview of their interaction as monitored by NMR. A, structure of the human cytochrome b5 soluble domain (residues 1–107), as determined by NMR (PDB entry 2I96). The heme and coordinating histidine residues are shown as sticks. α-Helices are labeled 1–5. The locations of Glu-49 and Asp-65 in helices 3 and 4 are indicated. B, P450 structure (CYP2A6, PDB 1Z10) viewed from the proximal face proposed to interact with b5. The heme is again shown as sticks. As a reference, the I helix is highlighted (orange) on the distal side of the heme where the active site is located. C, the 1H-15N HSQC NMR spectra of the soluble domain of human cytochrome b5 titrated with increasing amounts of an unlabeled CYP2A6 saturated with coumarin are representative of the type of changes seen for all P450 enzymes examined herein. Progressive signal loss or line-broadening of most b5 resonances occurs with increasing concentrations of P450, indicating progressive complex formation between the two proteins. D, a selected region of the NMR spectra (the region indicated as a dashed box in C) is shown with increasing P450 to demonstrate differential line broadening effects. In this example with CYP2A6, some resonances are broadened to a greater extent (Thr-70 and Arg-73) than others (Leu-14, Glu-48, and Glu-49).
Figure 2.
Figure 2.
Interaction of CYP2A6(coumarin) with [15N]b5 by NMR and b5 modulation of CYP2A6 catalysis. A, a single NMR spectrum of 0.2:1 CYP2A6(coumarin):[15N]b5 is shown graphically. The intensity of each b5 resonance (circle) corresponding to an individual b5 residue (x axis) is plotted as a percentage of that resonance's intensity in the absence of P450 (y axis). Fine lines between circles indicate continuous assignments for sequential b5 amino acids. Gaps in the line between circles indicate that one or more intervening b5 amino acids have not been assigned to an individual resonance in the spectrum (also shown in white in B). The average (μ) and average minus one S.D. (1σ) are indicated on the plot by black and red dashed lines, respectively, and constitute the selection criteria of b5 residues involved in P450 binding (red circles). B, on the surface of the human soluble domain b5 structure (PDB entry 2I96), residues displaying differential broadening effects are colored red, whereas residues that have assigned NMR resonances that are not differentially affected by P450 addition are colored gray, and unassigned residues are colored white. C, resonance intensity plots as in A, but comparing the effects of line broadening between WT b5 and b5 mutants D65N and E49Q at a fixed 0.5:1 CYP2A6(coumarin):[15N]b5 ratio. D, effects of wild-type and mutant b5 proteins on Michaelis–Menten kinetic parameters of CYP2A6-mediated coumarin 7-hydroxylation. Each sample was generated in duplicate with S.D. illustrated by error bars. Steady-state kinetic constants below are shown with S.D. E, measurement of NADPH consumed (nmol of NADPH/min/nmol of CYP2A6) for the CYP2A6 coumarin reaction at a fixed coumarin concentration of 128 μm. Samples were generated in duplicate with the S.D. illustrated by error bars. F, percent coupling of CYP2A6-mediated coumarin 7-hydroxylation of coumarin. Samples were generated in duplicate with the S.D. illustrated by error bars. ns, p >0.05; **, p ≤ 0.01; ***, p ≤ 0.001; ****, p ≤ 0.0001.
Figure 3.
Figure 3.
Interaction of CYP2E1(chlorzoxazone) with [15N]b5 by NMR and b5 modulation of CYP2E1 catalysis. A, a single NMR spectrum of 0.25:1 CYP2E1(CZN):[15N]b5 is shown graphically as described in Fig. 2A. B, mapping of differentially affected residues (red) on human b5. The color code is as described in the legend to Fig. 2B. C, resonance intensity plots comparing line broadening for wild-type b5 and b5 mutants at a 0.5:1 CYP2E1(CZN):[15N]b5 ratio. D, effect of wild-type and mutated b5 on Michaelis–Menten kinetic parameters of CYP2E1-mediated chlorzoxazone 6-hydroxylation. Each sample was generated in triplicate with S.D. illustrated by error bars. Steady-state kinetic constants below are shown with S.D. E, NADPH consumed (nmol of NADPH/min/nmol of CYP2E1) for CYP2E1-mediated chlorzoxazone metabolism at a fixed chlorzoxazone concentration of 600 μm. Samples were generated in duplicate with the S.D. illustrated by error bars. F, percent coupling of CYP2E1-mediated chlorzoxazone 6-hydroxylation. Samples were generated in duplicate with the S.D. illustrated by error bars. ns, p > 0.05; **, p ≤ 0.01; ***, p ≤ 0.001.
Figure 4.
Figure 4.
Interaction of CYP3A4(nifedipine) with [15N]b5 as determined by NMR and catalytic modulation of b5 on CYP3A4-mediated metabolism of nifedipine. A, b5 resonance intensity plot at a 0.2:1 (CYP3A4(nifedipine):[15N]b5) ratio normalized to the free b5 resonance intensity. The color code is as described in the legend to Fig. 2B. B, human soluble domain b5 structure (PDB entry 2I96) with residues displaying differential broadening effects colored red, residues that are assigned in the NMR spectrum colored gray, and unassigned residues colored white. C, b5 resonance intensity plots comparing the effects of line broadening between WT b5 and b5 mutants D65N and E49Q at a fixed 0.5:1 (CYP3A4(nifedipine):[15N]b5) ratio. D, effect of WT b5 and mutants on Michaelis–Menten kinetic parameters of CYP3A4-mediated oxidation of nifedipine. Each sample was generated in duplicate with S.D. illustrated by error bars. Steady-state kinetic constants below are shown with S.D.
Figure 5.
Figure 5.
Interaction of CYP2D6(dextromethorphan) with [15N]b5 as determined by NMR and catalytic modulation of b5 on CYP2D6-mediated metabolism of dextromethorphan. A, b5 resonance intensity plot at a 1:1 (CYP2D6(DXM):[15N]b5) ratio normalized to the free b5 resonance intensity. The color code is as described in the legend to Fig. 2B. B, human soluble domain b5 structure (PDB entry 2I96) with residues displaying differential broadening effects colored red, residues that are assigned in the NMR spectrum colored gray, and unassigned residues colored white. C, b5 resonance intensity plots comparing the effects of line broadening between WT b5 and b5 mutants D65N and E49Q at a fixed 0.5:1 (CYP2D6(DXM):[15N]b5) ratio. D, effect of WT b5 and mutants on Michaelis–Menten kinetic parameters of CYP2D6-mediated O-demethylation of dextromethorphan. Each sample was generated in triplicate with S.D. illustrated by error bars. Steady-state kinetic constants below are shown with S.D. E, measurement of NADPH consumed (nmol of NADPH/min/nmol of CYP2D6) for CYP2D6 dextromethorphan reaction at a fixed dextromethorphan concentration of 1 mm. Samples were generated in duplicate with the S.D. illustrated by error bars. F, percent coupling of CYP2D6-mediated O-demethylation of dextromethorphan. Samples were generated in duplicate with the S.D. illustrated by error bars. *, p ≤ 0.05; **, p ≤ 0.01; ***, p ≤ 0.001.
Figure 6.
Figure 6.
Interaction of CYP2A6(pNP) with [15N]b5 as determined by NMR and catalytic modulation of b5 on CYP2A6 mediated metabolism of para-nitrophenol. A, b5 resonance intensity plot at a 0.5:1 (CYP2A6(pNP):[15N]b5) ratio normalized to the free b5 resonance intensity. The color code is as described in the legend to Fig. 2B. B, human soluble domain b5 structure (PDB entry 2I96) with residues displaying differential broadening effects colored red, residues that are assigned in the NMR spectrum colored gray, and unassigned residues colored white. C, b5 resonance intensity plots comparing the effects of line broadening between WT b5 and b5 mutants D65N and E49Q at a fixed 0.5:1 (CYP2A6(pNP):[15N]b5) ratio. D, effect of WT b5 and mutants on Michaelis–Menten kinetic parameters of CYP2A6-mediated 2-hydroxylation of pNP. Each sample was generated in duplicate with S.D. illustrated by error bars. Steady-state kinetic constants below are shown with S.D. E, measurement of NADPH consumed (nmol of NADPH/min/nmol of CYP2A6) for CYP2A6 pNP reaction at a fixed pNP concentration of 1.6 mm. Samples were generated in duplicate with the S.D. illustrated by error bars. F, percent coupling of CYP2A6-mediated 2-hydroxylation of pNP. Samples were generated in duplicate with the S.D. illustrated by error bars. ns, p > 0.05; *, p ≤ 0.05; **, p ≤ 0.01.

References

    1. Waskell L., and Kim J.-J. P. (2015) Electron transfer partners of cytochrome P450. In Cytochrome P450: Structure, Mechanism, and Biochemistry, 4th Ed (Ortiz de Montellano P. R., ed) pp. 33–68, Springer International Publishing, Cham, Switzerland
    1. Schenkman J. B., and Jansson I. (2003) The many roles of cytochrome b5. Pharmacol. Ther. 97, 139–152 - PubMed
    1. Bridges A., Gruenke L., Chang Y. T., Vakser I. A., Loew G., and Waskell L. (1998) Identification of the binding site on cytochrome P450 2B4 for cytochrome b5 and cytochrome P450 reductase. J. Biol. Chem. 273, 17036–17049 - PubMed
    1. Naffin-Olivos J. L., and Auchus R. J. (2006) Human cytochrome b5 requires residues E48 and E49 to stimulate the 17,20-lyase activity of cytochrome P450c17. Biochemistry 45, 755–762 - PubMed
    1. Tamburini P. P., White R. E., and Schenkman J. B. (1985) Chemical characterization of protein-protein interactions between cytochrome P-450 and cytochrome b5. J. Biol. Chem. 260, 4007–4015 - PubMed

Publication types

MeSH terms

LinkOut - more resources