. 2017 Dec 21;130(25):2739-2749.
doi: 10.1182/blood-2017-02-769463. Epub 2017 Oct 27.

c-MPL provides tumor-targeted T-cell receptor-transgenic T cells with costimulation and cytokine signals

Affiliations

c-MPL provides tumor-targeted T-cell receptor-transgenic T cells with costimulation and cytokine signals

Christopher D Nishimura et al. Blood. .

Abstract

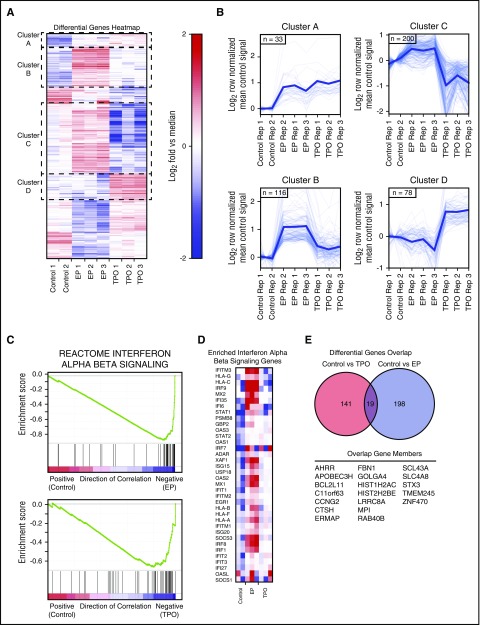
Adoptively transferred T-cell receptor (TCR)-engineered T cells depend on host-derived costimulation and cytokine signals for their full and sustained activation. However, in patients with cancer, both signals are frequently impaired. Hence, we developed a novel strategy that combines both essential signals in 1 transgene by expressing the nonlymphoid hematopoietic growth factor receptor c-MPL (myeloproliferative leukemia), the receptor for thrombopoietin (TPO), in T cells. c-MPL signaling activates pathways shared with conventional costimulatory and cytokine receptor signaling. Thus, we hypothesized that host-derived TPO, present in the tumor microenvironment, or pharmacological c-MPL agonists approved by the US Food and Drug Administration could deliver both signals to c-MPL-engineered TCR-transgenic T cells. We found that c-MPL+ polyclonal T cells expand and proliferate in response to TPO, and persist longer after adoptive transfer in immunodeficient human TPO-transgenic mice. In TCR-transgenic T cells, c-MPL activation enhances antitumor function, T-cell expansion, and cytokine production and preserves a central memory phenotype. c-MPL signaling also enables sequential tumor cell killing, enhances the formation of effective immune synapses, and improves antileukemic activity in vivo in a leukemia xenograft model. We identify the type 1 interferon pathway as a molecular mechanism by which c-MPL mediates immune stimulation in T cells. In conclusion, we present a novel immunotherapeutic strategy using c-MPL-enhanced transgenic T cells responding to either endogenously produced TPO (a microenvironment factor in hematologic malignancies) or c-MPL-targeted pharmacological agents.


Conflict of interest statement

Conflict-of-interest disclosure: C.Y.L. receives royalty payments from Syros Pharmaceuticals and has sponsored travel from Novartis Institute for Biomedical Research; C.A. receives royalty payments from Cell Medica. The remaining authors declare no competing financial interest.

Figures

Figure 1.
Figure 1.
c-MPL expression in polyclonal human T cells produces agonist-dependent proliferation and increased persistence in vivo. (A) c-MPL expression in polyclonal CD4+ and CD8+ T cells 7 days after retroviral transduction, representative FACS plots (left) and summary (right, n = 5). NT, green circles; c-MPL-transduced (c-MPL+), orange squares, mean± SD. (B) Expansion of NT (left) or c-MPL+ (right) T cells cultured in noCK (gray circles, solid lines), TPO 50 ng/mL (red squares, solid lines), or IL-2 50 U/mL (purple triangles, dashed lines) for 7 days. Replicates for n = 4 donors. (C) CFSE dilution of c-MPL-transduced cells cultured in noCK (gray), TPO50 ng/mL (red), or IL-2 50 U/mL (purple) for 7 days, gated on c-MPL (left) or c-MPL+ (right) cells. One representative of 3 donors. (D) c-MPL ligand induced STAT5 phosphorylation in c-MPL+ T cells after treatment of 1 or 24 hours with noCK (gray), TPO 5 ng/mL (red), TPO 50 ng/mL (blue) or eltrombopag (EP 0.1 μg/mL, green). (E) Mouse model experimental set up. (F) Transduction efficiency of T cells transduced with GFP-ffLuc alone (top) or cotransduced with GFP-ffLuc and c-MPL (lower) and injected IV into unconditioned hTPOtg-RAG2−/−γc−/− mice. (G) Summary of bioluminescent imaging data of control T cells (GFP-ffLuc+, blue circles and lines; n = 10) or c-MPL+ T cells (GFP-ffLuc+c-MPL+, red squares and lines; n = 8). *P = .0003, GFP-ffLuc+ vs GFP-ffLuc+c-MPL+, Student t test on log area under the curve for second T-cell infusion. Combined results from 2 independent experiments. (H) Three representative mice/group imaged over time by BLI; color scale 5 × 10³ to 5 × 10⁴ p/sec/cm2/sr (radiance).
Figure 2.
Figure 2.
c-MPL is functional in survivin-specific TCR-transgenic T cells and enhances antitumor function in vitro. (A) Transduction efficiencies of CD8+ activated T cells with survivin-TCR alone (murine constant β chain, mCβ) or in combination with c-MPL. Representative FACS plots (left) and summary (right), n = 13; mean ± SD. (B) TCR+c-MPL+ T cells expand upon stimulation with survivin peptide pulsed artificial antigen-presenting cells in a TPO dose-responsive manner (right). TCR+ T cells only expand in IL-2, but not high-dose TPO (left, n = 6), except for noCK condition (n = 3; mean ± SD). TCR+ T cells at end S2: noCK vs IL-2, P = .003; noCK vs TPO500, P = NS. TCR+c-MPL+ T cells at end S2: noCK vs IL-2, P < .001; noCK vs TPO5, P = NS; noCK vs TPO50, P = .02; noCK vs TPO500, P < .001; IL-2 vs TPO500, P = NS; Student t test. (C) c-MPL+ T cells expand in eltrombopag in a dose-responsive manner during activation with OKT3 and CD28 antibodies, NT T cells only expand in IL-2 50 U/mL, analyzed on day 7. One representative of 3 donors. (D) c-MPL ligand (TPO or EP) induced phosphorylation of STAT3 and STAT5 at 1 hour (left) and 24 hours (right). (E) Coculture of expanded NT, TCR+, or TCR+c-MPL+ T cells with U266 myeloma cells (HLA-A*0201+survivin+) in noCK (gray circles), TPO 5 ng/mL (red squares), TPO 50 ng/mL (blue triangles), or IL-2 25 U/mL (purple squares); effector:target ratio, E:T 1:1. Residual U266 cells (left) and T cells (right) were quantified by FACS on day 5; n = 3; mean ± SD. (F) Coculture with BV173 leukemia cells (HLA-A*0201+survivin+), E:T 1:3. Residual BV173 cells (left) and T cells (right) were quantified by FACS on day 5; n = 7 for noCK, TPO5, and TPO50; n = 3 for IL-2; mean ± SD. (E, F) *P < .05, **P < .01, ***P < .001, Student t test on log transformed data. NS, not significant.
Figure 3.
Figure 3.
Ligand-induced c-MPL activation supports sequential killing activity and T-cell expansion in TCR-transgenic T cells. (A) Serial coculture with BV173 leukemia cells, E:T 1:5. Residual BV173 cells (left) and T cells (right) were quantified by FACS every 3 to 4 days from a total of 8 replicate wells per donor, and BV173 cells were added-back to untouched wells (+) at each point. Cultures in noCK (gray circles), IL-2 25 U/mL (purple squares), TPO 5 ng/mL (red squares), TPO 50 ng/mL (blue triangles), EP 0.1 μg/mL (green triangles), plate-bound anti-CD28 (orange triangles, dotted line), IL-2 (25 U/mL) + plate-bound anti-CD28 (purple diamond, dotted line); n = 3 for IL-2, anti-CD28, IL-2+anti-CD28, TPO5, EP; n = 6 for noCK, TPO50. Lines of individual donors are shown for tumor cell counts; mean ±SD for T-cell counts. (Left) Serial killing activity was analyzed by Kaplan-Meier analysis: overall, P < .0001; noCK vs TPO5, P = .007; noCK vs TPO50, P < .0001; noCK vs EP, P = .003; noCK vs IL-2, P < .0001; noCK vs aCD28, P = .038; noCK vs aCD28+IL-2, P < .0001. TPO50 vs IL-2, P = NS; TPO50 vs aCD28, P = .003; TPO50 vs aCD28+IL-2, P = NS. (Right) T-cell expansion in noCK vs TPO5, P = NS; noCK vs TPO50, P = .003; noCK vs EP, P = NS; noCK vs IL-2, P = .001; noCK vs aCD28, P = NS; noCK vs aCD28+IL-2, P = .001. TPO5 vs TPO50, P = .02; TPO5 vs EP, P = NS; TPO50 vs EP, P = .03; TPO50 vs IL-2, P = NS; TPO50 vs aCD28+IL-2, P = NS. Student t test on log area under the curve. (B) Cytokine levels in coculture supernatants 24 hours after tumor cell challenge for the first, third, fifth, and seventh tumor challenge on days 1, 8, 15, and 22 of coculture, respectively; n = 3; mean ± SD, analyzed in duplicates. Student t test on log transformed data (days 1, 8), 1 sample Student t test compares with null hypothesis of 0 on log transformed data (days 15, 22). *P < .05, **P < .01. (C-D) T-cell phenotype of CD3+CD8+TCR+c-MPL+ T cells recovered from cocultures at each time-point; n = 3-6 (as in A); mean ± SD. (C) Percentages of CD45RA+CD45RO+ cells. No CK vs TPO5, P = .002; noCK vs TPO50, P < .0001; noCK vs EP, P = .002; noCK vs IL-2, P = .002; noCK vs aCD28, P = NS; noCK vs aCD28+IL-2, P = .004. TPO50 vs IL-2, P = .05; TPO50 vs aCD28, P < .0001; TPO50 vs aCD28+IL-2, P = .005. Student t test on log area under the curve. (D) Naive, central memory (CM), effector memory (EM), and effector T cells. Naïve: P = NS, except noCK vs TPO50, P = .05; noCK vs aCD28+IL-2, P = .05; CM: noCK vs TPO5, P = .003; noCK vs TPO50, P < .0001; noCK vs EP, P = .002; noCK vs IL-2, P = .005; noCK vs aCD28, P = NS; noCK vs aCD28+IL-2, P = .009. TPO50 vs IL-2, P = NS; TPO50 vs aCD28, P = .001, TPO50 vs aCD28+IL-2, P = .03. EP vs aCD28+IL-2, P = .04; Student t test on log area under the curve day 14.
Figure 4.
Figure 4.
c-MPL stimulated sequential killer T cells form more efficient immune synapses. (A) Experimental set up. (B) Representative images of immune synapses between T cells and BV173 leukemia cells. Phase contrast (left) and confocal images (right) at baseline and after coculture. Actin (white), pericentrin (blue), perforin (green). (C) Quantification of the percentage actin at the synapse, the distance of the microtubule organization center to the synapse, and the perforin distance to the synapse. n = 3, mean ± SD. **P ≤ .01; Student t test on log transformed data. NS, not significant.
Figure 5.
Figure 5.
c-MPL signaling in tumor-targeted TCR-transgenic T cells is immune stimulatory. (A) Heat map of median normalized differential gene expression clustered by overall expression behavior. (B) Control signal mean normalized expression behavior of highlighted clusters from heat map. (C) Gene set enrichment analysis output for reactome interferon α β signaling gene set showing correlation between control and EP treatment, and control and TPO treatment. (D) Heat map of enriched genes in interferon α β signaling genes. (E) Genes in the overlap of the control vs EP and control vs TPO differential genes.
Figure 6.
Figure 6.
c-MPL signaling in T cells significantly enhances antitumor function in a leukemia xenograft model. (A) Experimental set up. (B) Kaplan-Meier survival analysis. Survival of hTPOtg-RAG2−/−γc−/− mice, injected with BV173-ffLuc+ cells and treated with control T cells (n = 7), TCR+ T cells (n = 9), TCR+c-MPL+ T cells and PBS injections (n = 14), TCR+c-MPL+ T cells and rhTPO injections (n = 10). Results combined from 3 independent experiments. Overall survival: P = .004. TCR vs TCR+c-MPL+ (PBS injected): P = .27. TCR vs TCR+c-MPL+ (rhTPO injected): P = .001. TCR+c-MPL+ (PBS injected) vs TCR+c-MPL+ (rhTPO injected): P = .07. (C) 3 representative mice/group imaged over time by BLI; color scale 5 × 10³ to 5 × 10⁴ p/sec/cm2/sr. (D) Summary of BLI data by treatment condition, results combined from 3 independent experiments, mean ± SD. Control T cells (n = 7, lime green circles solid lines), TCR+ T cells (n = 9, lavender squares solid lines), TCR+c-MPL+ T cells (PBS injected; n = 14, blue triangles up solid lines), TCR+c-MPL+ T cells (rhTPO injected; n = 10, blue triangles down dotted lines). TCR vs TCR+c-MPL+ (PBS injected): P = .004. TCR vs TCR+c-MPL+ (rhTPO injected): P = .0005. TCR+c-MPL+ (PBS injected) vs TCR+c-MPL+ (rhTPO injected): P = .088. Statistics was performed using the Student t test on log AUC at week 4 compared with week 1.

References

    1. Kershaw MH, Westwood JA, Darcy PK. Gene-engineered T cells for cancer therapy. Nat Rev Cancer. 2013;13(8):525-541. - PubMed
    1. Fesnak AD, June CH, Levine BL. Engineered T cells: the promise and challenges of cancer immunotherapy. Nat Rev Cancer. 2016;16(9):566-581. - PMC - PubMed
    1. Cheever MA, Allison JP, Ferris AS, et al. . The prioritization of cancer antigens: a national cancer institute pilot project for the acceleration of translational research. Clin Cancer Res. 2009;15(17):5323-5337. - PMC - PubMed
    1. Dotti G, Gottschalk S, Savoldo B, Brenner MK. Design and development of therapies using chimeric antigen receptor-expressing T cells. Immunol Rev. 2014;257(1):107-126. - PMC - PubMed
    1. Hitchcock IS, Kaushansky K. Thrombopoietin from beginning to end. Br J Haematol. 2014;165(2):259-268. - PubMed

Publication types