. 2017 Dec;27(12):1988-2000.
doi: 10.1101/gr.219956.116. Epub 2017 Oct 27.

Deep sequencing of natural and experimental populations of Drosophila melanogaster reveals biases in the spectrum of new mutations

Affiliations

Deep sequencing of natural and experimental populations of Drosophila melanogaster reveals biases in the spectrum of new mutations

Zoe June Assaf et al. Genome Res. 2017 Dec.

Abstract

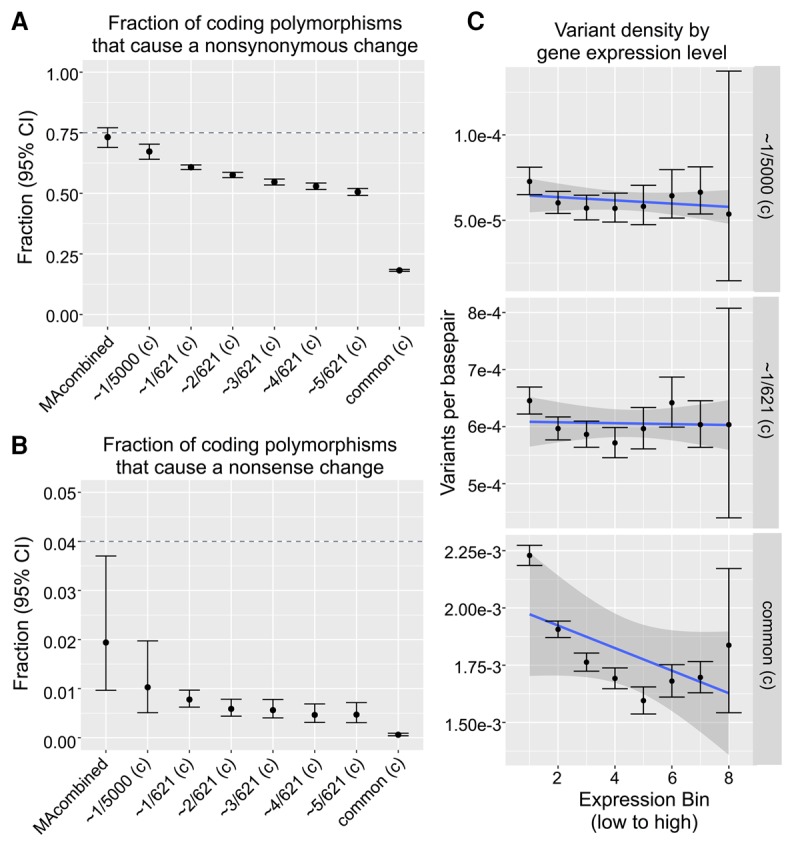
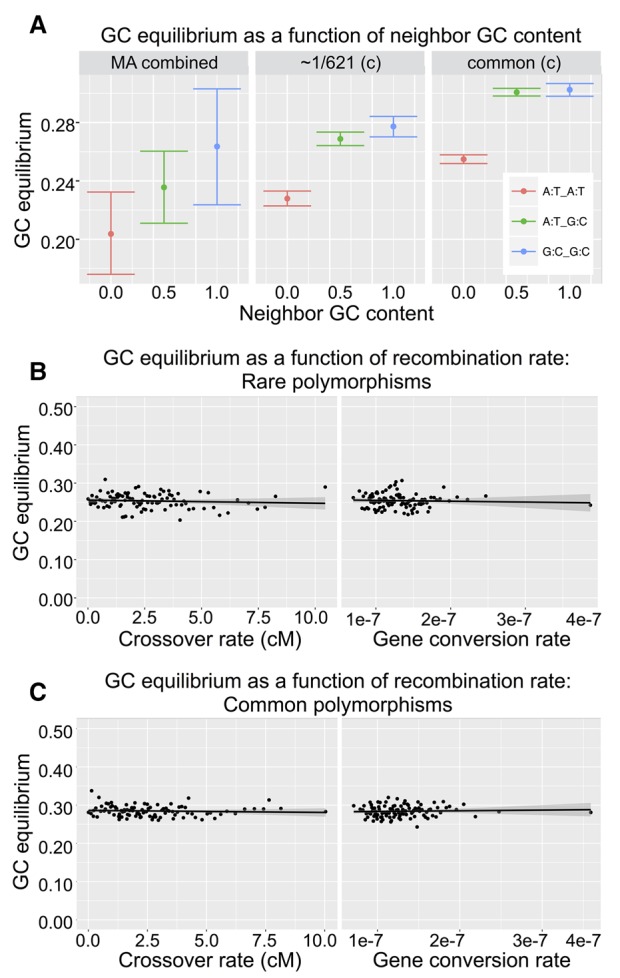
Mutations provide the raw material of evolution, and thus our ability to study evolution depends fundamentally on having precise measurements of mutational rates and patterns. We generate a data set for this purpose using (1) de novo mutations from mutation accumulation experiments and (2) extremely rare polymorphisms from natural populations. The first, mutation accumulation (MA) lines are the product of maintaining flies in tiny populations for many generations, therefore rendering natural selection ineffective and allowing new mutations to accrue in the genome. The second, rare genetic variation from natural populations allows the study of mutation because extremely rare polymorphisms are relatively unaffected by the filter of natural selection. We use both methods in Drosophila melanogaster, first generating our own novel data set of sequenced MA lines and performing a meta-analysis of all published MA mutations (∼2000 events) and then identifying a high quality set of ∼70,000 extremely rare (≤0.1%) polymorphisms that are fully validated with resequencing. We use these data sets to precisely measure mutational rates and patterns. Highlights of our results include: a high rate of multinucleotide mutation events at both short (∼5 bp) and long (∼1 kb) genomic distances, showing that mutation drives GC content lower in already GC-poor regions, and using our precise context-dependent mutation rates to predict long-term evolutionary patterns at synonymous sites. We also show that de novo mutations from independent MA experiments display similar patterns of single nucleotide mutation and well match the patterns of mutation found in natural populations.


Figures

Figure 1.
Figure 1.
A summary of the experimental design and results for the single base pair mutation rate in this study. (A) Diagram depicting the general crossing schemes used in heterozygous (left) and homozygous (right) mutation accumulation, where this study used the heterozygous design. (B) QQ plot of the quantiles of the mutation counts on each chromosome arm of each strain, plotted against the quantiles of a Poisson distribution with mean taken from the mean counts in the MA experiment, where color indicates the generation sequenced (green = generation 36, purple = generation 53). (C) Mutation rates estimated for each chromosomal arm (Pearson's χ2 test of independence, χ2 = 2.55, df = 3, P-value = 0.47). (D) Mutation rates estimated for each strain, where color indicates the generation sequenced (Pearson's χ2 test of independence, χ2 = 7.99, df = 14, P-value = 0.89).
Figure 2.
Figure 2.
A summary of comparisons conducted between the five different MA experiments, including (A) the fraction of coding mutations which cause nonsynonymous changes, where the dotted line indicates the neutral expectation of 75%, (B) the fraction of coding mutations which cause nonsense changes, where the dotted line indicates the neutral expectation of 4%, (C) the empirical cumulative distribution for phastCons scores within each MA experiment, (D) the six relative mutation rates (i.e., sum to 1) within all nonrepetitive regions, and (E) the six relative mutation rates calculated across different triplet base contexts, within all nonrepetitive regions.
Figure 3.
Figure 3.
Pipeline for identification and validation of rare polymorphisms. Step 1 data set is from the Drosophila Genome Nexus (DGN) (Lack et al. 2015) which represent predominantly monoallelic genomes (i.e., either haploid or inbred) from 35 populations across three continents that were sequenced to high depth and underwent the same iterative mapping pipeline before variant calling. Step 2 data set consists of pooled sequencing data generated by our and collaborating labs which collectively represent >4000 genomes from the eastern US and Europe. Step 3 data set is resequence data made available by the Drosophila Genetic Reference Panel (DGRP) (Mackay et al. 2012) and DPGP1 (http://www.dpgp.org/1K_50genomes.html#Reference_Release_1.0; SRA accession number PRJNA3009) projects, which used Roche454 and Illumina technology (respectively) to independently resequence 29 of the strains present in the DGN.
Figure 4.
Figure 4.
Rare polymorphisms approach the neutral expectation in terms of (A) the fraction of events causing nonsynoymous changes, (B) the fraction of events causing nonsense changes, and in (C) where, unlike common polymorphisms, rare polymorphisms occur within transcribed regions at a rate insensitive to levels of germline expression.
Figure 5.
Figure 5.
Six relative rates. (A) Schematic of how fourfold synonymous sites were chosen: The center base of the triplet acquired a substitution on the D. melanogaster branch and is conserved in the rest of the Drosophila tree, and the outer bases of the triplet are conserved across the entire Drosophila tree. (B) Six relative rates within singletons (∼1(c)/621) calculated across different triplet contexts in nonrepetitive regions, and (C) six relative rates within substitutions at fourfold synonymous sites, calculated across different triplet contexts. Note that the six relative rates within C are significantly closer to the six relative rates within B than is expected by chance (P < 0.001), indicating that mutational patterns within rare polymorphisms have predictive power for evolution at synonymous sites.
Figure 6.
Figure 6.
GC equilibrium. (A) The GC equilibrium in nonrepetitive regions as a function of the GC content of neighboring bases, within MA, singletons, and common polymorphisms. (B) GC equilibrium (using singletons ∼1(c)/621) in nonrepetitive regions as a function of the recombination rate, and (C) GC equilibrium (using common(c) polymorphisms) in nonrepetitive regions as a function of the recombination rate.
Figure 7.
Figure 7.
Multinucleotide mutations occur more often than is expected by chance. (A) Histogram of nearest neighbor distance, where every singleton (freq ∼ 1/621) was assigned the distance which was the shorter of the two distances on either side (within a given individual). The expectation is taken from the average of 500 permutations of sample IDs. Note that a 1–4 bp distance corresponds to a cluster of size 2–5 bp. (B) Quantile-quantile plot of distances between consecutive singletons (on both sides of singletons, within an individual), using 1% quantiles (beginning at 0.5%). The expectation is taken from an exponential distribution with a rate equal to the rate within the observed data. The purple inset shows a magnified view of the 0.5%–8.5% quantiles, such that the enrichment of multinucleotide mutations can be seen in the vertically plotted points at the start of the distribution.

Similar articles

Cited by

References

    1. Achaz G. 2008. Testing for neutrality in samples with sequencing errors. Genetics 179: 1409–1424. - PMC - PubMed
    1. Aggarwala V, Voight BF. 2016. An expanded sequence context model broadly explains variability in polymorphism levels across the human genome. Nat Genet 48: 349–355. - PMC - PubMed
    1. Arbeithuber B, Betancourt AJ, Ebner T, Tiemann-Boege I. 2015. Crossovers are associated with mutation and biased gene conversion at recombination hotspots. Proc Natl Acad Sci 112: 2109–2114. - PMC - PubMed
    1. Behringer MG, Hall DW. 2016a. Genome-wide estimates of mutation rates and spectrum in Schizosaccharomyces pombe indicate CpG sites are highly mutagenic despite the absence of DNA methylation. G3 (Bethesda) 6: 149–160. - PMC - PubMed
    1. Behringer MG, Hall DW. 2016b. The repeatability of genome-wide mutation rate and spectrum estimates. Curr Genet 62: 507–512. - PMC - PubMed

Publication types

LinkOut - more resources