Monitoring disease activity in multiple sclerosis using serum neurofilament light protein
- PMID: 29079686
- PMCID: PMC5705244
- DOI: 10.1212/WNL.0000000000004683
Monitoring disease activity in multiple sclerosis using serum neurofilament light protein
Abstract
Objective: To examine the effects of disease activity, disability, and disease-modifying therapies (DMTs) on serum neurofilament light (NFL) and the correlation between NFL concentrations in serum and CSF in multiple sclerosis (MS).
Methods: NFL concentrations were measured in paired serum and CSF samples (n = 521) from 373 participants: 286 had MS, 45 had other neurologic conditions, and 42 were healthy controls (HCs). In 138 patients with MS, the serum and CSF samples were obtained before and after DMT treatment with a median interval of 12 months. The CSF NFL concentration was measured with the UmanDiagnostics NF-light enzyme-linked immunosorbent assay. The serum NFL concentration was measured with an in-house ultrasensitive single-molecule array assay.
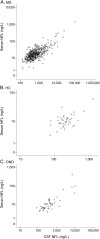
Results: In MS, the correlation between serum and CSF NFL was r = 0.62 (p < 0.001). Serum concentrations were significantly higher in patients with relapsing-remitting MS (16.9 ng/L) and in patients with progressive MS (23 ng/L) than in HCs (10.5 ng/L, p < 0.001 and p < 0.001, respectively). Treatment with DMT reduced median serum NFL levels from 18.6 (interquartile range [IQR] 12.6-32.7) ng/L to 15.7 (IQR 9.6-22.7) ng/L (p < 0.001). Patients with relapse or with radiologic activity had significantly higher serum NFL levels than those in remission (p < 0.001) or those without new lesions on MRI (p < 0.001).
Conclusions: Serum and CSF NFL levels were highly correlated, indicating that blood sampling can replace CSF taps for this particular marker. Disease activity and DMT had similar effects on serum and CSF NFL concentrations. Repeated NFL determinations in peripheral blood for detecting axonal damage may represent new possibilities in MS monitoring.
Copyright © 2017 The Author(s). Published by Wolters Kluwer Health, Inc. on behalf of the American Academy of Neurology.
Figures


References
-
- Norgren N, Rosengren L, Stigbrand T. Elevated neurofilament levels in neurological diseases. Brain Res 2003;987:25–31. - PubMed
-
- Trapp BD, Peterson J, Ransohoff RM, Rudick R, Mork S, Bo L. Axonal transection in the lesions of multiple sclerosis. N Engl J Med 1998;338:278–285. - PubMed
-
- Axelsson M, Malmestrom C, Gunnarsson M, et al. Immunosuppressive therapy reduces axonal damage in progressive multiple sclerosis. Mult Scler 2014;20:43–50. - PubMed
-
- Gunnarsson M, Malmestrom C, Axelsson M, et al. Axonal damage in relapsing multiple sclerosis is markedly reduced by natalizumab. Ann Neurol 2011;69:83–89. - PubMed
Publication types
MeSH terms
Substances
LinkOut - more resources
Full Text Sources
Other Literature Sources
Medical
Research Materials
Miscellaneous
