. 2017 Oct 27;7(1):14248.
doi: 10.1038/s41598-017-14755-5.

Assessment of Variability in the SOMAscan Assay

Affiliations

Assessment of Variability in the SOMAscan Assay

Julián Candia et al. Sci Rep. .

Abstract

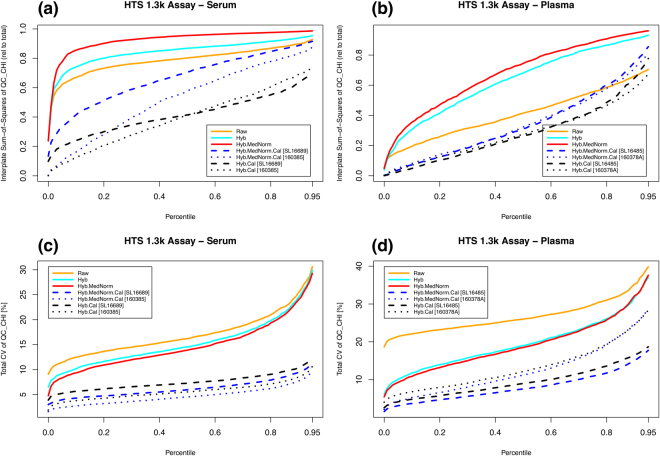
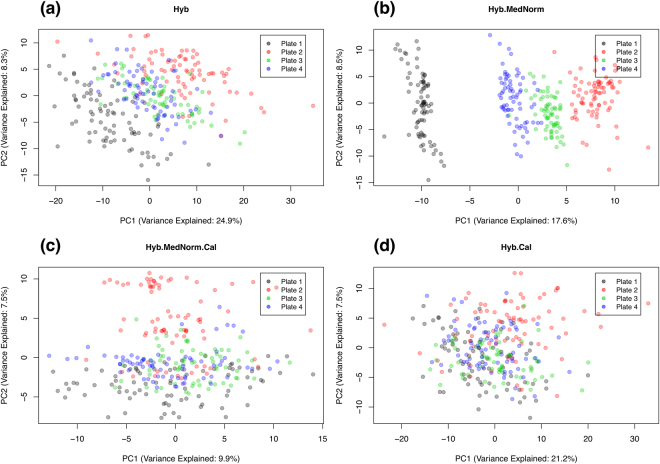
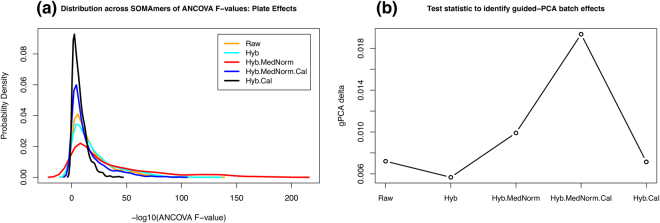
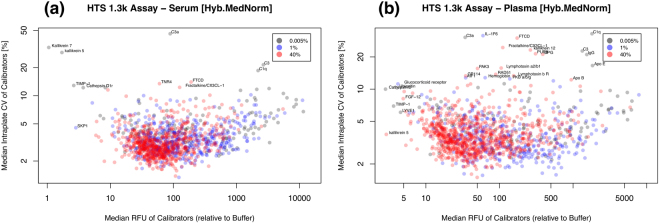
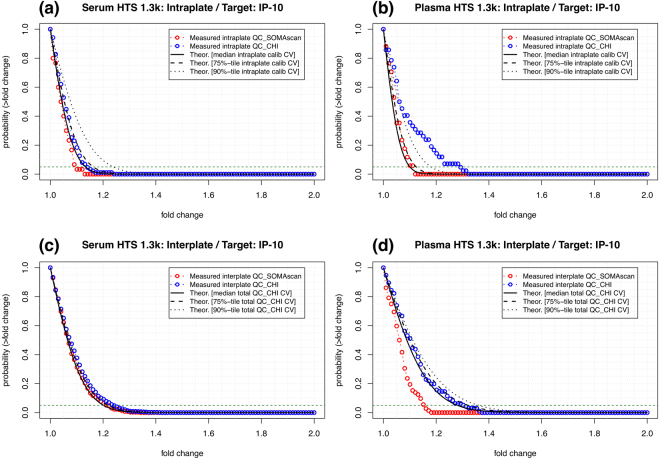
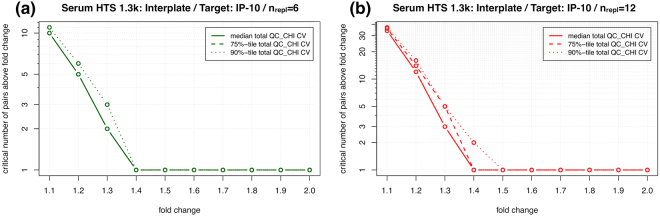
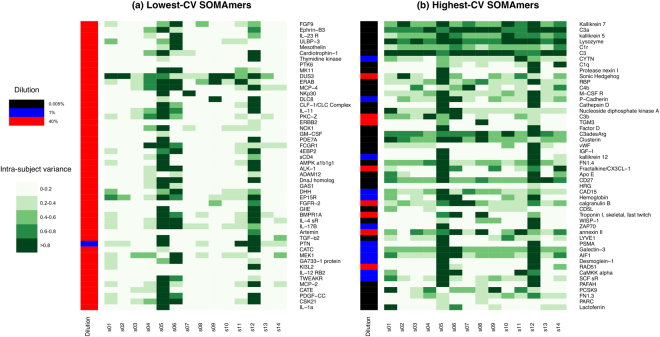
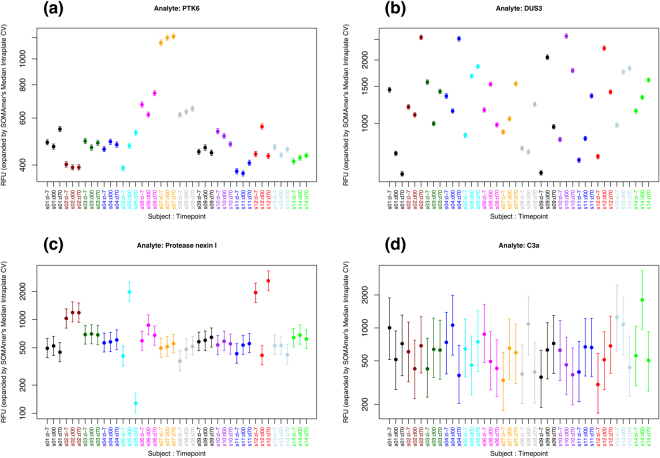
SOMAscan is an aptamer-based proteomics assay capable of measuring 1,305 human protein analytes in serum, plasma, and other biological matrices with high sensitivity and specificity. In this work, we present a comprehensive meta-analysis of performance based on multiple serum and plasma runs using the current 1.3 k assay, as well as the previous 1.1 k version. We discuss normalization procedures and examine different strategies to minimize intra- and interplate nuisance effects. We implement a meta-analysis based on calibrator samples to characterize the coefficient of variation and signal-over-background intensity of each protein analyte. By incorporating coefficient of variation estimates into a theoretical model of statistical variability, we also provide a framework to enable rigorous statistical tests of significance in intervention studies and clinical trials, as well as quality control within and across laboratories. Furthermore, we investigate the stability of healthy subject baselines and determine the set of analytes that exhibit biologically stable baselines after technical variability is factored in. This work is accompanied by an interactive web-based tool, an initiative with the potential to become the cornerstone of a regularly updated, high quality repository with data sharing, reproducibility, and reusability as ultimate goals.


Conflict of interest statement

B.S. is a former SomaLogic, Inc. (Boulder, CO, USA) employee and a company shareholder. The remaining authors have no competing interests to declare.

Figures

Figure 1
Figure 1
Assessment of data normalization for the HTS 1.3 k Assay. Top panels: Percentile distributions (across all SOMAmers) of the interplate Sum-of-Squares (relative to total SoS) for the bridge sample QC_CHI in (a) serum and (b) plasma. Bottom panels: Percentile distributions (across all SOMAmers) of the total CV for the bridge sample QC_CHI in (c) serum and (d) plasma.
Figure 2
Figure 2
Principal component analysis of serum samples from a multiplate longitudinal study to explore response to an Adenovirus Type 4-Influenza H5 recombinant vaccine. Different normalizations are compared, as indicated. Data were generated with the HTS 1.3 k Assay.
Figure 3
Figure 3
Quantitative assessments of plate effects: (a) Distribution of ANCOVA F-values across all SOMAmers; (b) guided-PCA delta statistic. Data were generated with the HTS 1.3 k Assay.
Figure 4
Figure 4
Median intraplate CV of calibrators as a function of the median intraplate RFU relative to buffer for (a) serum and (b) plasma. Data were generated with the HTS 1.3 k Assay and normalized by Hyb.MedNorm.
Figure 5
Figure 5
Probability that two replicate measurements of IP-10 will differ by a factor larger than a given fold change. Theoretical estimates (based on Eq. (6)) are compared to pairs of replicates among QC_SOMAscan and QC_CHI quality control samples. Top panels: Intraplate probability in (a) serum and (b) plasma. Bottom panels: Interplate probability in (c) serum and (d) plasma. Data were generated with the HTS 1.3k Assay and normalized by (a,b) Hyb.MedNorm and (c,d) Hyb.MedNorm.Cal, respectively.
Figure 6
Figure 6
Critical number of IP-10 pairs above fold change in serum for different interplate replicate numbers: (a) n repl = 6 and (b) n repl = 12. If the number of pairwise fold change ratios from a study is equal or larger than these critical values, the assay’s technical variability is larger than expected based on our data repository.
Figure 7
Figure 7
Top-50 SOMAmers of (a) lowest and (b) highest technical CV were individually assessed for biological intra-subject baseline variability across a cohort of 14 healthy subjects. In different shades of green, the heatmaps display, for each SOMAmer (row), the ratio between the variance of the expanded data associated to one subject and the variance of all subjects combined. Sidebars to the left of each panel display the SOMAmers’ dilution groups.
Figure 8
Figure 8
Intra- vs inter-subject variability of expanded subject/timepoint datasets for selected SOMAmers: (a) PTK6 (CV = 1.38%), (b) DUS3 (CV = 1.45%), (c) Protease Nexin I (CV = 14.6%), (d) C3a (CV = 39.2%). Vertical bars show the 5th to 95th percentile range of the expanded datasets.

References

    1. Gold L, et al. Aptamer-based multiplexed proteomic technology for biomarker discovery. PLoS One. 2010;5:e15004. doi: 10.1371/journal.pone.0015004. - DOI - PMC - PubMed
    1. Ostroff RM, et al. Unlocking biomarker discovery: large scale application of aptamer proteomic technology for early detection of lung cancer. PLoS One. 2010;5:e15003. doi: 10.1371/journal.pone.0015003. - DOI - PMC - PubMed
    1. Mehan MR, et al. Protein signature of lung cancer tissues. PLoS One. 2012;7:e35157. doi: 10.1371/journal.pone.0035157. - DOI - PMC - PubMed
    1. Mehan MR, et al. Validation of a blood protein signature for non-small cell lung cancer. Clinical Proteomics. 2014;11:32. doi: 10.1186/1559-0275-11-32. - DOI - PMC - PubMed
    1. Kiddle S, et al. Candidate blood proteome markers of alzheimer’s disease onset and progression: a systematic review and replication study. Journal of Alzheimer’s Disease. 2013;38:515–531. - PubMed

Publication types