. 2017 Oct 27;7(1):14238.
doi: 10.1038/s41598-017-14506-6.

Nanog-driven cell-reprogramming and self-renewal maintenance in Ptch1 +/- granule cell precursors after radiation injury

Affiliations

Nanog-driven cell-reprogramming and self-renewal maintenance in Ptch1 +/- granule cell precursors after radiation injury

Barbara Tanno et al. Sci Rep. .

Abstract

Medulloblastoma (MB) is the most common pediatric brain tumor, comprising four distinct molecular variants, one of which characterized by activation of the Sonic Hedgehog (SHH) pathway, driving 25-30% of sporadic MB. SHH-dependent MBs arise from granule cell precursors (GCPs), are fatal in 40-70% of cases and radioresistance strongly contributes to poor prognosis and tumor recurrence. Patched1 heterozygous (Ptch1 +/-) mice, carrying a germ-line heterozygous inactivating mutation in the Ptch1 gene, the Shh receptor and negative regulator of the pathway, are uniquely susceptible to MB development after radiation damage in neonatal cerebellum. Here, we irradiated ex-vivo GCPs isolated from cerebella of neonatal WT and Ptch1 +/- mice. Our results highlight a less differentiated status of Ptch1-mutated cells after irradiation, influencing DNA damage response. Increased expression levels of pluripotency genes Nanog, Oct4 and Sal4, together with greater clonogenic potential, clearly suggest that radiation induces expansion of the stem-like cell compartment through cell-reprogramming and self-renewal maintenance, and that this mechanism is strongly dependent on Nanog. These results contribute to clarify the molecular mechanisms that control radiation-induced Shh-mediated tumorigenesis and may suggest Nanog as a potential target to inhibit for adjuvant radiotherapy in treatment of SHH-dependent MB.


Conflict of interest statement

The authors declare that they have no competing interests.

Figures

Figure 1
Figure 1
(a) Temporal determination of γ-H2AX positive cells by Flow Cytometric Analysis in unirradiated and irradiated WT and Ptch1 +/− GCPs. Representative results from three independent experiments are shown. (b) Apoptotic rate measured by Caspase-Glo® 3/7 Assay in unirradiated GCPs of both genotypes at different times after irradiation. The results of triplicate assays are expressed as mean ± SD relative to WT GCPs, taken as 100. ***P < 0.001.
Figure 2
Figure 2
Relative mRNA expression levels of p21 (a) and p53 (b) in unirradiated WT and Ptch1 +/− GCPs and in irradiated GCPs 4 hours after irradiation with 1 Gy of X-rays. (c) Western blot analysis and relative densitometry of p21, Bax and Bcl2 expression. Band intensities were normalized against Hsp90. ***P < 0.001. Uncropped Western blot gels related to this figure are displayed in Suppl. Fig. S1.
Figure 3
Figure 3
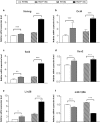
Relative mRNA expression levels of stem cell transcription factors Nanog (a), Oct4 (b), Sal4 (c) and Sox2 (d) in unirradiated WT and Ptch1 +/− GCPs and in irradiated GCPs 4 hours after irradiation with 1 Gy of X-rays. (e) Relative mRNA expression levels of Lin28, a RNA binding protein, and of the neurogenic miR-125b (f). Results are expressed as mean ± SD of three biological replicates. Expression levels of WT GCPs are taken as 1. *P ≤ 0.05; **P ≤ 0.01; *** P ≤ 0.001.
Figure 4
Figure 4
Representative images of neurospheres obtained from 300 seeded WT and Ptch1 +/− GCPs in unirradiated and irradiated conditions. Bars = 100 μm. (a) The number of neurospheres shown in (b) are presented as mean values ± SD of results derived from biological triplicate experiments. Neurosphere areas shown in (c) were measured in phase-contrast images using LASCore software and data are presented as mean values ± SD of results derived from two biological replicates. *P ≤ 0.05.
Figure 5
Figure 5
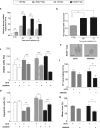
Kinetics of Nanog mRNA expression at different times after irradiation in WT and Ptch1 +/− GCPs (a). Densitometric analysis of Gli1 protein expression in Ptch1 +/− GCPs 48 and 72 hrs post-irradiation (b). Cell viability (c) and apoptotic assay (d) in WT and Ptch1 +/− GCPs after transfection with control siRNA (siCTR) or Nanog siRNA (siNanog) in unirradiated and irradiated conditions. Expression levels in WT siCTR untreated cells are taken as 100. (e–g) Quantitative and dimensional analysis of neurospheres obtained from unirradiated and irradiated Ptch1 +/− GCPs after silencing of Nanog expression (e; right panel) or treated with control siRNA (e; left panel). Bars = 100 μm. The number of neurospheres (f) and their size (g) decreased in siNanog Ptch1 +/− GCPs compared with siCTR Ptch1 +/−. Values in siCTR untreated cells are taken as 100. *P ≤ 0.05; **P ≤ 0.01; ***P ≤ 0.001.
Figure 6
Figure 6
Dimensional analysis of cerebellar midsagittal sections from unirradiated and irradiated WT (a) and Ptch1 +/− (b) mouse cerebella at different ages of postnatal development. (c) Relative Nanog mRNA expression levels in WT and Ptch1 +/− GCPs at 4 hours after irradiation with increasing doses of X-rays, relative to unirradiated GCPs. (d) Relative Nanog mRNA expression levels in the cerebellum of adult Ptch1 +/− (n = 4), and in spontaneous (n = 9) and radio-induced (n = 11) MBs. *P ≤ 0.05; **P ≤ 0.01; ***P ≤ 0.001.
Figure 7
Figure 7
Graphic highlight of results. Nanog controls the DNA damage response of GCPs, influencing also the expansion of the stem-like cell compartment through cell-reprogramming and self-renewal maintenance after radiogenic insult. In Ptch1-mutated cells, the magnified Nanog-driven expansion of a highly unstable stem-like cell compartment, due to the accumulation of DNA damage, could be strictly related to the dramatically high MB incidence that characterizes the Ptch1 +/− mouse model in response to radiation.

Similar articles

Cited by

References

    1. Massimino M, et al. Childhood medulloblastoma. Crit. Rev. Oncol. Hematol. 2016;105:35–51. doi: 10.1016/j.critrevonc.2016.05.012. - DOI - PubMed
    1. Yang ZY, et al. Medulloblastoma can be initiated by deletion of Patched in lineage-restricted progenitors or stem cells. Cancer Cell. 2008;14:135–145. doi: 10.1016/j.ccr.2008.07.003. - DOI - PMC - PubMed
    1. Singh SK, et al. Identification of a cancer stem cell in human brain tumors. Cancer Res. 2003;63:5821–5828. - PubMed
    1. Chen K, Huang YH, Chen JL. Understanding and targeting cancer stem cells: therapeutic implications and challenges. Acta Pharmacologica Sinica. 2013;34:732–740. doi: 10.1038/aps.2013.27. - DOI - PMC - PubMed
    1. Ahn S, Joyner AL. In vivo analysis of quiescent adult neural stem cells responding to Sonic hedgehog. Nature. 2005;437:894–897. doi: 10.1038/nature03994. - DOI - PubMed

Publication types

MeSH terms