. 2017 Oct 27;7(1):14225.
doi: 10.1038/s41598-017-14676-3.

Comprehensive single-cell transcriptome analysis reveals heterogeneity in endometrioid adenocarcinoma tissues

Affiliations

Comprehensive single-cell transcriptome analysis reveals heterogeneity in endometrioid adenocarcinoma tissues

Shinichi Hashimoto et al. Sci Rep. .

Abstract

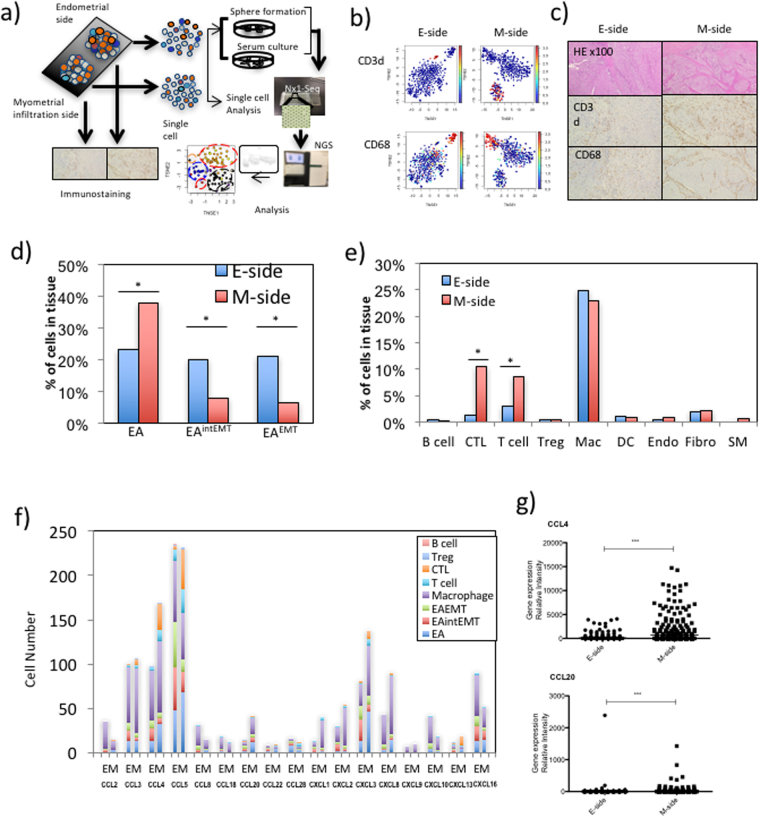
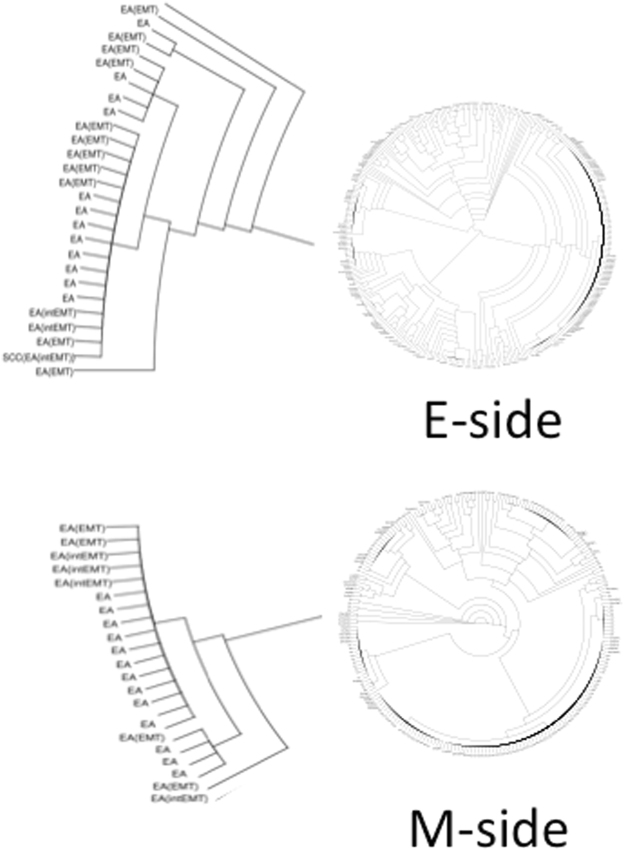
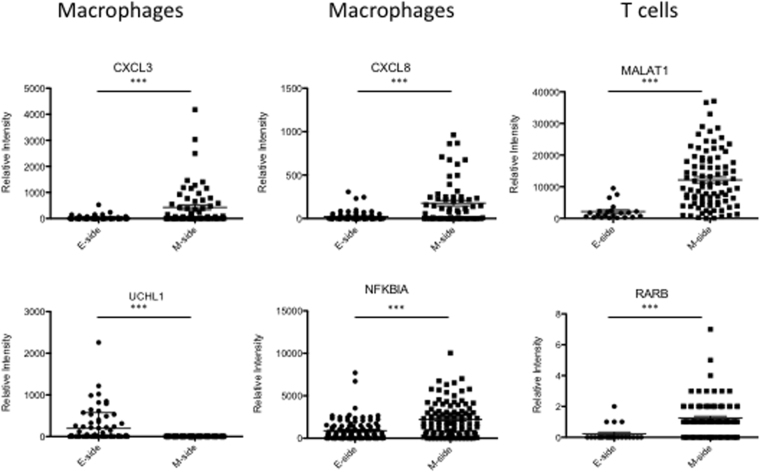
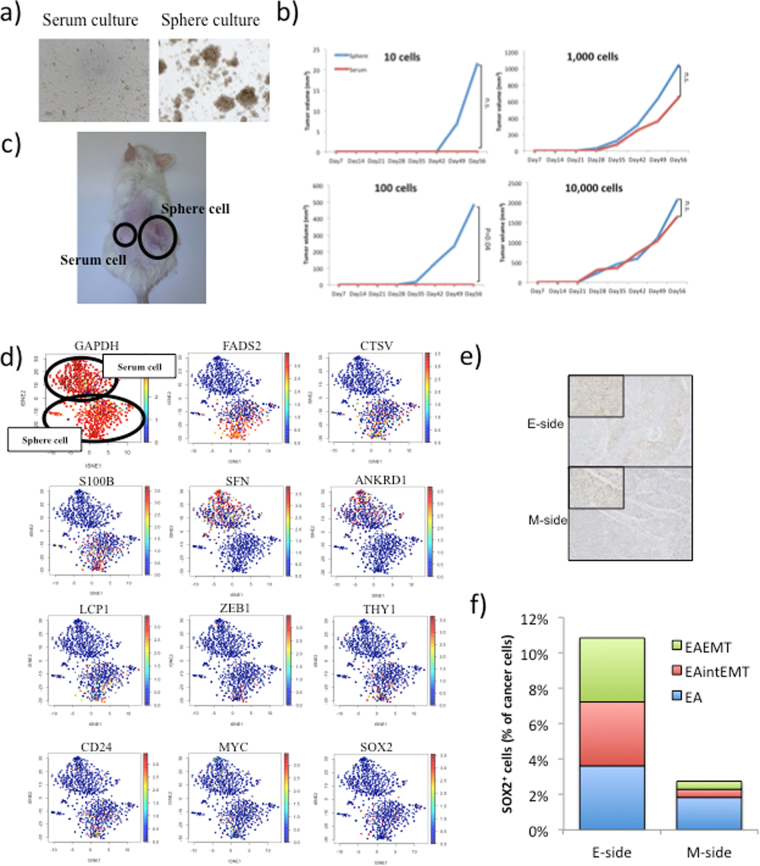
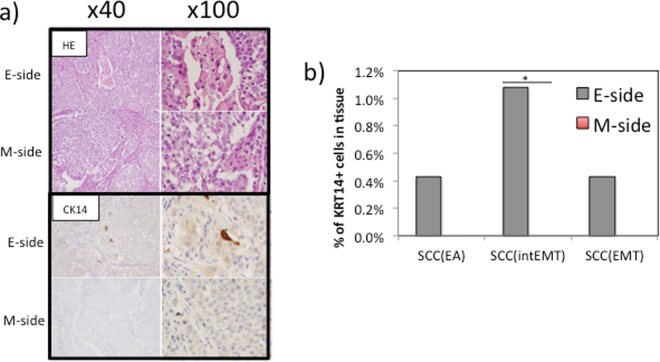
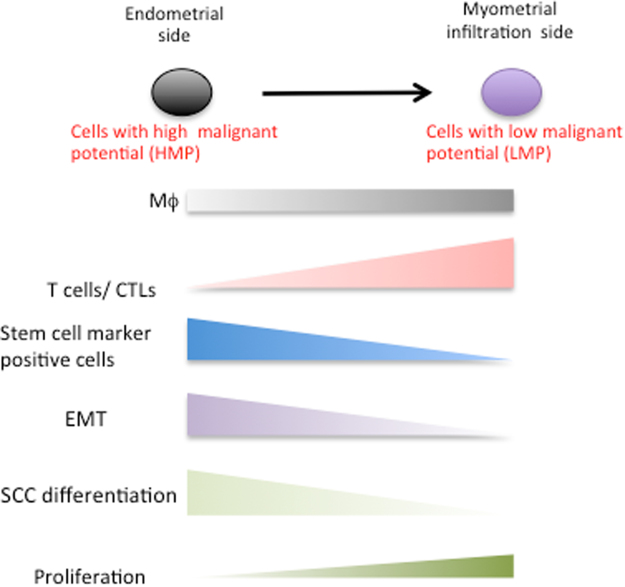
Single cell transcriptome analysis of a cancer tissue can provide objective assessment of subtype population or the activation of each of various microenvironment component cells. In this study, we applied our newly developed technique of single cell analysis to the myometrial infiltration side (M-side) and the endometrial side (E-side) of a human endometrioid adenocarcinoma with squamous differentiation tissues. We also analyzed spherogenic cultures derived from the same tissue to identify putative regulators of stemness in vivo. Cancer cells in the E-side were highly malignant compared with those in the M-side. Many cells on the E-side were positive for spheroid-specific tumorigenesis-related markers including SOX2. In addition, there were higher numbers of epithelial-to-mesenchymal transition (EMT) cells in the E-side compared with the M-side. This study identified a site containing cells with high malignant potential such as EMT and cancer stem-like cells in cancer tissues. Finally, we demonstrate that established endometrioid adenocarcinoma subtype classifiers were variably expressed across individual cells within a tumor. Thus, such intratumoral heterogeneity may be related to prognostic implications.


Conflict of interest statement

The authors declare that they have no competing interests.

Figures

Figure 1
Figure 1
Sensitivity and reproducibility and of Nx1-seq. (a) Correlation between gene expression analysis in Nx1-seq and bulk serial analysis of gene expression methods with the PC9 cell line. The correlation was performed using log transformed data. (b) Comparison of Nx1-seq gene expression measurements (average of 50 single PC9 cell data) between two independent experiments. (c) Comparison of Nx1-seq gene expression measurements between two independent PC9 cells. (d) Nx1-seq analysis of mixtures of human and mouse cells. Mixtures of human (PC9) and mouse (LLC) cells were analyzed by Nx1-seq. The scatter plot shows the number of human and mouse transcripts associated with each read/cell. (e)Number reads and (f) genes detected in single-cell libraries generated by Nx1-seq or Drop-seq (ref.). Using Nx1-seq (Drop-seq), an average depth of 119,833 per LLC cell and 124,290 (118,691) reads 3T3 cell or 5,919, 5,363 (5,847) genes were detected among mouse LLC and NIH3T3 cells (n = 50 for Nx1-seq; n = 50 for Drop-seq). (g) Clustering of 300 human peripheral blood mononuclear cells (PBMC) analyzed by Nx1-seq.
Figure 2
Figure 2
Heterogeneity of tumor tissues. (a) The workflow shows the rapid dissociation of cells from two sites of a primary tumor to generate single cells and sphere cells. The obtained cells were then analyzed by Nx1-seq and by histopathological analysis. (b) Clustering analysis. t-SNE map representation of transcriptome similarities between individual cells. The upper two panels represent T cells (red) from the E-side and the M-side, while the lower two panels represent macrophages (red) from each side. (c) Immunohistostaining of endometrial adenocarcinoma at the myoinvasive state. The endometrial side and myoinvasive tumor side were stained using specific antibodies. (d) Heterogeneity of cancer cells. EA, EAintEMT and EAEMT cells were defined as described in the Materials and Methods. *p < 0.05 for the E-side versus M-side by the Mann–Whitney U-test. (e) Cells infiltrating into tumor tissues. These cells were defined as described in the Materials and Methods. *p < 0.05 for the E-side versus M-side by the the Mann–Whitney U-test. (f) Chemokine production in cancer cells and infiltrating immune cells in each side. (g) Comparison of CCL4 and CCL20 expressing cells between the E-side and the M-side. These data were calculated using cells extracted from defined cell data shown in Supplementary Table 2. ***p < 0.001 for the E-side versus M-side by the Mann–Whitney U-test.
Figure 3
Figure 3
Clustering of cancer cells. We performed an unsupervised cluster analysis using the Nx1-seq data to determine to what degree the two sides of the cancer tissue could be distinguished for EA, EMT[intEMT] and EA[EMT] types. Notably, there was not complete separation of these three cancer types, indicating that each single cell became a single EAEMT during the growth of cancer. Enlarged view shows one example.
Figure 4
Figure 4
Differentially expressed genes in the infiltrating immune cells in the E-side and M-side. Comparison of each gene-expressing cell between the E-side and M-side. These data were calculated using cells extracted from defined cell data shown in Supplementary Table 2. ***p < 0.001 for the E-side versus M-side by the Mann–Whitney U-test.
Figure 5
Figure 5
Characterization of sphere cells derived from the primary tumor and the patterns of gene expression. (a) Sph cells (sphere culture) and Ser cells (serum culture) were cultured in suspension for 1 week and then transferred to attachment conditions. (b) Tumor growth in mice injected with Sph cells and Ser cells. Data are shown as the means ± SD. All statistical analyses for data in this figure were performed using a paired Student’s t-test. (c) Tumorigenicity of Sph cells at the subcutaneous injection site. Sph cells and Ser cells were injected into NOD/SCID mice at 1 × 102 cells/mouse. (d) t-SNE map representation of transcriptome similarities between individual Sph cells and Ser cells. Red dots show cells positive for the indicated gene. (e) Immunohistostaining for SOX2 positive cells in the E-side and the M-side. Original magnification 100x for the insert in the upper left corner and 40x for the remaining area. (f) Percentage of SOX2 positive cells among three types of cancer cells in the E-side and the M-side.
Figure 6
Figure 6
Squamous cell carcinoma from an endometrioid adenocarcinoma shows positive staining for CK14 is present only in the E-side. (a) Hematoxylin and eosin staining of the E-side and M-side (upper) and after the application of the CK14 antibody (lower). A higher number of CK14 positive cells are present in the E-side. Original magnification 40x and 100x. (b) KRT14 positive cells are only present in the E-side. *p < 0.05 for E-side versus M-side by the Mann–Whitney U-test.
Figure 7
Figure 7
Diversity status of the endometrial adenocarcinoma.

References

    1. Esumi S, et al. Method for single-cell microarray analysis and application to gene-expression profiling of GABAergic neuron progenitors. Neurosci Res. 2008;60:439–451. doi: 10.1016/j.neures.2007.12.011. - DOI - PubMed
    1. Sasagawa Y, et al. Quartz-Seq: a highly reproducible and sensitive single-cell RNA sequencing method, reveals non-genetic gene-expression heterogeneity. Genome Biol. 2013;14:R31. doi: 10.1186/gb-2013-14-4-r31. - DOI - PMC - PubMed
    1. Xin Y, et al. Use of the Fluidigm C1 platform for RNA sequencing of single mouse pancreatic islet cells. Proc Natl Acad Sci USA. 2016;113:3293–3298. doi: 10.1073/pnas.1602306113. - DOI - PMC - PubMed
    1. Macosko EZ, et al. Highly Parallel Genome-wide Expression Profiling of Individual Cells Using Nanoliter Droplets. Cell. 2015;161:1202–1214. doi: 10.1016/j.cell.2015.05.002. - DOI - PMC - PubMed
    1. Jaitin DA, et al. Massively parallel single-cell RNA-seq for marker-free decomposition of tissues into cell types. Science. 2014;343:776–779. doi: 10.1126/science.1247651. - DOI - PMC - PubMed

Publication types