. 2017 Oct 27;7(1):14189.
doi: 10.1038/s41598-017-13839-6.

Emergence of early alterations in network oscillations and functional connectivity in a tau seeding mouse model of Alzheimer's disease pathology

Affiliations

Emergence of early alterations in network oscillations and functional connectivity in a tau seeding mouse model of Alzheimer's disease pathology

A Ahnaou et al. Sci Rep. .

Abstract

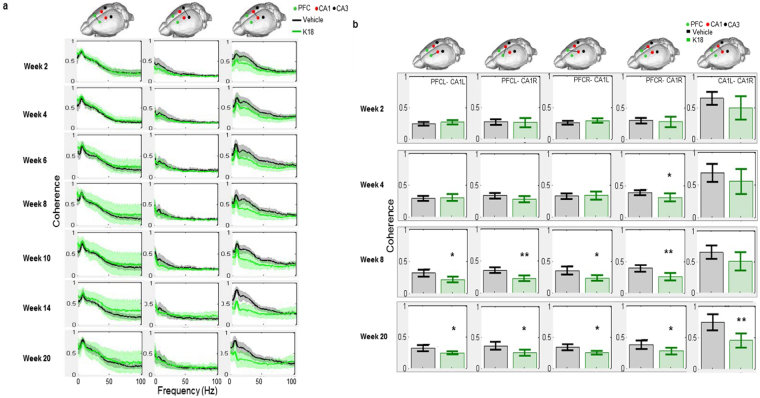
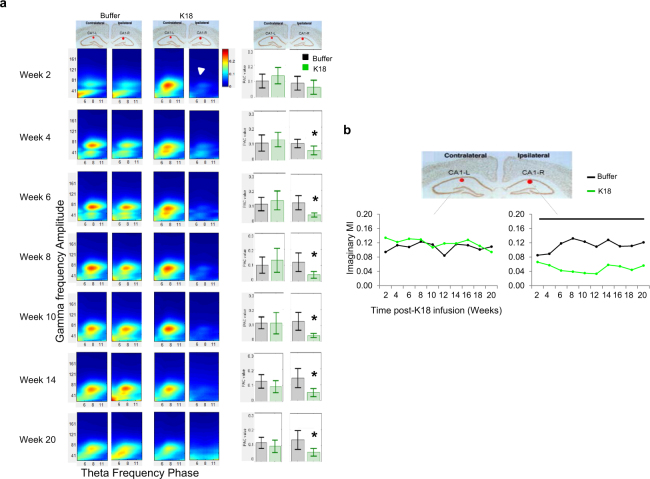
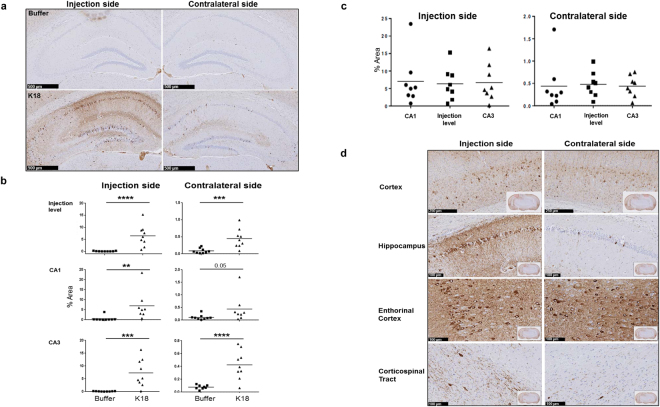
Synaptic dysfunction and disconnectivity are core deficits in Alzheimer's disease (AD), preceding clear changes in histopathology and cognitive functioning. Here, the early and late effects of tau pathology induction on functional network connectivity were investigated in P301L mice. Multichannel EEG oscillations were used to compute (1) coherent activity between the prefrontal cortex (PFC) and hippocampus (HPC) CA1-CA3 networks; (2) phase-amplitude cross frequency coupling (PAC) between theta and gamma oscillations, which is instrumental in adequate cognitive functioning; (3) information processing as assessed by auditory evoked potentials and oscillations in the passive oddball mismatch negativity-like (MMN) paradigm. At the end, the density of tau aggregation and GABA parvalbumin (PV+) interneurons were quantified by immunohistochemistry. Early weakening of EEG theta oscillations and coherent activity were revealed between the PFC and HPC CA1 and drastic impairments in theta-gamma oscillations PAC from week 2 onwards, while PV+ interneurons count was not altered. Moreover, the tau pathology disrupted the MMN complex amplitude and evoked gamma oscillations to standard and deviant stimuli suggesting altered memory formation and recall. The induction of intracellular tau aggregation by tau seed injection results in early altered connectivity and strong theta-gamma oscillations uncoupling, which may be exploited as an early electrophysiological signature of dysfunctional neuronal networks.


Conflict of interest statement

The authors declare that they have no competing interests.

Figures

Figure 1
Figure 1
(a) Cortical (epidural) mean relative EEG power spectra during waking, NREM sleep and REM sleep in buffer controls (black, n = 11, 4 animals were excluded due to mislocation of the injection and electrode sites or signal artefacts) and K18 (green, n = 15) conditions. Note the characteristic increases in relative theta amplitude after the administration of K18, which is clearly evident in all vigilance states starting from 8 weeks post-treatment onwards. Data are presented as mean values ± SEM for buffer (black) and K18 (green) conditions. (b) longitudinal changes in the amplitude at frequency bins centered at 7 and 8 Hz with the time during active waking and NREM sleep as observed in K18 treated animals. ANOVA with post hoc Hochberger’s and Dunnett’s tests.
Figure 2
Figure 2
(a) Longitudinal mean power spectra in 1–100 Hz from HPC-CA1 injection ipsilateral and their contralateral sites over the second week through to the last recordings (weeks 20) post-administration of buffer (black) and K18 (green). (b) Early drop of the power spectra in the slow theta frequency band starting on week 4, which became strong on week 20. Data are presented as mean values ± SEM and black bar above curves indicates interval of significant level difference between buffer (black, n = 9) and K18 (green, n = 8) groups. 3 animals across different conditions were discarded from the analysis because of signal artifacts.
Figure 3
Figure 3
(a) Coherence patterns in contralateral recording sites over 1–100 Hz in buffer controls (black) and K18 (green) conditions from week 2 through to week 20 post-administration. Bar charts showing the mean coherent activity ( ± 95 CI) in the theta frequency range. (b) mean coherent activity in the theta frequency range over weeks 2, 4, 8 and 20. Data are presented as mean values ± SEM for buffer (black, n = 9) and K18 (green, n = 8) groups. 3 animals across different conditions were discarded from the analysis because of signal artifacts. Asteriks indicate significant (*p < 0.05, **p < 0.01) differences.
Figure 4
Figure 4
Representative comodulation Phase-Amplitude maps showing early deficit in theta-gamma phase-amplitude coupling during waking state in recordings from the hippocampal CA1 of K18-treated mice. (a) Bar panels represent mean modulation index (MI) values ± SEM in mice injected with K18 (green) and buffer (black) showing a significant decreased in coupling strength for K18 infused animals as revealed in theta-gamma MI (p < 0.05). (b) Time course of mean MI showing some sustained impairments in the strength of theta-gamma phase-amplitude coupling from the right HPC CA1 of K18 group (green, n = 8) as compared to buffer (black, n = 9) groups. 3 animals across different conditions were discarded from the analysis because of signal artifacts.
Figure 5
Figure 5
(a) Grand averaged auditory evoked waveforms recorded from the frontal right electrodes in the passive oddball (MMN) paradigm with frequency deviants, (b) Post-stimuli peaks changes were estimated over all recording sites N1-P1 and N1-P2 complex amplitudes as well as for N1 component’s amplitude, (c) the power of evoked oscillations in response to standard and deviant stimuli and (d) changes in the evoked 40–80 Hz gamma oscillations. Note the decreased amplitudes and evoked oscillations to both standard and deviant acoustic stimuli may suggest impairments in the encoding and discrimination facilitation of the sound features during information processing. Data are presented as mean values ± SEM for buffer (black, n = 9) and K18 (green, n = 8) groups, 3 animals across different conditions were discarded from the analysis. Mixed effect model ANOVA.
Figure 6
Figure 6
(a) AT8 immunoreactivity ipsilateral and contralateral at the level of HPC-CA1 and CA3 structures, scale bars: 500 µm (b) Quantification of AT8 labeling revealed strong increases of the tau pathology in different areas of the injection side as compared to the contralateral side, (c) total AT8 labeling in the hippocampus and (d) distribution of AT8 labeling in the cortex, hippocampus, enthorinal cortex and corticospinal tract. One way ANOVA, Bonferroni correction for multiple comparisons, significance levels p < 0.05, K18 (n = 9) vs buffer (n = 9). 2 animals across different conditions were discarded from the anlaysis because it was difficult to accurately quantify AT8 in some area. Scale bars: cortex: 250 µm; hippocamps, enthorinal cortex and corticospinal tract: 100 µm.
Figure 7
Figure 7
(a) Immunohistochemical difference in PV+ cells in hippocampal, frontal and entorhinal cortical structures of mice injected with the buffer (upper panel images) or K18 (bottom panel images). (b) Quantification of PV+ cell loss in the cortex and enthorinal cortex. Scatter plot shows no major difference in the average number of PV+ cell loss in cortical structures, whilst limited PV cells were detected in the hippocampus. Accurate quantification of PV+ was difficult in 2 animals, which were discarded from the anlaysis. One way ANOVA, Bonferroni correction for multiple comparisons, significance levels p < 0.05, K18 (n = 8) vs buffer (n = 10). Scale bars 250 and 500 µm.

References

    1. Henry JD, von Hippel W, Molenberghs P, Lee T, Sachdev PS. Clinical assessment of social cognitive function in neurological disorders. Nat Rev Neurol. 2016;12:28–39. doi: 10.1038/nrneurol.2015.229. - DOI - PubMed
    1. Urrestarazu E, Iriarte J. Clinical management of sleep disturbances in Alzheimer’s disease: current and emerging strategies. Nat Sci Sleep. 2016;8:21–33. doi: 10.2147/NSS.S76706. - DOI - PMC - PubMed
    1. Glenner GG, Wong CW. Alzheimer’s disease: initial report of the purification and characterization of a novel cerebrovascular amyloid protein. Biochem Biophys Res Commun. 1984;120:885–90. doi: 10.1016/S0006-291X(84)80190-4. - DOI - PubMed
    1. Grundke-Iqbal I, et al. Abnormal phosphorylation of the microtubule-associated protein tau (tau) in Alzheimer cytoskeletal pathology. Proc Natl Acad Sci USA. 1986;83:4913–7. doi: 10.1073/pnas.83.13.4913. - DOI - PMC - PubMed
    1. Dickerson BC, et al. Alzheimer-signature MRI biomarker predicts AD dementia in cognitively normal adults. Neurology. 2011;76:1395–1402. doi: 10.1212/WNL.0b013e3182166e96. - DOI - PMC - PubMed

MeSH terms