. 2017 Oct 27;8(1):1161.
doi: 10.1038/s41467-017-01350-5.

Taxonomic and functional turnover are decoupled in European peat bogs

Affiliations

Taxonomic and functional turnover are decoupled in European peat bogs

Bjorn J M Robroek et al. Nat Commun. .

Abstract

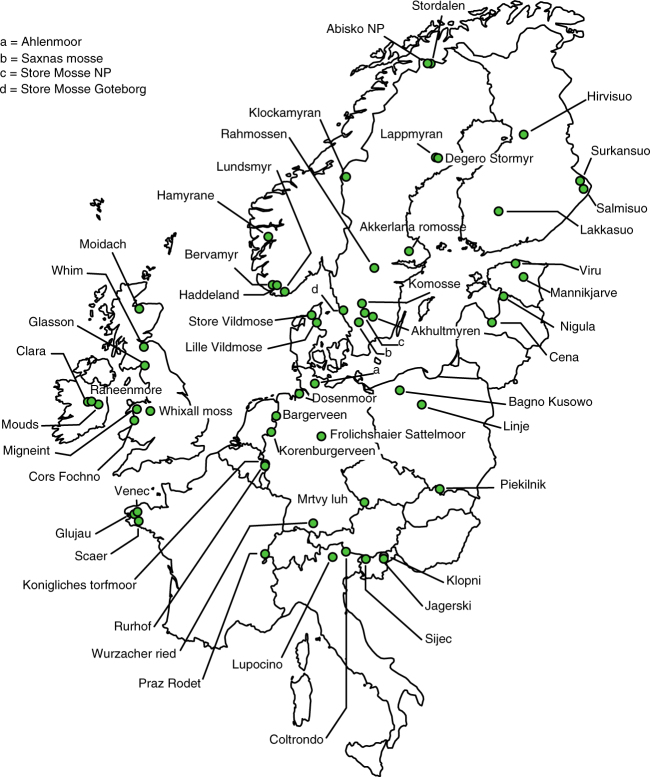
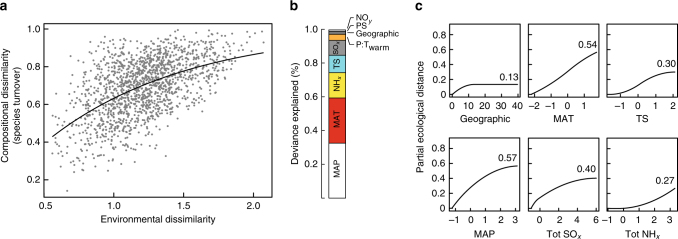
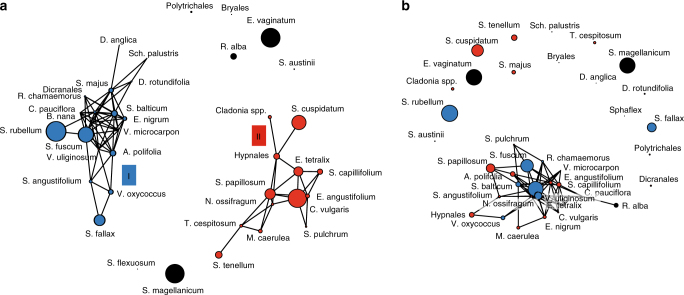
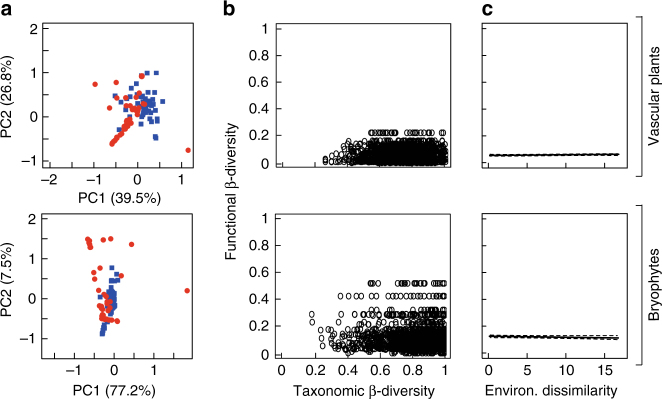
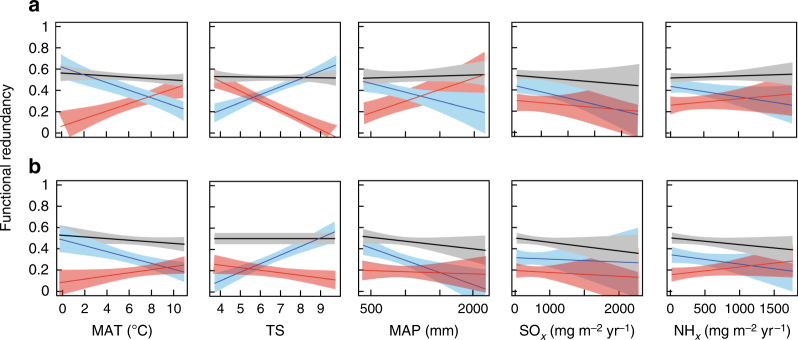
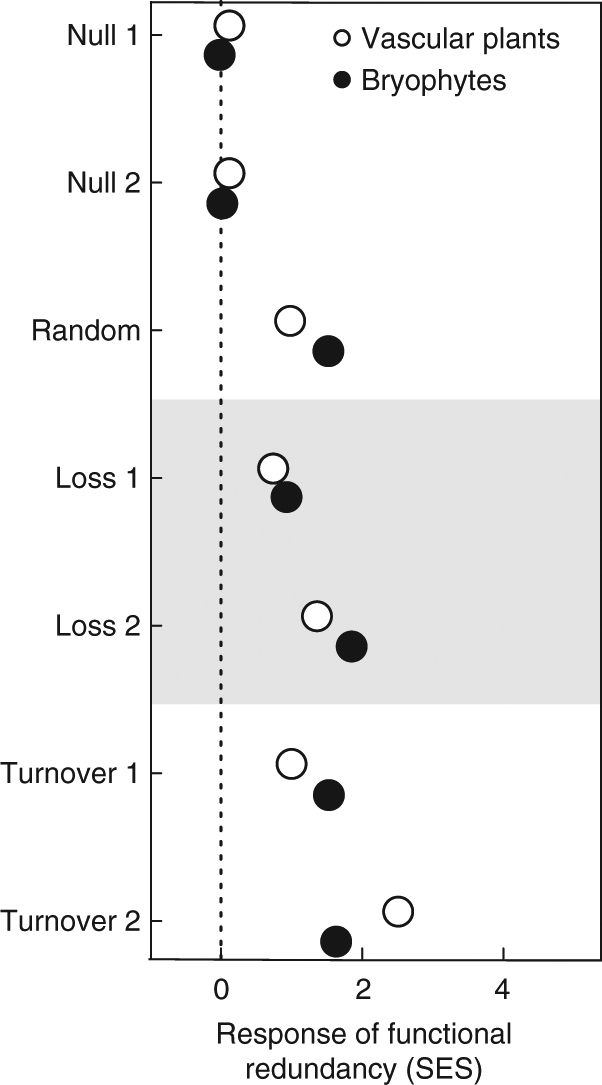
In peatland ecosystems, plant communities mediate a globally significant carbon store. The effects of global environmental change on plant assemblages are expected to be a factor in determining how ecosystem functions such as carbon uptake will respond. Using vegetation data from 56 Sphagnum-dominated peat bogs across Europe, we show that in these ecosystems plant species aggregate into two major clusters that are each defined by shared response to environmental conditions. Across environmental gradients, we find significant taxonomic turnover in both clusters. However, functional identity and functional redundancy of the community as a whole remain unchanged. This strongly suggests that in peat bogs, species turnover across environmental gradients is restricted to functionally similar species. Our results demonstrate that plant taxonomic and functional turnover are decoupled, which may allow these peat bogs to maintain ecosystem functioning when subject to future environmental change.


Conflict of interest statement

All authors declare no competing financial interests.

Figures

Fig. 1
Fig. 1
Geographic locations of the 56 European peat bogs. Distribution of the sampled peat bogs across Europe. Map image source: R package rworldmap
Fig. 2
Fig. 2
Taxonomic turnover along environmental gradients. a Relationship between observed plant community compositional dissimilarity between site pairs (species turnover or β-diversity) and their predicted environmental dissimilarity. The line represents the linear predictor of the regression equation from generalized dissimilarity modelling (GDM, Methods section). b Reduction in deviance explained between full model and model with the environmental variable omitted, i.e., an indicator of the proportion of deviance attributed to that variable. Variables tested were geographical distance, mean annual temperature (MAT), seasonality in temperature (TS), mean annual precipitations (MAP), seasonality in precipitation (PS), ratio of precipitation and temperature of the warmest quarter (P:Twarm), sulphate (SOx), and reduced (NHx) and oxidised (NOx) nitrogen atmospheric depositions. c Partial regression fits (Model-fitted-I-splines) for variables significantly associated with plant community species turnover. Note that we also included geographical distance for reference. The maximum height (inset number) reached by each I-spline curve indicates the relative importance of that variable in explaining beta diversity, keeping all other variables constant (i.e., the partial response curve value). The shape of each function provides an indication of how the rate of compositional turnover varies along the environmental gradient
Fig. 3
Fig. 3
Co-response clusters representing species similar in abundance-environment relationships. a Positive species interactions. b Negative species interactions. Colours represent two distinct co-response clusters (blue = I; red = II), while non-connected (black) points represent cluster-unrelated species. Black lines indicate correlations between species with a correlation coefficient ≥ 0.6. Circle size indicates the averaged abundance of species among all sites. See Supplementary Table 3 for full taxonomic names
Fig. 4
Fig. 4
Functional community composition and functional turnover. a Functional community composition of the two co-response clusters (blue squares = cluster I, red circles = cluster II). Principal component analysis of cluster-weighted means of the five quantitative vascular plant traits and eight bryophyte traits (see Supplementary Fig. 4 for a list of traits, and their cluster-weighted means). b Relationship between taxonomic and functional turnover of the vascular plant (top) and bryophyte (bottom) communities. c Relationship between environmental dissimilarity and functional turnover (vascular plants: F 1,3078 = 1.3, r 2 = 0.02, P = 0.23; bryophytes: F 1,3078 = 1.4, r 2 = 0.02, P = 0.26; Generalized Linear Model)
Fig. 5
Fig. 5
Relationships between the major environmental variables and functional redundancy. Relationships for the vascular plant community a and bryophyte community b. Black lines represent the whole plant community (black), while the coloured lines represent the plant species in the two co-response clusters (blue = cluster I, red = cluster II). MAT = mean annual temperature (°C), TS = seasonality in temperature (°C), MAP = mean annual precipitation (mm), SOx = total sulphur deposition (mg m−2 yr−1), NHx = total reduced nitrogen deposition (mg m−2 yr−1). Linear regression models and two-tailed P-values are shown in Table 1
Fig. 6
Fig. 6
Effects of modelled species assembly scenarios on functional redundancy. The response of plant functional redundancy to seven different assembly scenarios (see text for a description) as compared to the observed functional redundancy, expressed as the deviation of the standardized effect sizes (SES) from zero

References

    1. Cardinale BJ, et al. Biodiversity loss and its impact on humanity. Nature. 2012;486:59–67. doi: 10.1038/nature11148. - DOI - PubMed
    1. Hooper DU, et al. A global synthesis reveals biodiversity loss as a major driver of ecosystem change. Nature. 2012;486:105–108. - PubMed
    1. Isbell F, et al. Biodiversity increases the resistance of ecosystem productivity to climate extremes. Nature. 2015;526:574–577. doi: 10.1038/nature15374. - DOI - PubMed
    1. Duprè C, et al. Changes in species richness and composition in European acidic grasslands over the past 70 years: the contribution of cumulative atmospheric nitrogen deposition. Glob. Change Biol. 2009;16:344–357. doi: 10.1111/j.1365-2486.2009.01982.x. - DOI
    1. Field CD, et al. The role of nitrogen deposition in widespread plant community change across semi-natural habitats. Ecosystems. 2014;17:864–877. doi: 10.1007/s10021-014-9765-5. - DOI

Publication types