Comparative Study
. 2017 Oct 27;7(1):14249.
doi: 10.1038/s41598-017-14759-1.

Experimental imaging in orthotopic renal cell carcinoma xenograft models: comparative evaluation of high-resolution 3D ultrasonography, in-vivo micro-CT and 9.4T MRI

Affiliations
Comparative Study

Experimental imaging in orthotopic renal cell carcinoma xenograft models: comparative evaluation of high-resolution 3D ultrasonography, in-vivo micro-CT and 9.4T MRI

Johannes Linxweiler et al. Sci Rep. .

Abstract

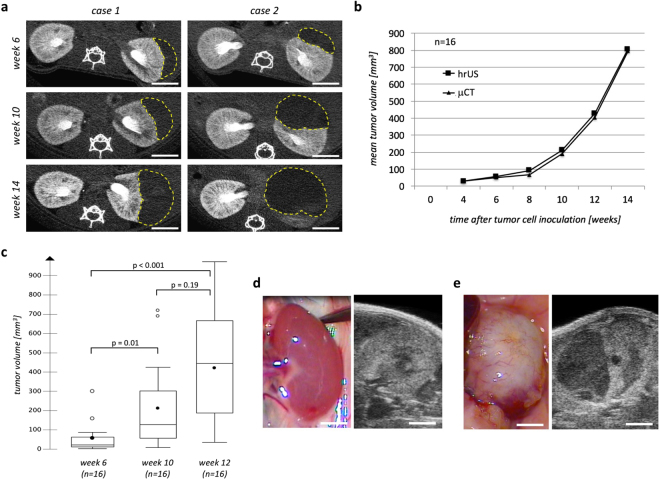
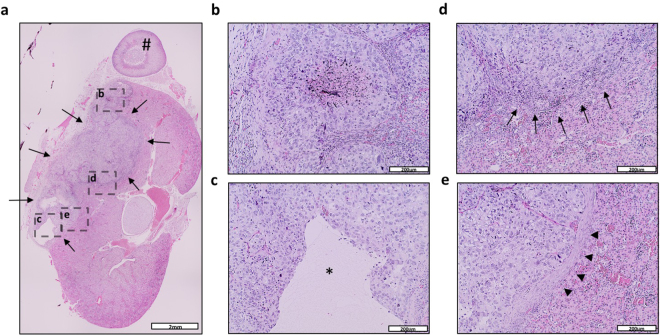
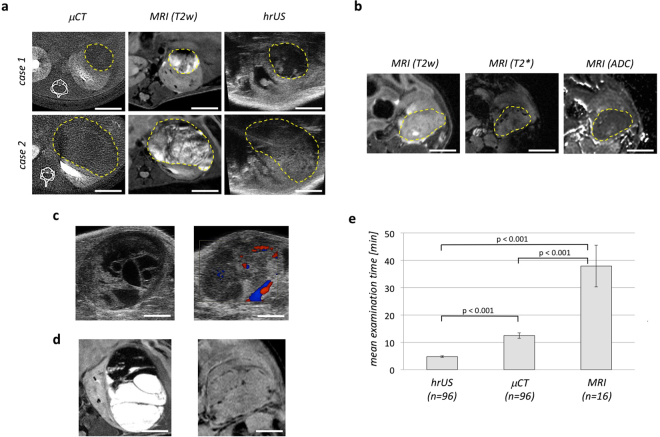
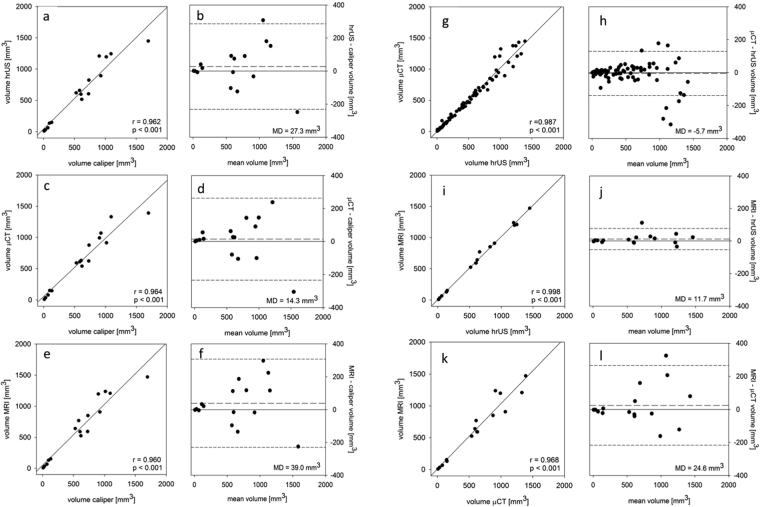
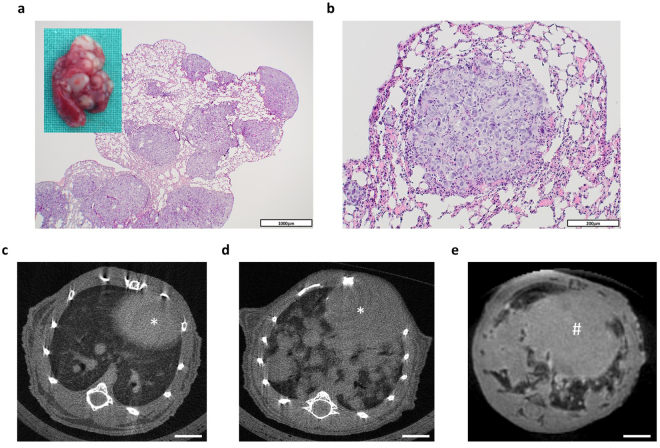
In this study, we aimed to comparatively evaluate high-resolution 3D ultrasonography (hrUS), in-vivo micro-CT (μCT) and 9.4T MRI for the monitoring of tumor growth in an orthotopic renal cell carcinoma (RCC) xenograft model since there is a lack of validated, non-invasive imaging tools for this purpose. 1 × 10⁶ Caki-2 RCC cells were implanted under the renal capsule of 16 immunodeficient mice. Local and systemic tumor growth were monitored by regular hrUS, μCT and MRI examinations. Cells engrafted in all mice and gave rise to exponentially growing, solid tumors. All imaging techniques allowed to detect orthotopic tumors and to precisely calculate their volumes. While tumors appeared homogenously radiolucent in μCT, hrUS and MRI allowed for a better visualization of intratumoral structures and surrounding soft tissue. Examination time was the shortest for hrUS, followed by μCT and MRI. Tumor volumes determined by hrUS, μCT and MRI showed a very good correlation with each other and with caliper measurements at autopsy. 10 animals developed pulmonary metastases being well detectable by μCT and MRI. In conclusion, each technique has specific strengths and weaknesses, so the one(s) best suitable for a specific experiment may be chosen individually.


Conflict of interest statement

The authors declare that they have no competing interests.

Figures

Figure 1
Figure 1
Orthotopic tumor cell engraftment and growth after renal subcapsular implantation of 1 × 106 CAKI-2 cells. (a) Representative cross-sectional CT images from two cases 6, 10 and 14 weeks after tumor cell implantation. Tumors are marked by a dashed yellow line. Scale bar = 3 mm. (b) Mean tumor volumes as detected by high-resolution ultrasonography (squares) and contrast-enhanced micro-CT (triangles) 4, 6, 8, 10, 12 and 14 weeks after orthotopic tumor cell implantation. (c) Box-Whisker plots of tumor volumes 6, 10 and 12 weeks after tumor cell implantation as detected by ultrasonography. Each box represents the range from the first quartile to the third quartile. The median is indicated by a line, the mean by a black circle. Outliers outside the 1.5 fold interquartile range are displayed by white circles. (d) Microphotograph (left) and hrUS-image in transverse orientation (right) of a normal left kidney of a 22 weeks old female Balbc/nude mouse. Scale bar = 3 mm. (e) Microphotograph (left) and hrUS-image in transverse orientation (right) of a tumor-bearing left kidney in a 22 weeks old female Balbc/nude mouse 14 weeks after renal subcapsular implantation of 1 × 106 CAKI-2 cells. Scale bar = 3 mm.
Figure 2
Figure 2
Histologic evaluation (H&E staining) of orthotopic tumors after autopsy. (a) Representative microphotograph of a tumor-bearing kidney. The tumor is marked by arrows, the adrenal gland by a rhomb (#). Scale bar = 2 mm. (be) Details from (a) showing central necrosis (b), malignant cyst formation (c, asterisk), invasive growth pattern (d, arrows) and fibrotic pseudocapsule (e, arrowheads), respectively. Scale bar = 200 μm
Figure 3
Figure 3
Radiographic imaging properties and examination time. (a) Contrast-enhanced μCT (left), T2-weighted MRI (middle) and hrUS images (right) from two representative cases at week 6 (case 1) and week 14 (case 2) after renal subcapsular tumor cell implantation. Tumors are marked by a dashed yellow line. Scale bar = 3 mm. (b) MRI-images from a representative case at T2-weighted (left), T2*- (middle) and diffusion-weighted sequences (right). Tumors are marked by a dashed yellow line. Scale bar = 3 mm. (c) hrUS images showing a partially cystic tumor (left, B-mode) and tumor- and kidney associated vasculature (right, duplex-mode). (d) MRI images of a cystic tumor (left, T2-weighted) and of tumor-associated vasculature (right, T2*-weighted, dark signals). (e) Mean examination time for hrUS, μCT and MRI. Error bars indicate standard deviation.
Figure 4
Figure 4
Primary tumor volumetry. Correlation of primary tumor volumetry by caliper measurement (n = 16), hrUS (n = 96), μCT (n = 96) and 9.4T MRI (n = 16), as assessed by linear correlation analysis (a,c,e,g,i,k) and Bland-Altman analysis (b,d,f,h,j,l). To create a Bland-Altman plot, the mean for primary tumor volumes measured by the two methods to be compared was plotted on the horizontal axis and the differences between the two types of measurement were plotted on the vertical axis. long-dashed line = median deviation (MD), short-dashed line = double standard deviation, r = correlation coefficient.
Figure 5
Figure 5
Development and detection of pulmonary metastases. (a) Representative microphotograph and macroscopic appearance (insert) of a lung bearing multiple metastases. Scale bar = 1000 μm. (b) Representative microphotograph of a single pulmonary metastasis. Scale bar = 200 μm. (c,d) Representative cross-sectional μCT images of a healthy lung (c) and a lung with multiple metastases (d). The heart is indicated by an asterisk (*). (e) Representative cross-sectional MRI-image (UTE, ultrashort echo time) of the basal parts of a lung with multiple metastases. The diaphragm is indicated by a rhomb (#). Scale bars = 3 mm.

References

    1. Grisanzio C, et al. Orthotopic xenografts of RCC retain histological, immunophenothypic and genetic features of tumours in patients. J Pathol. 2011;225:212–21. doi: 10.1002/path.2929. - DOI - PMC - PubMed
    1. Thong AE, et al. Tissue slice grafts of human renal cell carcinoma: an authentic preclinical model with high engraftment rate and metastatic potential. Urol Oncol. 2014;32(43):e23–30. - PMC - PubMed
    1. Ingels A, et al. Preclinical trial of a new dual mTOR inhibitor, MLN0128, using renal cell carcinoma tumorgrafts. Int J Cancer. 2014;134:2322–9. doi: 10.1002/ijc.28579. - DOI - PMC - PubMed
    1. Fidler IJ, Naito S, Pathak S. Orthotopic implantation is essential for the selection, growth and metastasis of human renal cell cancer in nude mice. Cancer Metastasis Rev. 1990;9:149–65. doi: 10.1007/BF00046341. - DOI - PubMed
    1. Manzotti C, Audisio RA, Pratesi G. Importance of orthotopic implantation for human tumors as model systems: Relevance to metastasis and invasion. Clin Exp Metastasis. 1993;11:5–14. doi: 10.1007/BF00880061. - DOI - PubMed

Publication types