. 2017 Dec;46(Suppl 3):355-367.
doi: 10.1007/s13280-017-0951-5.

Future sea ice conditions and weather forecasts in the Arctic: Implications for Arctic shipping

Affiliations

Future sea ice conditions and weather forecasts in the Arctic: Implications for Arctic shipping

Jean-Claude Gascard et al. Ambio. 2017 Dec.

Abstract

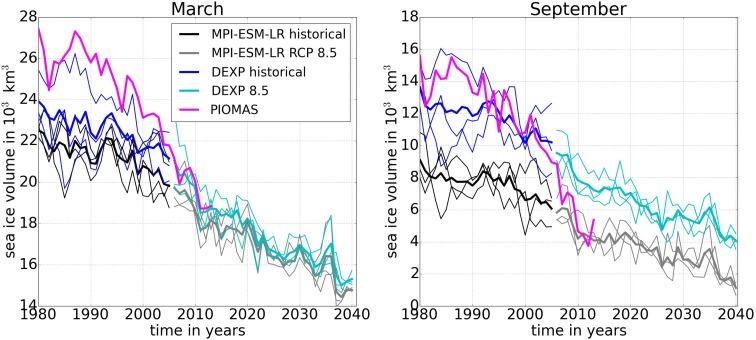
The ability to forecast sea ice (both extent and thickness) and weather conditions are the major factors when it comes to safe marine transportation in the Arctic Ocean. This paper presents findings focusing on sea ice and weather prediction in the Arctic Ocean for navigation purposes, in particular along the Northeast Passage. Based on comparison with the observed sea ice concentrations for validation, the best performing Earth system models from the Intergovernmental Panel on Climate Change (IPCC) program (CMIP5-Coupled Model Intercomparison Project phase 5) were selected to provide ranges of potential future sea ice conditions. Our results showed that, despite a general tendency toward less sea ice cover in summer, internal variability will still be large and shipping along the Northeast Passage might still be hampered by sea ice blocking narrow passages. This will make sea ice forecasts on shorter time and space scales and Arctic weather prediction even more important.

Keywords: Climate change; Polar shipping; Sea ice; Weather forecast.


Figures

Fig. 1
Fig. 1
Northern hemisphere (without Bering Sea and the Sea of Okhotsk, see Electronic supplementary material for explanation) integrated sea ice volume from the MPI-ESM-LR and the downscaling experiments (DEXP8.5) for the time period 1980–2040. The RCP 8.5 simulations start in 2006. Thick lines indicate the ensemble mean. Thin lines show the individual ensemble member. PIOMAS sea ice volume is shown in magenta for comparison
Fig. 2
Fig. 2
PIOMAS-simulated April (winter/blue) and September (summer/red) Arctic sea ice volume for the past 35 years. The green curve indicates the amount of sea ice melting between April and September each year. The black curve indicates the amount of sea ice freezing between September and April the following year. Results cover the entire northern hemisphere (northern hemisphere defined as encompassing Arctic and Subarctic sea ice-covered regions)
Fig. 3
Fig. 3
PIOMAS net sea ice production over the past 35 years computed from sea ice growth minus sea ice melt every year (i.e., the black curve minus the green curve in Fig. 2). The cyan curve represents the 5-year running mean values. The red curve really demonstrates the importance of the sea ice volume interannual variability superimposed over the long-term trend (cyan curve). Results cover the entire northern hemisphere (northern hemisphere defined as encompassing Arctic and Subarctic sea ice-covered regions)
Fig. 4
Fig. 4
Comparison between PIOMAS sea ice volume in April each year over the past 35 years and sea ice volume based on Freezing Degree Days (FDD) using either a linear or a quadratic approximation from which sea ice volume production can be estimated. Sea ice volume is calculated using the spatial distribution of FDD based on ERA-Interim 2-m air temperature reanalysis data covering the whole northern hemisphere
Fig. 5
Fig. 5
DEXP8.5 ensemble mean of the number of “low ice condition” expected days per year for the mean over 2026–2040. “Low ice conditions” are defined as daily mean sea ice concentration (sic) < 20, 40 and 60% and daily mean sea ice thickness (sit) < 0.5, 1.0 and 1.5 m
Fig. 6
Fig. 6
Sea ice conditions along the NEP. The upper left panel illustrates the path of the NEP with the distance traveled from Northern Norway to the Bering Strait in color code. The remaining three panels illustrate model projections of the daily sea ice thickness in 2040 for each of the three ensemble members of DEXP8.5 along this path. The vertical axis shows time (month), and the horizontal axis shows the distance along the NEP from the starting point in Northern Norway (left) to the Bering Strait (right)
Fig. 7
Fig. 7
Number of days per month below threshold. A day is counted if the sea ice variable is below its threshold along the entire Northeast Passage. The thick line denotes the ensemble mean. The shaded area indicates the ensemble spread and is a measure for the internal variability in the system
Fig. 8
Fig. 8
Decreasing quality of weather prognosis going northward illustrated by the root mean square errors (hPa). Left: Errors in pressure (root mean square errors vs observations) for HIRLAM forecasts in the range from 18 to 42 h. Right: The same dataset with root mean square error in pressure (hPa) for forecasts against latitude

Similar articles

Cited by

References

    1. Andersson, E., and Y. Sato. (ed.). 2012. Report from fifth WMO Workshop on the impact of various observing systems on NWP. WMO Integrated Observing system Technical Report no 2-2012. http://www.wmo.int/pages/prog/www/OSY/Meetings/NWP5_Sedona2012/Final_Rep... .
    1. Bengtsson L, Andrae U, Aspelien T, Batrak Y, Calvo J, de Rooy W, Gleeson E, Hansen-Sass B, et al. The HARMONIE-AROME model configuration in the ALADIN-HIRLAM NWP system. Monthly Weather Review. 2017;145:1919–1935. doi: 10.1175/MWR-D-16-0417.1. - DOI
    1. Castro-Morales K, Kauker F, Losch M, Hendricks S, Riemann-Campe K, Gerdes R. Sensitivity of simulated Arctic sea ice to realistic ice thickness distributions and snow parameterizations. Journal of Geophysical Research: Oceans. 2014;119(1):559–571. doi: 10.1002/2013jc009342. - DOI
    1. Dee DP, Uppala SM, Simmons AJ, Berrisford P, Poli P, Kobayashi S, Andrae U, Balmaseda MA, et al. The ERA-Interim reanalysis: configuration and performance of the data assimilation system. Quarterly Journal of the Royal Meteorological Society. 2011;137:553–597. doi: 10.1002/qj.828. - DOI
    1. Emmerson, C., and G. Lahn. 2012. Arctic opening: Opportunity and Risk in the High North. Report from Lloyd’s and Chatham House 2012. https://www.chathamhouse.org/sites/files/chathamhouse/public/Research/En....