. 2018 Dec;67(12):2142-2155.
doi: 10.1136/gutjnl-2017-315144. Epub 2017 Oct 28.

Tailored first-line and second-line CDK4-targeting treatment combinations in mouse models of pancreatic cancer

Affiliations

Tailored first-line and second-line CDK4-targeting treatment combinations in mouse models of pancreatic cancer

Angela Chou et al. Gut. 2018 Dec.

Abstract

Objective: Extensive molecular heterogeneity of pancreatic ductal adenocarcinoma (PDA), few effective therapies and high mortality make this disease a prime model for advancing development of tailored therapies. The p16-cyclin D-cyclin-dependent kinase 4/6-retinoblastoma (RB) protein (CDK4) pathway, regulator of cell proliferation, is deregulated in PDA. Our aim was to develop a novel personalised treatment strategy for PDA based on targeting CDK4.

Design: Sensitivity to potent CDK4/6 inhibitor PD-0332991 (palbociclib) was correlated to protein and genomic data in 19 primary patient-derived PDA lines to identify biomarkers of response. In vivo efficacy of PD-0332991 and combination therapies was determined in subcutaneous, intrasplenic and orthotopic tumour models derived from genome-sequenced patient specimens and genetically engineered model. Mechanistically, monotherapy and combination therapy were investigated in the context of tumour cell and extracellular matrix (ECM) signalling. Prognostic relevance of companion biomarker, RB protein, was evaluated and validated in independent PDA patient cohorts (>500 specimens).

Results: Subtype-specific in vivo efficacy of PD-0332991-based therapy was for the first time observed at multiple stages of PDA progression: primary tumour growth, recurrence (second-line therapy) and metastatic setting and may potentially be guided by a simple biomarker (RB protein). PD-0332991 significantly disrupted surrounding ECM organisation, leading to increased quiescence, apoptosis, improved chemosensitivity, decreased invasion, metastatic spread and PDA progression in vivo. RB protein is prevalent in primary operable and metastatic PDA and may present a promising predictive biomarker to guide this therapeutic approach.

Conclusion: This study demonstrates the promise of CDK4 inhibition in PDA over standard therapy when applied in a molecular subtype-specific context.

Keywords: cell cycle; extracellular matrix; molecular mechanisms; pancreatic cancer.


Conflict of interest statement

Competing interests: None declared.

Figures
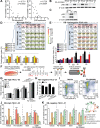
Figure 1
Figure 1
PD-0332991 potentiates gemcitabine (GEM) lethality in stratified pancreatic cancer patient-derived cell lines (PDCLs) and leads to increased apoptosis and G0 cell cycle quiescence. (A) Correlation of PD-0332991 sensitivity and expression of (left) retinoblastoma (RB) or (right) phosphorylated RB (pRB) in 19 PDCLs (normalised to β-actin levels and to low-expressing TKCC-16; included on multiple gels to account for any intergel/transfer variability). For densitometry analysis of normalised protein expression and correlation summaries please refer to supplementary tables 2 and 3. (B) Expression of pRB in RB-high (TKCC-03, TKCC-05, TKCC-26) and RB-negative (TKCC-27) PDCLs 24 hours post-PD-0332991 treatment (0.3 µM or 1 µM, respectively). (C) Western blot depicting negligible levels of pRB and RB proteins in pancreatic cancer cells isolated from the genetically engineered Pdx1-Cre; KrasLSL.G12D/+; p53R172H/+ (KPC) model of pancreatic cancer. Combination index (CI) of the GEM/PD-0332991 combination when agents were combined at a fixed ratio derived from their respective inhibitory concentration 50 (IC50) values in (D) RB-high and (E) RB-low/negative PDCLs. CI values determined at various effective doses (EDs) were calculated using CompuSyn program. CI >1 indicates antagonism, CI <1 synergy and CI=1 additive. Data are presented as mean± SEM; (n=4 independent experiments performed in triplicate). Inset: Heat maps showing viability and CI values of GEM/PD-0332991 combination in various ratios in candidate (D) RB-high (TKCC-03) and (E) RB-negative cells (TKCC-27; n=3 independent experiments performed in triplicate). (F) Fluorescent ubiquitination-based cell cycle indicator (FUCCI)-labelled TKCC-05 or TKCC-27 cells were treated with GEM (0.01 µM for both), PD-0332991 (0.3 µM or 1 µM, respectively) or combination and at selected time points (3–10 days) stained with Annexin-V-Cy5/4',6-diamidino-2-phenylindole (DAPI) and analysed using flow cytometry. Total apoptosis quantified across all examined time points and treatments for (G) RB-high TKCC-05 and (H) RB-negative TKCC-27 cells. (I) Representative TKCC-05-FUCCI cell cycle plots and gating strategy post-treatment (10 days) and control. Quantified cell cycle distribution across all examined treatments (10 days time point) in (J) RB-high and (K) RB-negative PDCLs. Inset: Illustration of FUCCI cell cycle oscillations. Data are shown as mean±SEM (n=4 independent experiments), with comparisons performed against relevant vehicle controls, unless specified. Significance was determined by one-way analysis of variance, followed by Tukey post hoc multiple comparisons test, where *p<0.05, **p<0.01, ***p<0.001 and ****p<0.0001. PDA, pancreatic ductal adenocarcinoma; PFA, paraformaldehyde.
Figure 2
Figure 2
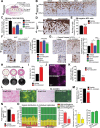
CDK4/6i inhibition impairs the invasive potential of retinoblastoma (RB)-high pancreatic ductal adenocarcinoma (PDA) cells and disrupts collagen matrix integrity. (A) Schematic representation of organotypic invasion assay with PDA cells. (B) Invasion of vehicle-treated and drug-treated enhanced green fluorescent protein (eGFP)-luciferase-labelled TKCC-05 cells through 3D organotypic matrices over 21 days, indicated by green fluorescent protein (GFP) immunohistochemistry. (C) Quantification of cell invasion (100 µm400 µm). (D) Invasion of vehicle-treated and PD-0332991-treated Pdx1-Cre; KrasLSL.G12D/+; p53R172H/+ (KPC) cells through 3D organotypic matrices over 14 days, indicated by multi-cytokeratin staining and (E) quantified. (F) Representative images of Ki-67 staining as a marker of cell proliferation and quantification of the percentage TKCC-05 cells positive for Ki-67 in organotypic matrices following therapeutic intervention with PD-0332991-based approaches. (G) Representative images of cleaved caspase-3 (CC3) staining as a marker of cell apoptosis and quantification of TKCC-05 cells positive for CC3 (ratio normalised to control) in organotypic matrices post-treatment. (H) Schematic of a contraction assay (top), representative images of telomerase-immortalised fibroblast (TIF)–collagen control matrices (bottom) and (I) quantification of matrix area ±PD-0332991 at endpoint (9 days). (J) Representative maximum intensity projections of second harmonic generation (SHG) signal and (K) quantification of SHG signal intensity at peak in TIF–collagen matrices after 9 days of contraction ±PD-0332991. (L) Bright-field and polarised light imaging of Picro Sirius Red-stained TIF–collagen matrices±PD-0332991 and quantification of total collagen content measured as (M) the total signal intensity (bright-field) and (N) intensity of the signal acquired via polarised light. (O) Contribution and quantification of signal emitted from fibres with high, medium and low birefringence normalised to total signal acquired via polarised imaging of Picro Sirius Red-stained collagen matrices ±PD-0332991. Thick remodelled collagen fibres are highly birefringent (red-orange), whereas less remodelled fibres have a lower birefringence (green). Data for organotypic and collagen contraction studies are presented as mean±SEM (n=3 independent experiments, performed in triplicate matrices per condition, per repeat). Significance was determined by one-way analysis of variance, followed by Tukey post hoc multiple comparisons test, where *p<0.05, **p<0.01, ***p<0.001 and ****p<0.0001. Unless specifically indicated, significance is compared against vehicle. GEM, gemcitabine; PDCL, patient-derived cell line.
Figure 3
Figure 3
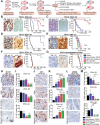
In vivo tailored response of pancreatic ductal adenocarcinoma (PDA) models to PD-0332991 and rationally designed treatment combinations. (A) Preclinical testing pipeline in subcutaneous models. Treatment commenced when tumours reached 150 mm3 (100%), where each mouse was randomised into outlined treatment groups: (a) gemcitabine (GEM) 120 mg/kg twice weekly intraperitoneally (IP) for 25 days, (b) PD-0332991 150 mg/kg daily gavage for 21 days, (c) GEM (120 mg/kg) twice weekly IP and PD-0332991 (150 mg/kg) daily gavage or (d) GEM (70 mg/kg) and nab-Paclitaxel (30 mg/kg) twice weekly IP for 25 days. In the combination arm, PD-0332991 was administered from week 2 for 21 days, 24 hours post-chemotherapy. Treatment response was measured from initiation of therapy (at maximal tolerable dose), through to the time resistance developed (characterised by progressive tumour growth in the presence of drug), and was based on our published work, with a 14-day minimal recovery time before additional treatment cycles. Details on treatment administration are further outlined in supplementary information 2. (B–D) Kaplan-Meier survival analyses of response to PD-0332991 and GEM/PD-0332991 in patient-derived xenografts (PDXs) stratified based on retinoblastoma (RB) status, presented as overall survival. (E–G) Overall survival of immunocompromised or syngeneic mice bearing the RB-negative/low TKCC-PDX-27, PDX-16 and subcutaneous Pdx1-Cre; KrasLSL.G12D/+; p53R172H/+ (KPC) tumours, respectively, treated with CDK4/6i monotherapy and combination, compared with standard therapies for PDA. (H) Representative images of Ki-67 immunohistochemistry performed on PDX-03 and (I) analysed for RB-high PDXs post-treatment (collected at endpoint). (J) Representative images of cleaved caspase 3 (CC3) staining, marker of apoptosis, in PDX-03 and (K) quantified for RB-high PDXs. (L) Representative images of α-smooth muscle actin (SMA) stromal expression post-therapy and (M) staining quantified for RB-high PDXs across all treatment groups (n=6 mice per treatment group). Data are shown as mean ±SD. Significance was determined by one-way analysis of variance, followed by Tukey post hoc multiple comparisons test, where *p<0.05, **p<0.01, ***p<0.001 and ****p<0.0001. Unless specifically indicated, significance is compared against vehicle.
Figure 4
Figure 4
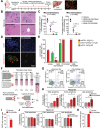
CDK4/6 inhibition decreases cell colonisation and improves chemotherapy response in metastatic sites and makes retinoblastoma (RB)-high tumour cells more vulnerable to shear stress. (A) Schematic representation of intrasplenic injection of RB-high TKCC-05-fluorescent ubiquitination-based cell cycle indicator (FUCCI) cells and associated treatment timeline. (B) Representative images and (C) quantification of liver micrometastasis and total metastasis normalised to liver surface area in H&E serial sections. Arrows point to metastases in the liver tissue. Data are shown as mean±SD (n=4 mice per group and five serial sections per organ (50 µm step)). (D) Representative pictures of metastases identified via imaging of FUCCI signal and (E) quantified cell cycle distribution in liver metastases from the TKCC-05-FUCCI intrasplenic model at the experimental endpoint. (F) Schematic of the fluid shear stress assay, adapted from Barnes et al [37]. (G) Representative TKCC-05-FUCCI apoptosis plots and (H) quantification of total, early and late apoptosis in TKCC-05 cells±PD-0332991 (0.3 µM) 24 hours following shear stress. P0 represents cells not subjected to shear stress and P5 represents cells subjected to five consecutive exposures to shear stress. (I) Quantification of cell attachment onto the collagen matrix, following shear stress of RB-high TKCC-05 cells±PD-0332991 treatment, measured 24 hours post-seeding. Y-axis values (P5/P0 ratios) are values for cells subjected to five exposures to shear stress divided by values for cells not exposed to shear stress. (J) Quantification of apoptosis in RB-negative TKCC-27 cells±PD-0332991 (1 µM) 24 hours following shear stress. (K) Quantification of cell attachment onto the collagen matrix, following shear stress of RB-negative TKCC-27 cells±PD-0332991 treatment. Data are shown as mean±SEM (n=3 biological repeats with two collagen-coated wells per condition). Significance was determined by one-way analysis of variance, followed by Tukey post hoc multiple comparisons test, where *p<0.05, **p<0.01, ***p<0.001 and ****p<0.0001. Unless specifically indicated, significance is compared against vehicle. DAPI, 4',6-diamidino-2-phenylindole; GEM, gemcitabine.
Figure 5
Figure 5
CDK4/6i therapy induces in vivo quiescence at primary tumour site, impairs metastatic spread and improves gemcitabine (GEM) efficacy in a metastatic patient-derived retinoblastoma-positive model of pancreatic ductal adenocarcinoma (PDA). (A) Schematic illustrating in vivo testing in a metastatic patient-derived model (top). Briefly, 15 000 luciferase-labelled patient-derived cell lines (PDCLs) were injected into the pancreas of 6–8-week-old Nod/Scid/IL-2Rγnull (NSG) mice. Mice were randomised into treatment groups at 1 week post-injection, with two additional treatment arms included, involving triple combination of GEM (70 mg/kg), nab-Paclitaxel (30 mg/kg) twice weekly intraperitoneally administered either concomitantly with PD-0332991 (100 mg/kg) gavage from week 2 on a 5 day ‘on’, 5 day ‘off’ schedule for 20 days or with PD-0332991 administered as maintenance therapy by daily gavage after completion of GEM/nab-Paclitaxel treatment. Tumour burden was monitored weekly by bioluminescent imaging until ethical endpoint. Kaplan-Meier survival analyses of PD-0332991 monotherapy, in combination with GEM (left) or triple combinations with GEM/nab-Paclitaxel (right), compared with GEM/nab-Paclitaxel. Log-rank analysis, *p<0.05, **p<0.01, ***p<0.001 and ****p<0.0001. (B) Experimental setup for in vivo second-line therapeutic testing in metastatic PDA (top). In vivo efficacy of GEM/PD-0332991 combination following progression on GEM/nab-Paclitaxel (bottom). (C) Representative images of pancreas tumours (left) and associated liver metastases (right) from orthotopic fluorescent ubiquitination-based cell cycle indicator (FUCCI)-TKCC-05 tumours collected 50 days post-treatment with CDK4/6i-based treatment or standard therapy (GEM/nab-Paclitaxel). Vehicle controls were collected prior to the 50-day time point, as expected, due to a heavy tumour burden. Shown is representative nuclear staining (4',6-diamidino-2-phenylindole (DAPI), top), FUCCI (mKO2—red, mAG—green, overlay—yellow, CD31—blue; middle) and H&E section (bottom). Quantified cell cycle distribution of (D) primary tumours and (E) liver metastases from examined treatment groups, with (F) no metastases detected in PD-0332991 and GEM/PD-0332991-treated animals. (G) Representative overlay of maximum intensity projections of second harmonic generation (SHG) signal and FUCCI with quantification of SHG signal intensity at peak in orthotopic FUCCI-TKCC-05 tumours collected post-treatment. (H) Representative polarised light images of tumour tissue and quantification of total birefringence signal (black) and contribution to signal emitted from collagen fibres with high (red), medium (yellow) and low (green) birefringence acquired via polarised light imaging (n=4 animals per treatment group were used for analysis in (D, E, F, G and H). Significance was determined by one-way analysis of variance, followed by Tukey post hoc multiple comparisons test, where *p<0.05, **p<0.01, ***p<0.001 and ****p<0.0001.
Figure 6
Figure 6
High retinoblastoma (RB) expression is prevalent in human pancreatic ductal adenocarcinoma (PDA) and is of prognostic relevance in independent cohorts of the disease. Examples of (A) (left) RB-negative primary tumour (0); (middle) weakly RB-positive tumour (1+) and (right) RB-high tumour (2+). Kaplan-Meier analyses of disease-specific survival based on RB immunohistochemistry in (B and C) the Australian Pancreatic Genome Initiative (APGI)/International Cancer Genome Consortium (ICGC) cohort and (D and E) the New South Wales Pancreatic Cancer Network (NSWPCN) patient cohort. Survival analyses were performed comparing (B and D) all three RB groups and (C and E) RB-high (2+) versus RB-low in both sets. p Values, log-rank. (F) Examples of (left) RB-high and (right) RB-low primary tumours and matched metastases. (G) The agreement of RB status between primary and metastatic tumours of PDA. The number of observed agreements is 11 (91.67% of the observation), with a Kappa score 0.75 (SE of Kappa 0.232, 95% CI 0.296 to 1.000), indicating the strength of agreement is ‘good’.

Comment in

References

    1. Bailey P, Chang DK, Nones K, et al. . Genomic analyses identify molecular subtypes of pancreatic cancer. Nature 2016;531:47–52. 10.1038/nature16965 - DOI - PubMed
    1. Jones S, Zhang X, Parsons DW, et al. . Core signaling pathways in human pancreatic cancers revealed by global genomic analyses. Science 2008;321:1801–6. 10.1126/science.1164368 - DOI - PMC - PubMed
    1. Collisson EA, Sadanandam A, Olson P, et al. . Subtypes of pancreatic ductal adenocarcinoma and their differing responses to therapy. Nat Med 2011;17:500–3. 10.1038/nm.2344 - DOI - PMC - PubMed
    1. Cancer genome atlas research network. electronic address: andrew_aguirre@dfci.harvard.edu Cancer genome atlas research network. Integrated genomic characterization of pancreatic ductal adenocarcinoma. Cancer Cell 2017;32:e13:185–203. 10.1016/j.ccell.2017.07.007 - DOI - PMC - PubMed
    1. Waddell N, Pajic M, Patch AM, et al. . Whole genomes redefine the mutational landscape of pancreatic cancer. Nature 2015;518:495–501. 10.1038/nature14169 - DOI - PMC - PubMed

Publication types

MeSH terms