. 2017 Dec 29;292(52):21330-21339.
doi: 10.1074/jbc.M117.794453. Epub 2017 Oct 29.

Conformational memory in the association of the transmembrane protein phospholamban with the sarcoplasmic reticulum calcium pump SERCA

Affiliations

Conformational memory in the association of the transmembrane protein phospholamban with the sarcoplasmic reticulum calcium pump SERCA

Serena Smeazzetto et al. J Biol Chem. .

Abstract

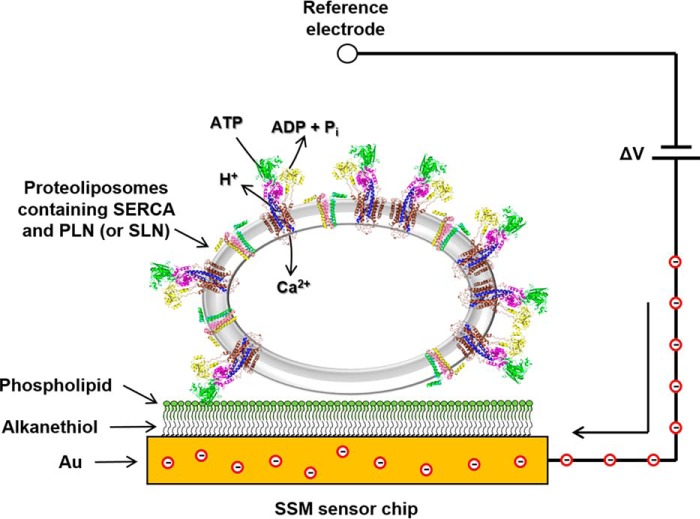
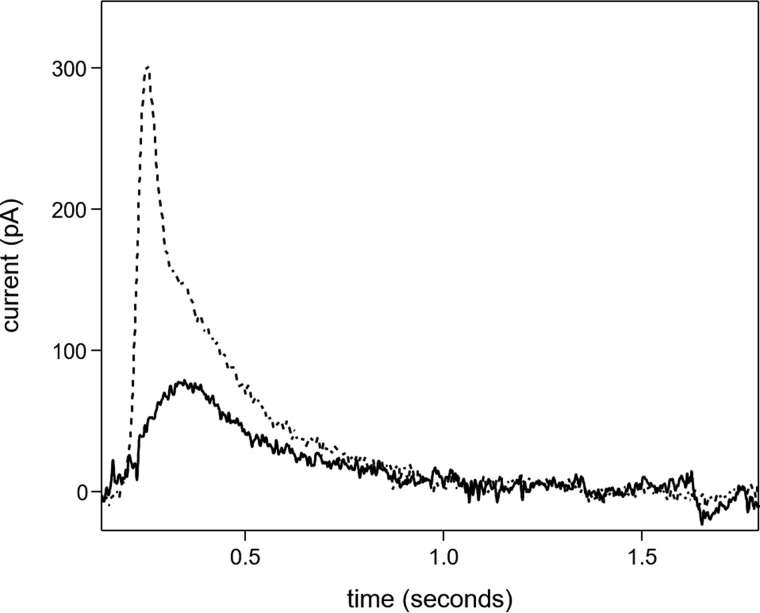
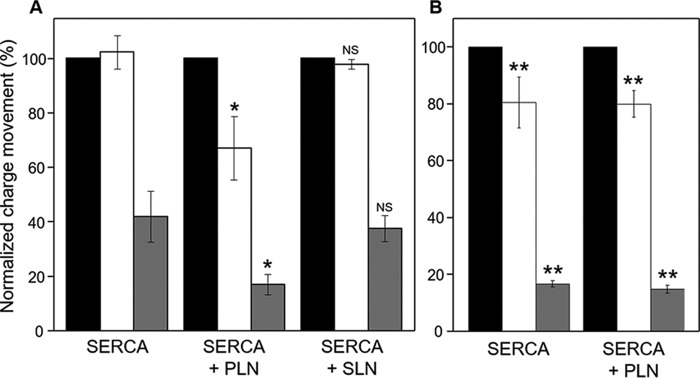
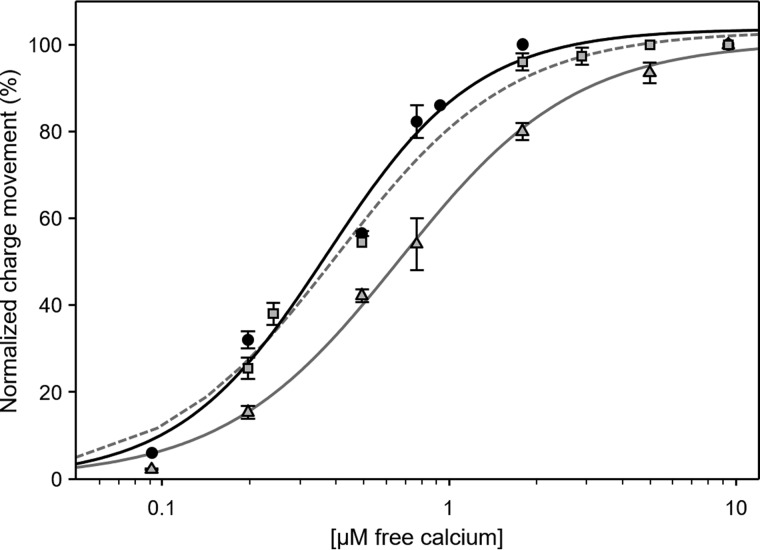
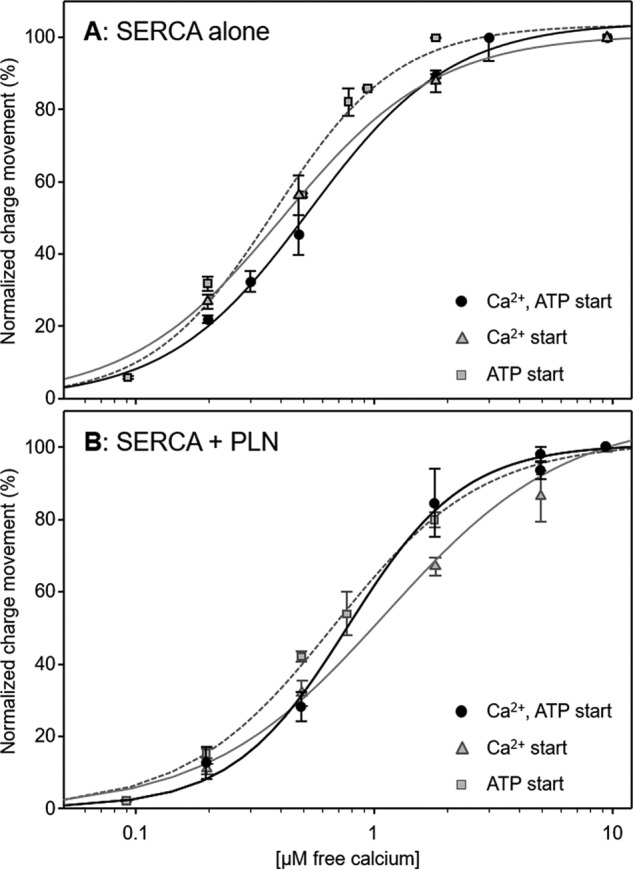
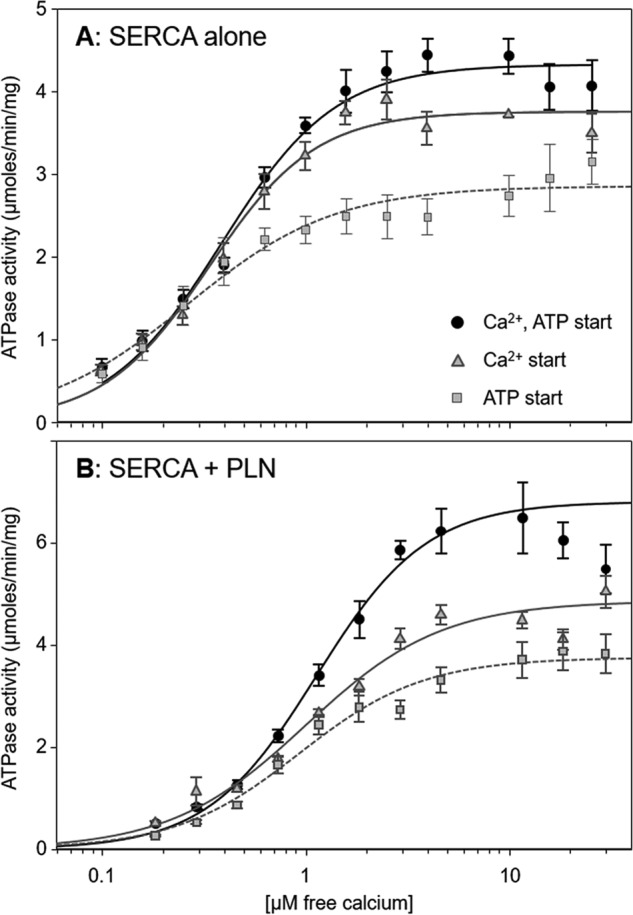
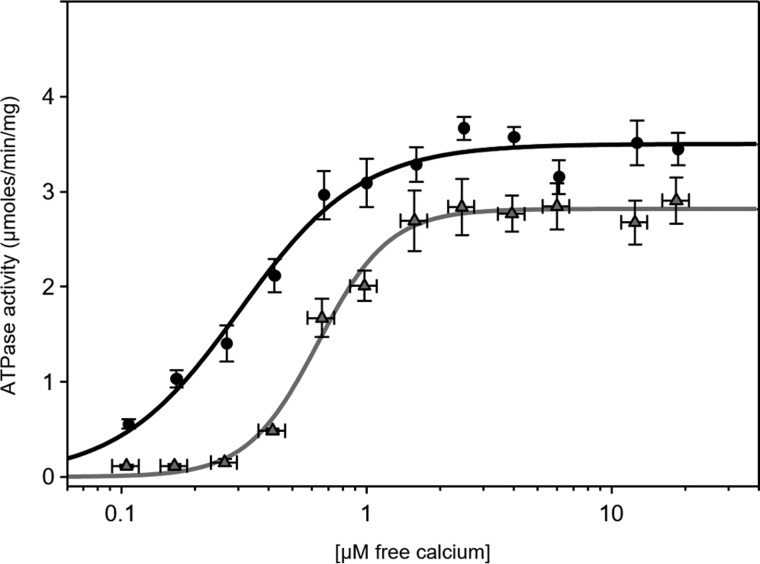
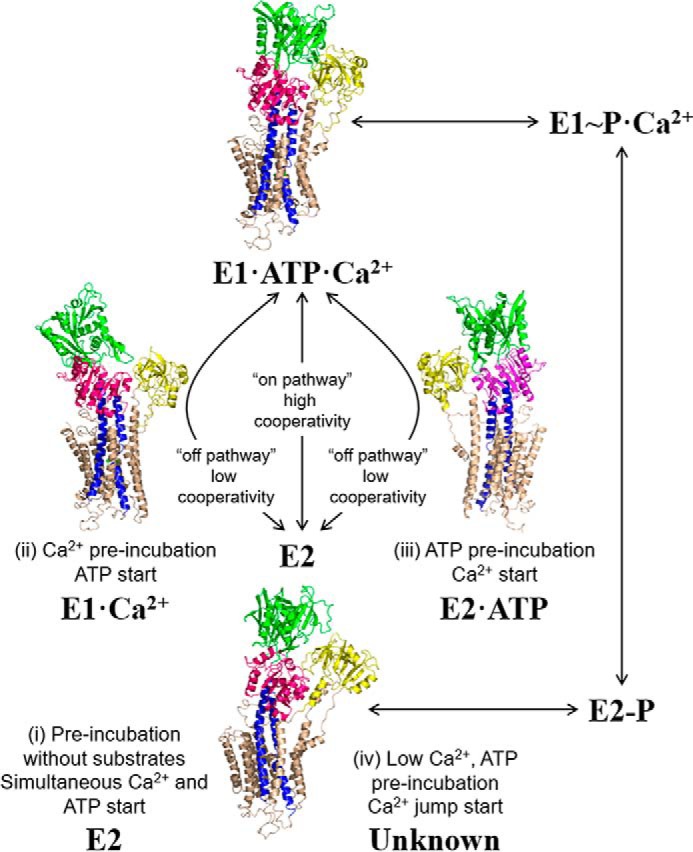
The sarcoplasmic reticulum Ca2+-ATPase SERCA promotes muscle relaxation by pumping calcium ions from the cytoplasm into the sarcoplasmic reticulum. SERCA activity is regulated by a variety of small transmembrane peptides, most notably by phospholamban in cardiac muscle and sarcolipin in skeletal muscle. However, how phospholamban and sarcolipin regulate SERCA is not fully understood. In the present study, we evaluated the effects of phospholamban and sarcolipin on calcium translocation and ATP hydrolysis by SERCA under conditions that mimic environments in sarcoplasmic reticulum membranes. For pre-steady-state current measurements, proteoliposomes containing SERCA and phospholamban or sarcolipin were adsorbed to a solid-supported membrane and activated by substrate concentration jumps. We observed that phospholamban altered ATP-dependent calcium translocation by SERCA within the first transport cycle, whereas sarcolipin did not. Using pre-steady-state charge (calcium) translocation and steady-state ATPase activity under substrate conditions (various calcium and/or ATP concentrations) promoting particular conformational states of SERCA, we found that the effect of phospholamban on SERCA depends on substrate preincubation conditions. Our results also indicated that phospholamban can establish an inhibitory interaction with multiple SERCA conformational states with distinct effects on SERCA's kinetic properties. Moreover, we noted multiple modes of interaction between SERCA and phospholamban and observed that once a particular mode of association is engaged it persists throughout the SERCA transport cycle and multiple turnover events. These observations are consistent with conformational memory in the interaction between SERCA and phospholamban, thus providing insights into the physiological role of phospholamban and its regulatory effect on SERCA transport activity.

Keywords: allosteric regulation; calcium ATPase; calcium translocation; cardiac muscle; membrane transport; phospholamban; sarcolipin; sarcoplasmic reticulum (SR); solid supported membrane.


Conflict of interest statement

The authors declare that they have no conflicts of interest with the contents of this article

Figures

Figure 1.
Figure 1.
SSM technique. A schematic diagram of a proteoliposome containing SERCA and PLN adsorbed to a SSM and subjected to an ATP concentration jump is shown. If the ATP jump induces net charge displacement across the protein, a current transient is measured (the red circles are electrons) when the potential difference applied across the whole system is kept constant.
Figure 2.
Figure 2.
ATP-induced current transients. Current transients observed following an ATP concentration jump on proteoliposomes containing SERCA in the presence of 10 (dashed line) and 0.3 μm free Ca2+ (solid line) are shown.
Figure 3.
Figure 3.
Effects of PLN and SLN on ATP-dependent Ca2+ translocation by SERCA. Normalized charges related to ATP concentration jumps on proteoliposomes containing SERCA, SERCA + PLN, or SERCA + SLN in the presence of 1 mm MgCl2 (A) and 5 mm MgCl2 (B) are shown. Free Ca2+ concentrations used were 10 (black columns; control measurement), 3 (white columns), and 0.3 μm (gray columns). Values are normalized with respect to the charge obtained following a 100 μm ATP jump in the presence of 10 μm free Ca2+. Error bars represent S.E. of at least four independent measurements. *, p < 0.01 compared with SERCA alone in A. **, p < 0.01 compared with SERCA alone in A but not significantly different when compare with each other. NS, not significant compared with SERCA alone in A.
Figure 4.
Figure 4.
SERCA charge translocation as a function of Ca2+ concentration in the presence of PLN or SLN. Normalized charges related to ATP concentration jumps on proteoliposomes containing SERCA (circles; black line), SERCA + PLN (triangles; gray line), or SERCA + SLN (squares; gray dashed line) in the presence of various Ca2+ concentrations are shown. Values are normalized with respect to the charge obtained following a 100 μm ATP jump in the presence of 10 μm free Ca2+. The lines represent curve fitting of the experimental data using the Hill equation (kinetic parameters can be found in Table 1). Error bars represent S.E. of at least four independent measurements.
Figure 5.
Figure 5.
Charge translocation as a function of calcium concentration for proteoliposomes under different starting conditions. A, proteoliposomes containing SERCA alone. B, proteoliposomes containing SERCA and PLN. Normalized charges related to simultaneous ATP (100 μm) and free Ca2+ (various concentrations) jumps are indicated by circles and a black line. Values are normalized with respect to the charge obtained following a simultaneous 100 μm ATP and 10 μm free Ca2+ jump. Normalized charges related to free Ca2+ (various concentrations) jumps in the presence of 100 μm ATP are indicated by triangles and a gray line. Values are normalized with respect to the charge obtained following a 10 μm free Ca2+ jump in the presence of 100 μm ATP. Normalized charges related to ATP jumps in the presence of various Ca2+ concentrations are indicated by squares and a gray dashed line. Values are normalized with respect to the charge obtained following a 100 μm ATP jump in the presence of 10 μm free Ca2+. The lines represent curve fitting of the experimental data using the Hill equation (kinetic parameters can be found in Table 1). Error bars represent S.E. of at least four independent measurements.
Figure 6.
Figure 6.
ATPase activity as a function of Ca2+ concentration for proteoliposomes under different starting conditions. A, proteoliposomes containing SERCA alone. B, proteoliposomes containing SERCA and PLN. SERCA ATPase activity was initiated by the simultaneous addition of calcium and ATP (circles; black line), addition of calcium (preincubation with ATP; triangles; gray line), or addition of ATP (preincubation with calcium; squares; gray dashed line). The lines represent curve fitting of the experimental data using the Hill equation (kinetic parameters can be found in Table 1). Each data point is the mean ± S.E. (n ≥ 4). Error bars represent S.E.
Figure 7.
Figure 7.
ATPase activity as a function of Ca2+ concentration for SERCA (circles) and SERCA + PLN (triangles) proteoliposomes. To mimic physiological resting-state conditions, the proteoliposomes were preincubated with 0.06 μm calcium and 4 mm ATP. SERCA ATPase activity was initiated by the addition of the remaining calcium required to achieve 0.1–10 μm free calcium. The lines represent curve fitting of the experimental data using the Hill equation (kinetic parameters can be found in Table 1). Each data point is the mean ± S.E. (n ≥ 4). Error bars represent S.E.
Figure 8.
Figure 8.
The SERCA transport cycle with structural states relevant to the present study. The preincubation and starting conditions used herein are indicated with corresponding structures of SERCA. Shown are the calcium-free E2 state (Protein Data Bank code 1IWO), an E1-like state promoted by calcium (Protein Data Bank code 1SU4), an E2-like state promoted by ATP (Protein Data Bank code 4H1W), and a catalytically active E1-ATP-Ca2+ state (Protein Data Bank code 1T5S). For condition iv with low calcium and high ATP concentrations, PLN inhibition appears to follow the on-pathway E2 to E1 transition; however, the structural state of SERCA under these conditions is unknown.

References

    1. Toyoshima C. (2009) How Ca2+-ATPase pumps ions across the sarcoplasmic reticulum membrane. Biochim. Biophys. Acta 1793, 941–946 - PubMed
    1. Toyoshima C., and Cornelius F. (2013) New crystal structures of PII-type ATPases: excitement continues. Curr. Opin. Struct. Biol. 23, 507–514 - PubMed
    1. Møller J. V., Olesen C., Winther A. M., and Nissen P. (2010) The sarcoplasmic Ca2+-ATPase: design of a perfect chemi-osmotic pump. Q Rev. Biophys. 43, 501–566 - PubMed
    1. de Meis L., and Vianna A. L. (1979) Energy interconversion by the Ca-dependent ATPase of the sarcoplasmic reticulum. Annu. Rev. Biochem. 48, 275–292 - PubMed
    1. Jones L. R., Cornea R. L., and Chen Z. (2002) Close proximity between residue 30 of phospholamban and cysteine 318 of the cardiac Ca2+ pump revealed by intermolecular thiol cross-linking. J. Biol. Chem. 277, 28319–28329 - PubMed

Publication types

MeSH terms

LinkOut - more resources