

Coherence and Coupling Functions Reveal Microvascular Impairment in Treated Hypertension
- PMID: 29081750
- PMCID: PMC5645539
- DOI: 10.3389/fphys.2017.00749
Coherence and Coupling Functions Reveal Microvascular Impairment in Treated Hypertension
Abstract
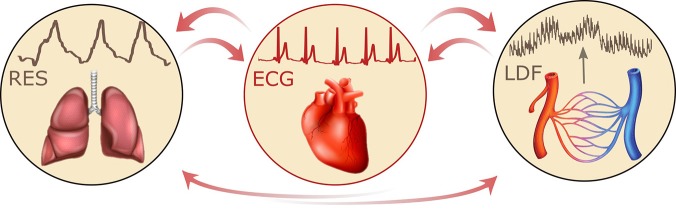
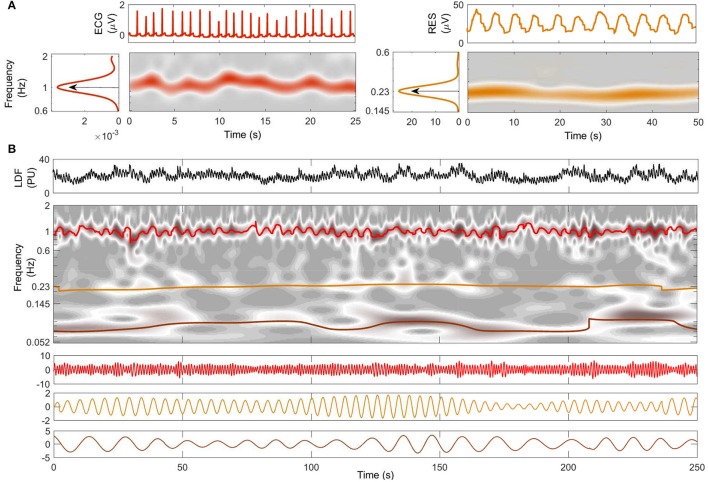
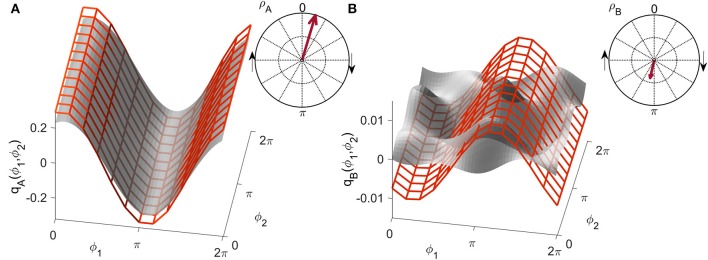
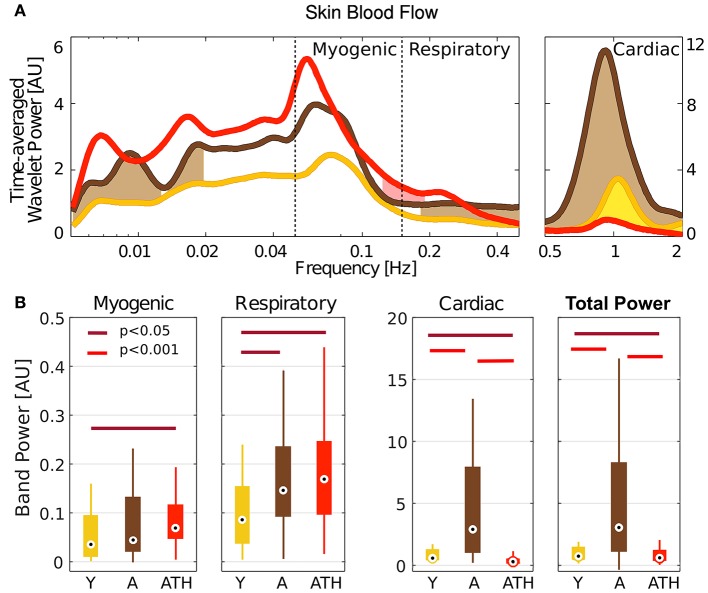
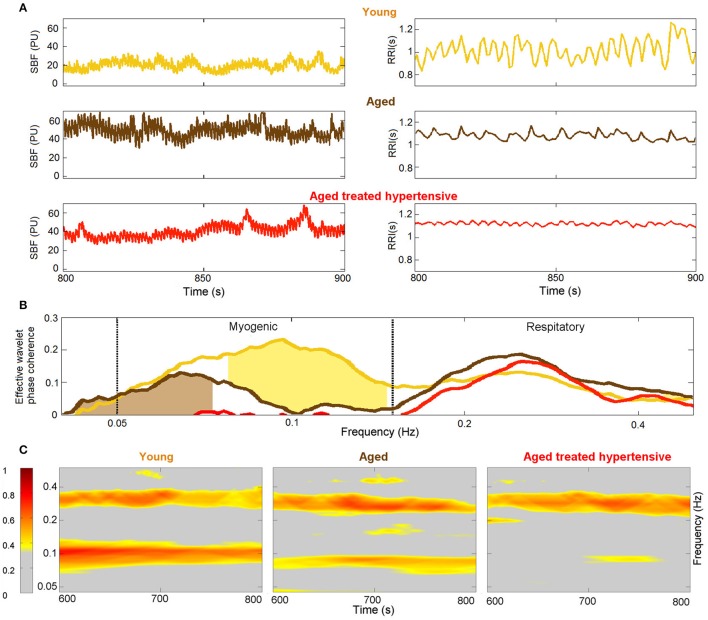
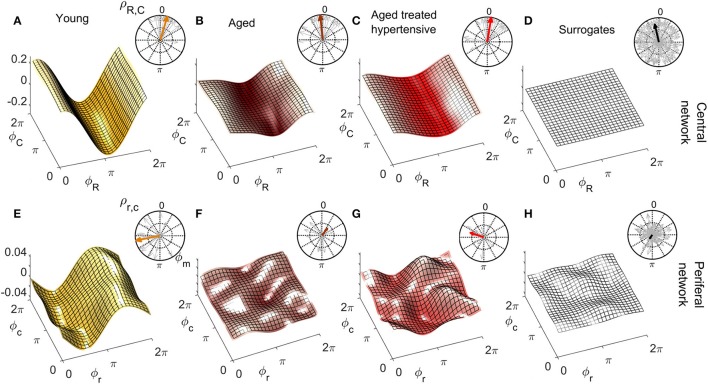
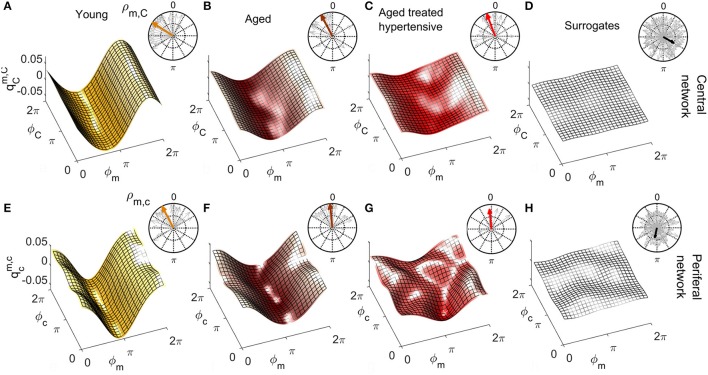
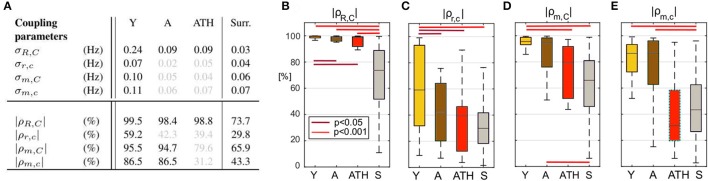
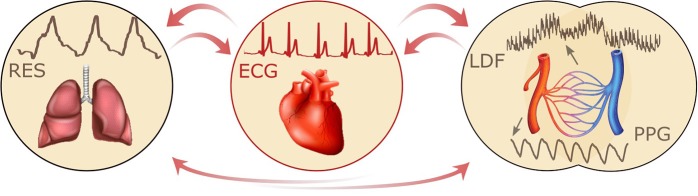
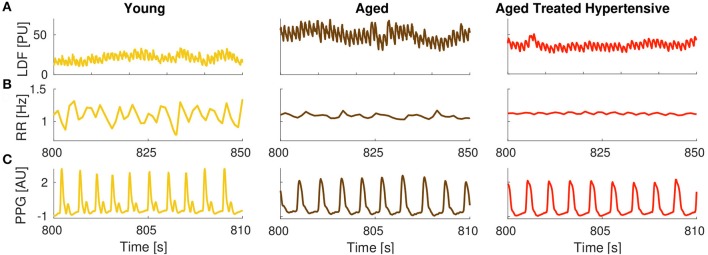
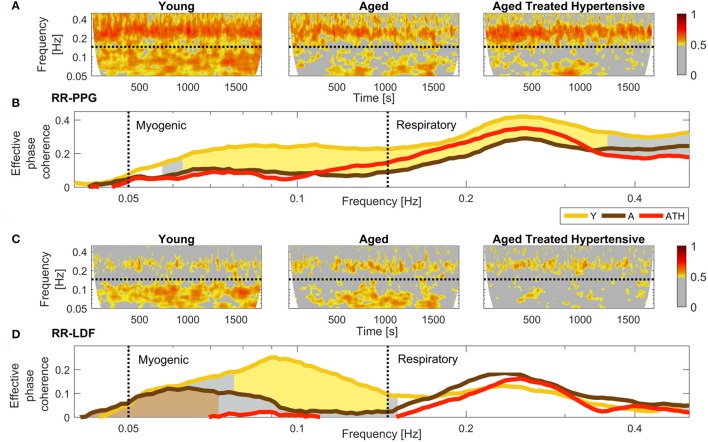
The complex interactions that give rise to heart rate variability (HRV) involve coupled physiological oscillators operating over a wide range of different frequencies and length-scales. Based on the premise that interactions are key to the functioning of complex systems, the time-dependent deterministic coupling parameters underlying cardiac, respiratory and vascular regulation have been investigated at both the central and microvascular levels. Hypertension was considered as an example of a globally altered state of the complex dynamics of the cardiovascular system. Its effects were established through analysis of simultaneous recordings of the electrocardiogram (ECG), respiratory effort, and microvascular blood flow [by laser Doppler flowmetry (LDF)]. The signals were analyzed by methods developed to capture time-dependent dynamics, including the wavelet transform, wavelet-based phase coherence, non-linear mode decomposition, and dynamical Bayesian inference, all of which can encompass the inherent frequency and coupling variability of living systems. Phases of oscillatory modes corresponding to the cardiac (around 1.0 Hz), respiratory (around 0.25 Hz), and vascular myogenic activities (around 0.1 Hz) were extracted and combined into two coupled networks describing the central and peripheral systems, respectively. The corresponding spectral powers and coupling functions were computed. The same measurements and analyses were performed for three groups of subjects: healthy young (Y group, 24.4 ± 3.4 y), healthy aged (A group, 71.1 ± 6.6 y), and aged treated hypertensive patients (ATH group, 70.3 ± 6.7 y). It was established that the degree of coherence between low-frequency oscillations near 0.1 Hz in blood flow and in HRV time series differs markedly between the groups, declining with age and nearly disappearing in treated hypertension. Comparing the two healthy groups it was found that the couplings to the cardiac rhythm from both respiration and vascular myogenic activity decrease significantly in aging. Comparing the data from A and ATH groups it was found that the coupling from the vascular myogenic activity is significantly weaker in treated hypertension subjects, implying that the mechanisms of microcirculation are not completely restored by current anti-hypertension medications.
Keywords: aging; cardiovascular regulation; coherence analysis; coupling functions; heart rate variability; hypertension; microvascular blood flow oscillations; non-linear oscillator.
Figures
Similar articles
-
Ageing of the couplings between cardiac, respiratory and myogenic activity in humans.Annu Int Conf IEEE Eng Med Biol Soc. 2015;2015:7366-9. doi: 10.1109/EMBC.2015.7320093. Annu Int Conf IEEE Eng Med Biol Soc. 2015. PMID: 26737993
-
On the suitability of laser-Doppler flowmetry for capturing microvascular blood flow dynamics from darkly pigmented skin.Physiol Meas. 2019 Aug 2;40(7):074005. doi: 10.1088/1361-6579/ab2651. Physiol Meas. 2019. PMID: 31158825
-
Wavelet phase coherence analysis of the skin blood flow oscillations in human.Microvasc Res. 2014 Sep;95:53-9. doi: 10.1016/j.mvr.2014.07.003. Epub 2014 Jul 12. Microvasc Res. 2014. PMID: 25026413
-
Spectral analysis of the laser Doppler perfusion signal in human skin before and after exercise.Microvasc Res. 1998 Nov;56(3):173-82. doi: 10.1006/mvre.1998.2108. Microvasc Res. 1998. PMID: 9828155
-
Nonlinear dynamics of cardiovascular ageing.Phys Rep. 2010 Mar;488(2-3):51-110. doi: 10.1016/j.physrep.2009.12.003. Phys Rep. 2010. PMID: 20396667 Free PMC article.
Cited by
-
Coupling functions: dynamical interaction mechanisms in the physical, biological and social sciences.Philos Trans A Math Phys Eng Sci. 2019 Dec 16;377(2160):20190039. doi: 10.1098/rsta.2019.0039. Epub 2019 Oct 28. Philos Trans A Math Phys Eng Sci. 2019. PMID: 31656134 Free PMC article.
-
Wavelet analysis of laser Doppler microcirculatory signals: Current applications and limitations.Front Physiol. 2023 Jan 20;13:1076445. doi: 10.3389/fphys.2022.1076445. eCollection 2022. Front Physiol. 2023. PMID: 36741808 Free PMC article. Review.
-
Synchronization transitions caused by time-varying coupling functions.Philos Trans A Math Phys Eng Sci. 2019 Dec 16;377(2160):20190275. doi: 10.1098/rsta.2019.0275. Epub 2019 Oct 28. Philos Trans A Math Phys Eng Sci. 2019. PMID: 31656137 Free PMC article.
-
Limb linkage rehabilitation training-related changes in cortical activation and effective connectivity after stroke: A functional near-infrared spectroscopy study.Sci Rep. 2019 Apr 17;9(1):6226. doi: 10.1038/s41598-019-42674-0. Sci Rep. 2019. PMID: 30996244 Free PMC article.
-
Phase Velocity of Facial Blood Volume Oscillation at a Frequency of 0.1 Hz.Front Physiol. 2021 Jan 28;12:627354. doi: 10.3389/fphys.2021.627354. eCollection 2021. Front Physiol. 2021. PMID: 33584350 Free PMC article.
References
LinkOut - more resources
Full Text Sources
Other Literature Sources