. 2017 Dec 1;127(12):4297-4313.
doi: 10.1172/JCI92504. Epub 2017 Oct 30.

Pharmacological inhibition of the transcription factor PU.1 in leukemia

Affiliations

Pharmacological inhibition of the transcription factor PU.1 in leukemia

Iléana Antony-Debré et al. J Clin Invest. .

Abstract

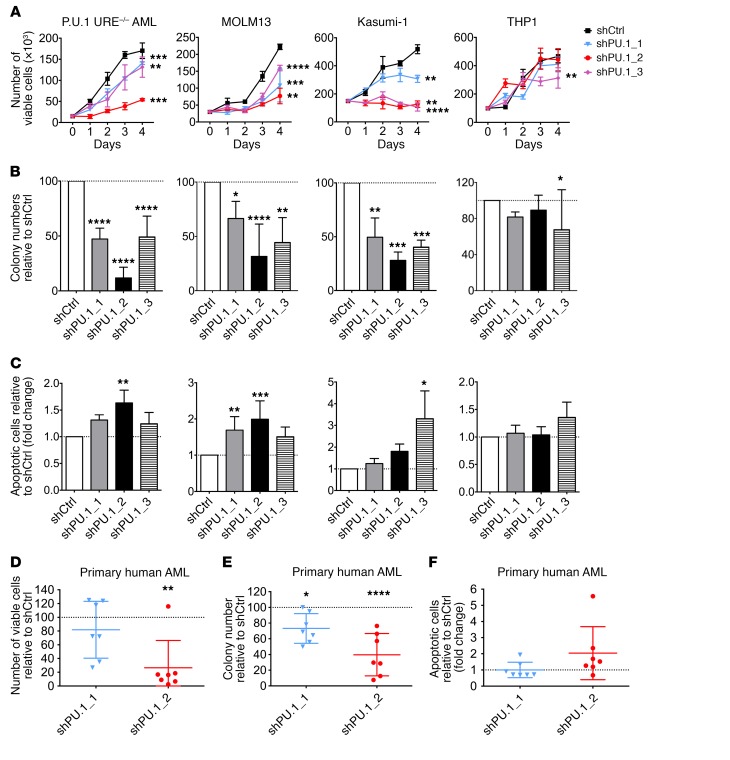
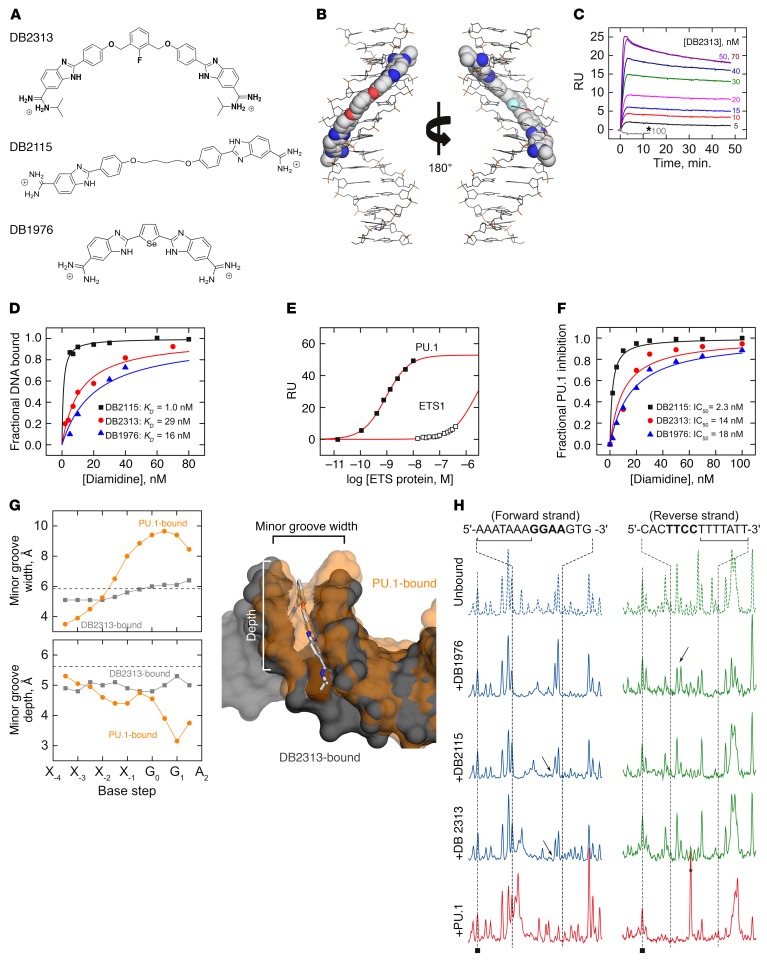
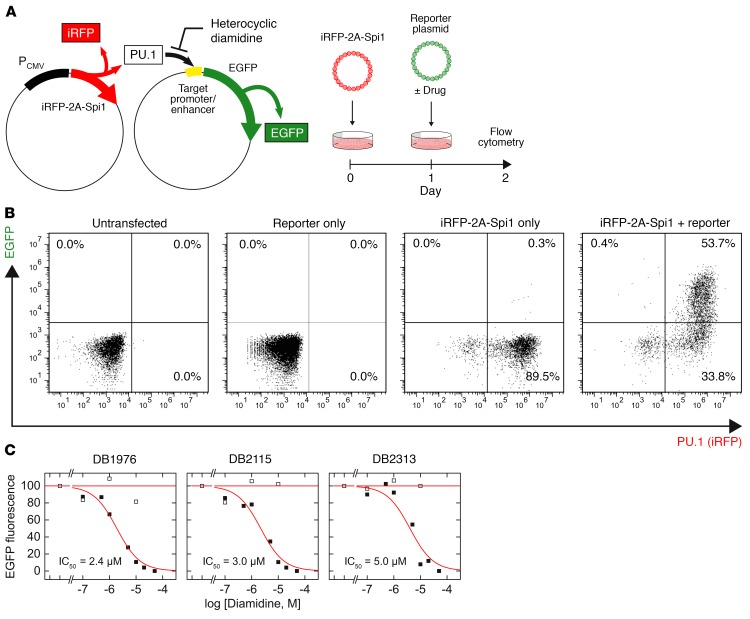
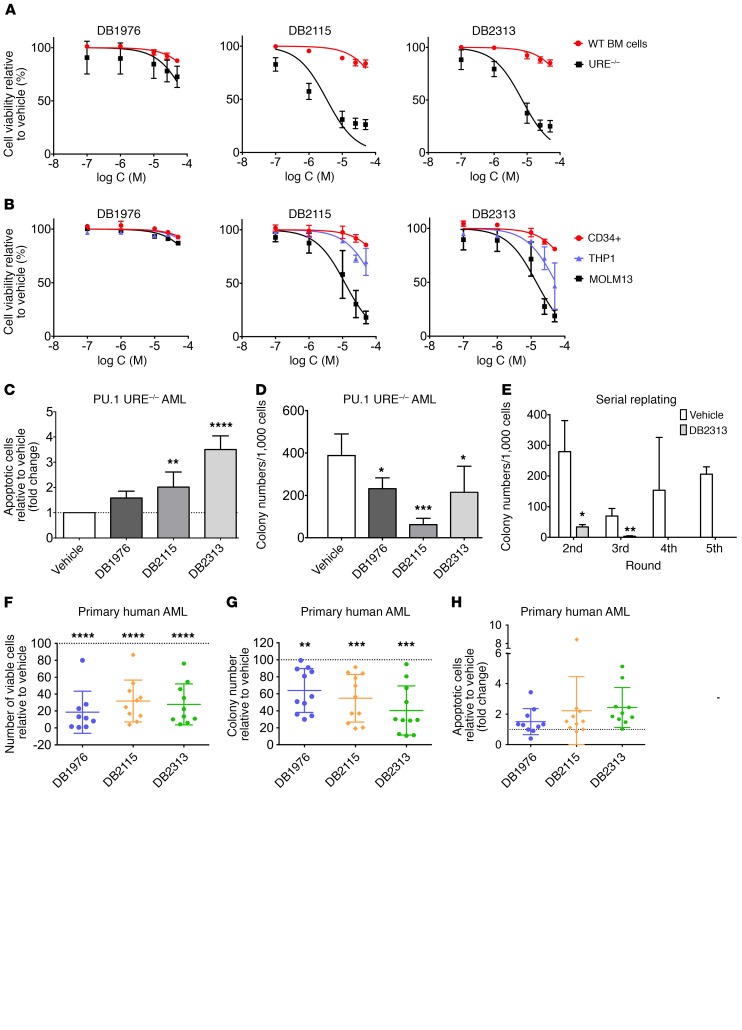
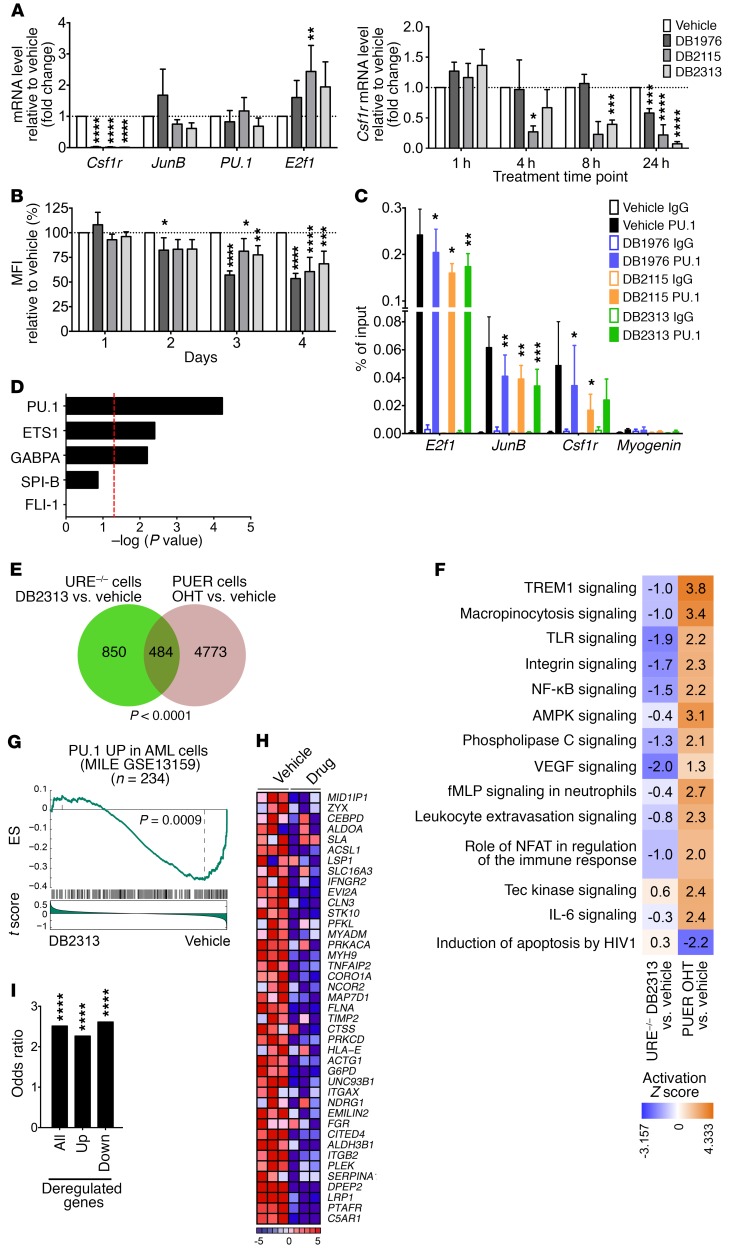
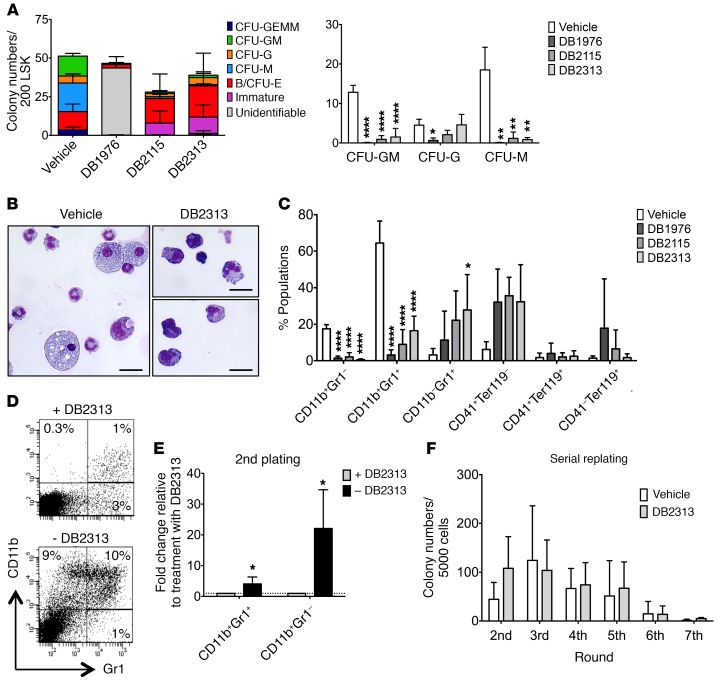
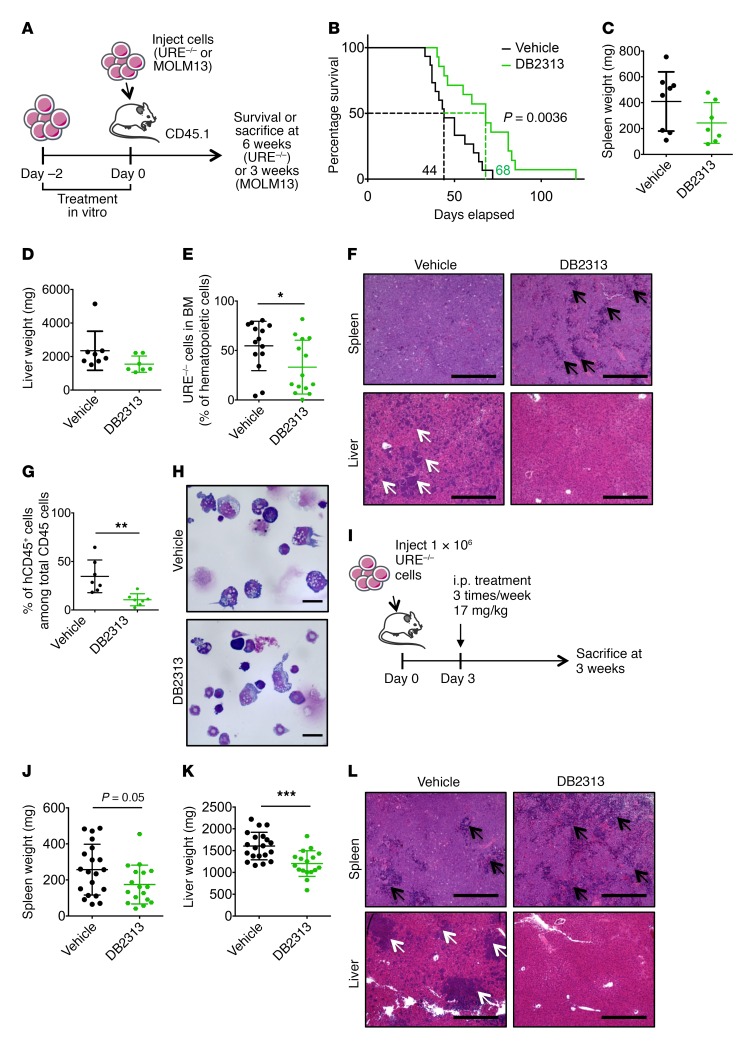
The transcription factor PU.1 is often impaired in patients with acute myeloid leukemia (AML). Here, we used AML cells that already had low PU.1 levels and further inhibited PU.1 using either RNA interference or, to our knowledge, first-in-class small-molecule inhibitors of PU.1 that we developed specifically to allosterically interfere with PU.1-chromatin binding through interaction with the DNA minor groove that flanks PU.1-binding motifs. These small molecules of the heterocyclic diamidine family disrupted the interaction of PU.1 with target gene promoters and led to downregulation of canonical PU.1 transcriptional targets. shRNA or small-molecule inhibition of PU.1 in AML cells from either PU.1lo mutant mice or human patients with AML-inhibited cell growth and clonogenicity and induced apoptosis. In murine and human AML (xeno)transplantation models, treatment with our PU.1 inhibitors decreased tumor burden and resulted in increased survival. Thus, our study provides proof of concept that PU.1 inhibition has potential as a therapeutic strategy for the treatment of AML and for the development of small-molecule inhibitors of PU.1.

Keywords: Drug therapy; Hematology; Leukemias; Therapeutics; Transcription.


Conflict of interest statement

Conflict of interest: The authors have declared that no conflict of interest exists.

Figures

Figure 1
Figure 1. PU.1 knockdown decreases cell growth and clonogenicity and increases apoptosis of murine and human AML cells.
(A) Cell proliferation assay of PU.1 URE–/– AML (n = 4), MOLM13 (n = 3), Kasumi-1 (n = 3), and THP1 (n = 3) cells after transduction with shPU.1_1, shPU.1_2, or shPU.1_3. Results from 1 representative experiment are shown. (B) Clonogenic capacities of PU.1 URE–/– AML (n = 4), MOLM13 (n = 6), Kasumi-1 (n = 3), and THP1 (n = 4) cells after transduction with shPU.1_1, shPU.1_2, or shPU.1_3. Fold change compared with shCtrl is shown. (C) Apoptosis induction in PU.1 URE–/– AML (n = 3), MOLM13 (n = 7), Kasumi-1 (n = 3), and THP1 (n = 3) cells after transduction with shPU.1_1, shPU.1_2, or shPU.1_3. Fold change of annexin-V+DAPI cells compared with shCtrl is shown. (DF) Primary human AML cells were transduced with PU.1 shRNAs, sorted (GFP+), and plated in semisolid media; colony numbers and viable and apoptotic cell numbers were assessed after 14 days of culture. Error bars indicate the mean ± SD, and each AML sample is represented by an individual dot. The percentage (D and E) and fold change (F) compared with vehicle (dotted line) are shown. (D and E) Number of viable cells and clonogenic capacities and (F) apoptosis induction (annexin-V+DAPI) after transduction with shPU.1_1 and shPU.1_2 (n = 7 each). *P < 0.05, **P < 0.01, ***P < 0.001, and ****P < 0.0001, by 1-way ANOVA.
Figure 2
Figure 2. Expanded heterocyclic diamidines target the DNA minor groove and inhibit PU.1 binding by an allosteric mechanism.
(A) Chemical structures of the heterocyclic diamidines. (B) Model of DB2313 docked to the track (5′-AAATAAAA-3′) upstream of the 5′-GGAA-3′ ETS core consensus in the λB motif. (C) Representative SPR sensorgrams for the interaction of DB2313 with the 5′ AT-rich binding site of the λB promoter DNA sequence. Note the lack of binding by DB2313 to an alternative site specific to the ETS homolog ETS1 (5′-GCCGGAAGTG-3′), even at high concentrations (100 nM, asterisk). (D) Comparison of the binding affinities for the λB promoter DNA sequence with different compounds. RU values from the SPR sensorgrams, as in B, were converted to r (r = RU/RUmax, moles of compound bound/mole of promoter DNA) and are plotted against the unbound compound concentration. (E) Specificity of the λB motif for PU.1. Under identical solution conditions, ETS1 bound negligibly at concentrations that saturated the target in the case of PU.1. (F) Normalized PU.1 inhibition resulted from biosensor SPR experiments. The plots represent the amount of PU.1-DNA complex inhibition as a function of the added compound concentration. (G) Perturbations of DNA minor groove width and depth by bound DB2313 or PU.1. The base steps marked “Xi” denote the bases 5′ to the ETS consensus (G0G1AA). Dashed lines indicate the expected values of B-form DNA. Aligned structures of the DB2313-bound (gray) and PU.1-bound (orange) DNA, rendered as van der Waals surfaces, show the mutually incompatible minor groove conformations induced by the diamidine and protein. (H) DNase I footprints of compound binding to the λB motif. The subsite at which the compounds bind is marked by a bracket. Arrows indicate distinct perturbations to the drug-induced DNA structure among the compounds as detected by DNase I. As a reference, the PU.1-bound footprint is also shown (red); note the DNase I–hypersensitive band (asterisk) in the reverse strand that is diagnostic of site-specific ETS-DNA complexes.
Figure 3
Figure 3. Cellular properties and functional inhibition of PU.1 by expanded diamidines.
(A) Ectopic PU.1 activity, as indicated by an iRFP marker, in live HEK293 cells was measured through expression of a fluorescent EGFP reporter, transfected with or without compound, under the control of a minimal PU.1-dependent, λB-based promoter. (B) Flow cytometric analysis of the PU.1 marker (iRFP) and EGFP reporter, in which the upper right quadrant represents PU.1-dependent reporter activation. Note the lack of EGFP reporter activation by endogenous non-PU.1 ETS paralogs, indicating specificity of the λB reporter. (C) Inhibition of cellular EGFP fluorescence by the compounds. Black symbols represent the λB-based reporter, which was sensitive to diamidine inhibition in a concentration-dependent manner, and white symbols represent the mutated SC1-based reporter, which was insensitive. Curves are fits of the data to the Hill equation. The IC50 values for all compounds ranged between 2 μM and 5 μM.
Figure 4
Figure 4. Small-molecule PU.1 inhibitors decrease cell growth and increase apoptosis of AML cells.
(A) Cell viability of PU.1 URE–/– AML cells and WT BM cells after treatment with increasing concentrations of vehicle or small molecules (n = 3). (B) Cell viability of human CD34+, THP1, and MOLM13 cells after treatment with increasing concentrations of vehicle or small molecules (n = 3). (C) Apoptosis induction (annexin-V+PI) in PU.1 URE–/– AML cells after 48 hours of treatment with DB1976 (n = 6), DB2115 (n = 6), or DB2313 (n = 3). Fold change compared with vehicle is shown. (D) Clonogenic capacities of PU.1 URE–/– AML cells after treatment with DB1976 (n = 5), DB2115 (n = 3) and DB2313 (n = 4). (E) Serial replating capacity of PU.1 URE–/– AML cells after treatment with DB2313 (n = 3). (FH) Primary human AML cells were plated in semisolid media containing DB1976, DB2115, or DB2313; colony numbers, viable cell numbers, and apoptotic cells were assessed after 14 days of culture. Error bars represent the mean ± SD, and each AML sample is represented by an individual dot. The percentage (F and G) or fold change (H) compared with vehicle (dotted line) is shown. (F) Number of viable cells (n = 10) and (G) clonogenic capacity (n = 11) after treatment. (H) Apoptotic cell (annexin-V+PI) fraction after treatment (n = 10). *P < 0.05, **P < 0.01, ***P < 0.001, and ****P < 0.0001, by 1-way ANOVA (C, D, and FH) or 2-tailed Student’s t test (E).
Figure 5
Figure 5. Inhibitors show on-target PU.1 inhibitory activity in AML cells.
(A) qRT-PCR analysis of PU.1 target genes after PU.1 URE–/– AML cell treatment (n = 3–7), normalized to Gapdh. Fold change compared with vehicle is shown. (B) Mean fluorescence intensity (MFI) of BM MNCs isolated from PU.1/GFP-knockin mice (38) after treatment (n = 5). Fold change compared with vehicle is shown. (C) Quantitative ChIP assays of PU.1 occupancy after treatment of PU.1 URE+/–Msh2–/– AML cells (n = 5). Myogenin was used as a negative control. (DI) Transcriptome analysis of PU.1 URE–/– AML cells after a 24-hour treatment with DB2313 (n = 3) versus vehicle (n = 3). (D) Differentially expressed genes upon treatment were tested for enrichment of genes directly regulated by PU.1, or regulated by the other ETS transcription factors using Ingenuity Knowledge Base (generated with the use of IPA). Dotted line represents the significance threshold (–log P value >1.3). (E and F) Comparative analysis of deregulated genes in PU.1 URE–/– AML cells after treatment and in PUER cells after PU.1 induction (GEO GSE13125). (E) Venn diagram shows significant overlap between the 2 data sets. (F) Deregulated canonical pathways between the data sets. Colored squares indicate the activation Z score. (G) GSEA enrichment plot of PU.1 positively regulated genes (regulon) in AML cells (from the MILE AML network, as determined by the ARACNe algorithm) against the global list of differentially expressed genes upon treatment, ranked by the drug response (as measured by t score of DB2313 vs. vehicle). (H) Heatmap of leading-edge genes showing row-normalized relative expression. (I) Enrichment of PU.1 binding at promoters of deregulated genes in PU.1 URE–/– AML cells upon treatment. Publicly available PU.1 ChIP-seq data from PUER cells (GSE63317) were used for this analysis. Up, upregulated; Down, downregulated. *P < 0.05, **P < 0.01, ***P < 0.001, and ****P < 0.0001, by 1-way ANOVA (AC), hypergeometric test (E), Fisher’s exact test (I), or according to ref. (G).
Figure 6
Figure 6. PU.1 inhibitors decrease granulomonocytic differentiation in a reversible manner.
(AC) WT LSK cells were plated in semisolid media containing PU.1 inhibitors (25 μM for DB1976, 700 nM for DB2115, and 330 nM for DB2313). (A) Number of CFU-G, CFU-M, CFU-GM, CFU-GEMM, B/CFU-E, and immature colonies after treatment (left). Detailed histograms of CFU-GM, CFU-G, and CFU-M numbers (right) (n = 3). (B) Morphological appearance of cytospun and May-Grünwald Giemsa–stained cells after colony formation assay with vehicle or DB2313 treatment. Scale bars: 20 μm. (C) FACS analysis showing the percentage of CD11b+Gr1, CD11b+Gr1+, CD11bGr1+, CD41+Ter119, CD41+Ter119+, and CD41Ter119+ cells after colony formation assays (n = 4). (D and E) Cells from a first round of colony formation assays treated with DB2313 were replated in the presence (+DB2313) or absence (–DB2313) of DB2313. (D) Representative FACS plots. (E) Proportion of CD11b+Gr1 and CD11b+Gr1+ cells formed, with or without DB2313 treatment, in the replating (n = 3). Fold change compared with replating with DB2313 treatment is shown. (F) Serial replating assay with D2313 continuous treatment (n = 3). *P < 0.05, **P < 0.01, and ****P < 0.0001, by 1-way ANOVA (A and C) or 2-tailed Student’s t test (E).
Figure 7
Figure 7. Treatment with PU.1 inhibitors leads to decreased tumor burden and increased survival in vivo.
(A) Experimental scheme for PU.1 URE–/– AML and MOLM13 cells transplants after in vitro treatment. (BF) Transplantation of PU.1 URE–/– AML cells. (B) Kaplan-Meier survival analysis of transplanted mice (n = 15, vehicle group; n = 14, DB2313 group; 2 independent experiments). Dotted lines indicate median survival. (C and D) Spleen and liver weights 6 weeks after transplant (n = 8 mice, vehicle group; n 7, DB2313 group). (E) Chimerism of PU.1 URE–/– AML cells in the BM 6 weeks after transplantation (n = 28 mice total; 2 independent experiments). (F) Histological analysis of H&E-stained spleen and liver. Black arrows indicate the remaining red pulp in the spleen; white arrows indicate blast infiltration in the liver. Scale bars: 400 μm. (G and H) Transplantation of human MOLM13 cells. (G) Chimerism of MOLM13 cells (hCD45+) in the BM 3 weeks after transplantation (n = 7 mice/group). (H) Morphological appearance of May-Grünwald Giemsa–stained BM cells 3 weeks after transplantation. Scale bars: 20 μm. (I) Experimental scheme for PU.1 URE–/– AML cell transplantation followed by i.p. treatment with vehicle or DB2313. (J and K) Spleen and liver weights 3 weeks after transplantation (n = 20 mice, vehicle group; n = 17, DB2313 group; 3 independent experiments). (L) Histological analysis of H&E-stained spleen and liver. Black arrows indicate the remaining red pulp in the spleen; white arrows indicate blast infiltration in the liver. Scale bars: 400 μm. Error bars represent the mean ± SD, and each mouse is represented by an individual dot. *P < 0.05, **P < 0.01, and ***P < 0.001, by log-rank (Mantel-Cox) test (B) or 2-tailed Student’s t test (E, G, J, and K).

References

    1. Facts 2014-2015. Leukemia & Lymphoma Society. https://www.lls.org/sites/default/files/file_assets/facts.pdf Accessed September 28, 2017.
    1. Cancer Genome Atlas Research Network, et al. Genomic and epigenomic landscapes of adult de novo acute myeloid leukemia. N Engl J Med. 2013;368(22):2059–2074. doi: 10.1056/NEJMoa1301689. - DOI - PMC - PubMed
    1. Mizuki M, et al. Suppression of myeloid transcription factors and induction of STAT response genes by AML-specific Flt3 mutations. Blood. 2003;101(8):3164–3173. doi: 10.1182/blood-2002-06-1677. - DOI - PubMed
    1. Vangala RK, et al. The myeloid master regulator transcription factor PU.1 is inactivated by AML1-ETO in t(8;21) myeloid leukemia. Blood. 2003;101(1):270–277. doi: 10.1182/blood-2002-04-1288. - DOI - PubMed
    1. Mueller BU, et al. ATRA resolves the differentiation block in t(15;17) acute myeloid leukemia by restoring PU.1 expression. Blood. 2006;107(8):3330–3338. doi: 10.1182/blood-2005-07-3068. - DOI - PMC - PubMed

Publication types

MeSH terms