. 2017 Dec 1;127(12):4285-4296.
doi: 10.1172/JCI81870. Epub 2017 Oct 30.

Cardiomyocyte proliferation prevents failure in pressure overload but not volume overload

Affiliations

Cardiomyocyte proliferation prevents failure in pressure overload but not volume overload

Karl Toischer et al. J Clin Invest. .

Abstract

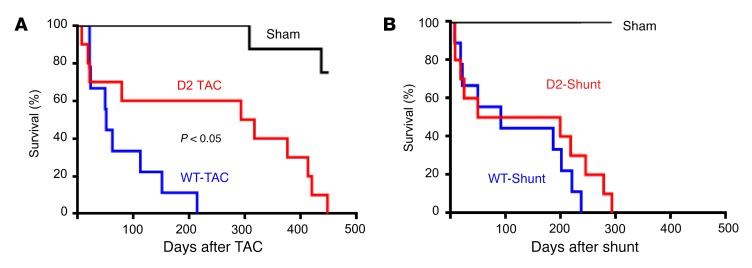
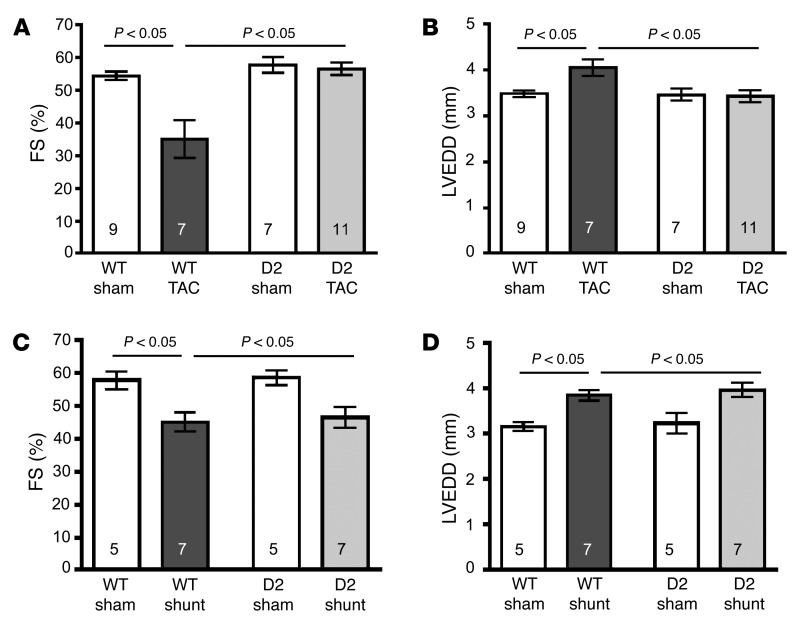
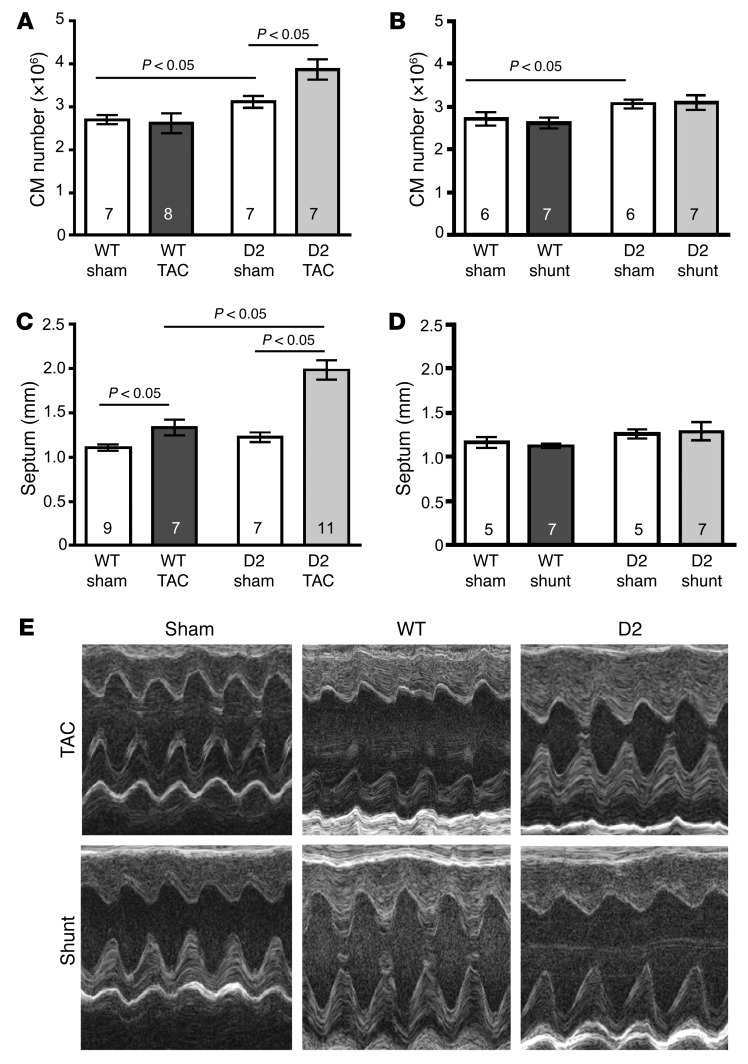
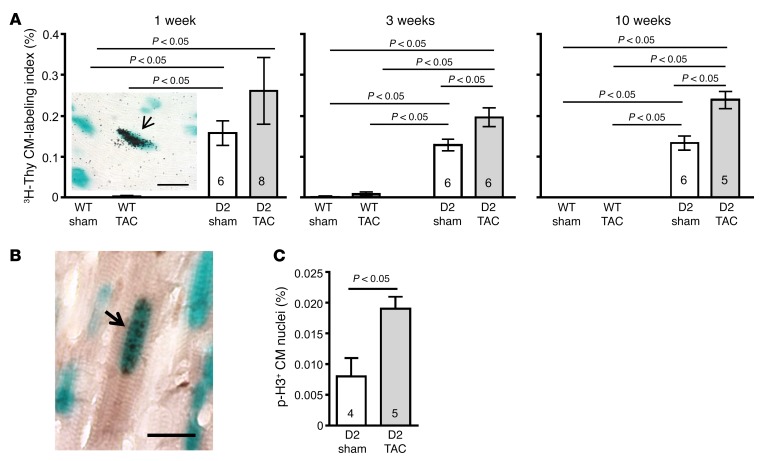
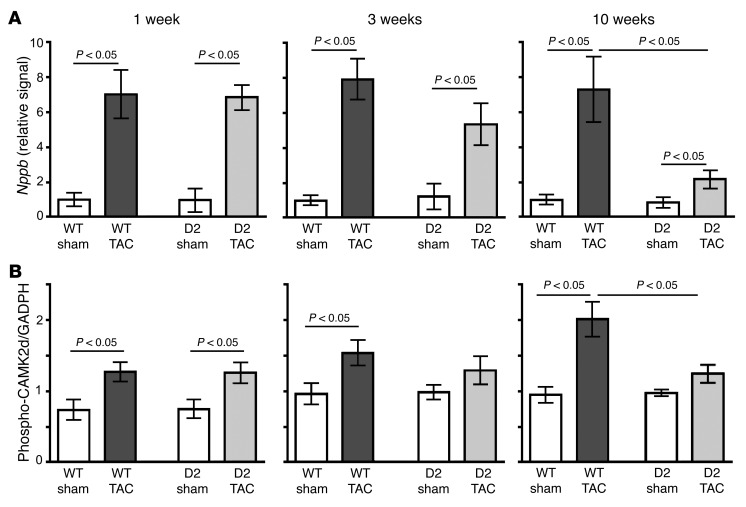
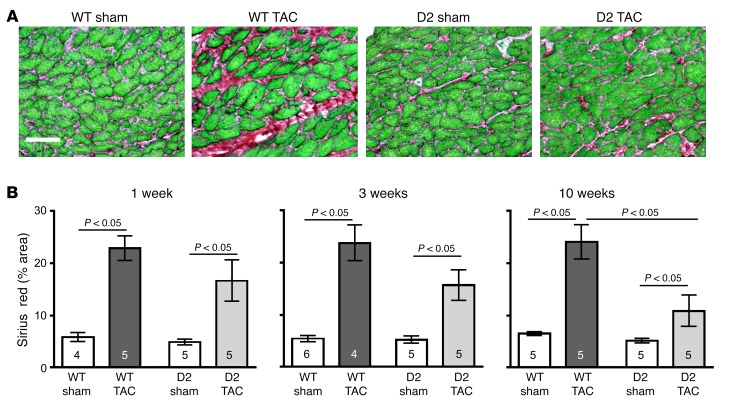
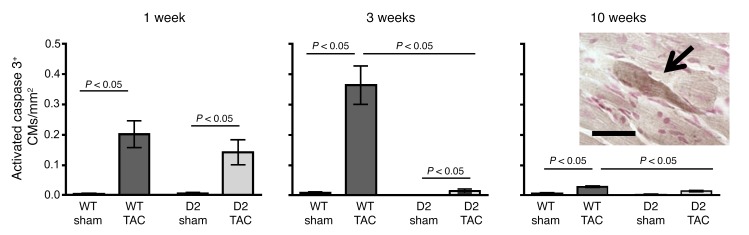
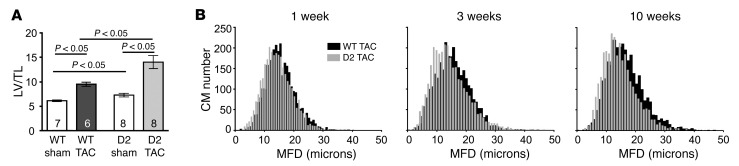
Induction of the cell cycle is emerging as an intervention to treat heart failure. Here, we tested the hypothesis that enhanced cardiomyocyte renewal in transgenic mice expressing cyclin D2 would be beneficial during hemodynamic overload. We induced pressure overload by transthoracic aortic constriction (TAC) or volume overload by aortocaval shunt in cyclin D2-expressing and WT mice. Although cyclin D2 expression dramatically improved survival following TAC, it did not confer a survival advantage to mice following aortocaval shunt. Cardiac function decreased following TAC in WT mice, but was preserved in cyclin D2-expressing mice. On the other hand, cardiac structure and function were compromised in response to aortocaval shunt in both WT and cyclin D2-expressing mice. The preserved function and improved survival in cyclin D2-expressing mice after TAC was associated with an approximately 50% increase in cardiomyocyte number and exaggerated cardiac hypertrophy, as indicated by increased septum thickness. Aortocaval shunt did not further impact cardiomyocyte number in mice expressing cyclin D2. Following TAC, cyclin D2 expression attenuated cardiomyocyte hypertrophy, reduced cardiomyocyte apoptosis, fibrosis, calcium/calmodulin-dependent protein kinase IIδ phosphorylation, brain natriuretic peptide expression, and sustained capillarization. Thus, we show that cyclin D2-induced cardiomyocyte renewal reduced myocardial remodeling and dysfunction after pressure overload but not after volume overload.

Keywords: Cardiology; Cell Biology; Cell cycle; Heart failure.


Conflict of interest statement

Conflict of interest: The authors have declared that no conflict of interest exists.

Figures

Figure 1
Figure 1. Enhanced survival of D2 mice following TAC but not shunt surgery.
(A) Survival plot of WT-TAC (blue line, n = 9), D2-TAC (red line, n = 10), and sham mice (black line, n = 9); animals that died acutely (i.e., within 24 hours of surgery) are not included in the plot. (B) Survival plot of WT-Shunt (blue line, n = 9), D2-Shunt (red line, n = 10), and sham mice (black line, n = 8); animals that died acutely (i.e., within 24 hours of surgery) are not included in the plot. Statistical analysis: log-rank (Mantel-Cox) test.
Figure 2
Figure 2. Preserved cardiac function in D2 mice following TAC but not shunt surgery.
(A) Fractional shortening (FS) of WT and D2 mice 10 weeks after either sham or TAC surgery. (B) Left ventricular end-diastolic dimension (LVEDD) of WT and D2 mice 10 weeks after either sham or TAC surgery. (C) FS of WT and D2 mice 10 weeks after either sham or shunt surgery. (D) LVEDD of WT and D2 mice 10 weeks after either sham or shunt surgery. Statistical analysis: 2-way ANOVA followed by the Bonferroni procedure. Numbers within bars are the numbers of animals examined.
Figure 3
Figure 3. Increased cardiomyocyte number and wall thickness in D2 mice following TAC but not shunt surgery.
(A and B) Total cardiomyocyte (CM) number for WT and D2 mice at 10 weeks following sham, TAC (A), or shunt (B) surgery. (C and D) Heart septum thickness of WT and D2 mice 10 weeks following sham, TAC (C), or shunt (D) surgery. (E) Representative echocardiographic recordings from a sham-operated, a WT, and a D2 mouse 10 weeks after TAC or shunt surgery. Statistical analysis: 2-way ANOVA followed by the Bonferroni procedure. Numbers within bars are the numbers of animals examined.
Figure 4
Figure 4. Increased cardiomyocyte cell cycle activity in D2 mice following TAC surgery.
(A) Cardiomyocyte (CM) tritiated thymidine (3H-Thy) labeling index (%) in WT and D2 mice at 1, 3, and 10 weeks following sham or TAC surgery (n = 4–8). Insert shows a representative example of an S-phase cardiomyocyte nucleus (arrow), as evidenced by 3H-Thy incorporation (blue signal is X-GAL reaction product; black signal is silver grains in the autoradiograph). Scale bar: 25 μm. (B) Phosphorylated histone H3 (p-H3) immunoreactivity 10 weeks after surgery. Representative example of a mitotic cardiomyocyte nucleus (arrow), as evidence by the presence of p-H3 immunoreactivity (blue signal is X-GAL reaction product; black signal is p-H3 immunoreactivity). Scale bar: 25 μm. (C) Quantification of p-H3 in sham versus TAC. Statistical analyses: 2-way ANOVA followed by the Bonferroni procedure or unpaired Student’s t test. Numbers within bars are the numbers of animals examined.
Figure 5
Figure 5. Normalization of heart failure molecular characteristics in D2 mice following TAC surgery.
(A) Quantitative RT-PCR analysis of Nppb expression in sham- and TAC-operated WT and D2 hearts at 1, 3, and 10 weeks after surgery (n = 5 in each group). (B) Quantitative analysis of Ca2+-calmodulin kinase 2δ (CaMK2d) phosphorylation in sham- and TAC-operated WT and D2 hearts at 1, 3, and 10 weeks after surgery (n = 5–6 per group). Statistical analysis: 2-way ANOVA followed by the Bonferroni procedure.
Figure 6
Figure 6. Reduced myocardial fibrosis in D2 mice after TAC surgery.
(A) Representative heart sections stained with Sirius red/fast green from a WT and D2 mouse at 10 weeks following sham or TAC surgery. Scale bar: 50 μm. (B) Quantification of myocardial fibrosis in WT and D2 hearts at 1, 3, and 10 weeks following sham or TAC surgery (peri-vascular regions were excluded from the analyses). Statistical analysis: 2-way ANOVA followed by the Bonferroni procedure. Numbers within bars are the numbers of animals examined.
Figure 7
Figure 7. Reduced cardiomyocyte apoptosis in D2 mice following TAC surgery.
Heart sections from WT and D2 mice at 1, 3, and 10 weeks following sham or TAC surgery were processed for anti–activated caspase 3 immunoreactivity (n = 4–6 per group). The number of immunoreactive activated caspase 3 cardiomyocytes (CMs) per mm2 myocardium is shown. Insert shows a representative activated caspase 3 immunoreactive cardiomyocyte (arrow). Scale bar: 25 μm. Statistical analysis: 2-way ANOVA followed by the Bonferroni procedure.
Figure 8
Figure 8. Exaggerated heart hypertrophy, but reduced cardiomyocyte hypertrophy, in D2 mice following TAC surgery.
(A) Left ventricle weight/tibia length ratio (LV/TL) for WT and D2 mice at 10 weeks following sham or TAC surgery. (B) Minimal fiber diameter (MFD) distribution of WT and D2 septum cardiomyocytes (black and gray columns, respectively) at 1, 3, and 10 weeks following TAC surgery. Statistical analysis: 2-way ANOVA followed by the Bonferroni procedure.
Figure 9
Figure 9. Differentially regulated cell cycle genes in D2 versus WT mice.
Regulated genes (red) in the cell cycle KEGG pathway from RNA-seq analyses at 3 weeks after surgery (n = 5 hearts each) in WT-sham versus D2-sham hearts. Adapted with permission from Kanehisa Laboratories.
Figure 10
Figure 10. Differentially regulated cell cycle genes in D2-TAC versus D2-Shunt.
Regulated genes (red) in the cell cycle KEGG pathway from RNA-seq analyses at 3 weeks after surgery in D2-TAC (n = 3) versus D2-Shunt (n = 5) hearts. Adapted with permission from Kanehisa Laboratories.

References

    1. Grossman W, Jones D, McLaurin LP. Wall stress and patterns of hypertrophy in the human left ventricle. J Clin Invest. 1975;56(1):56–64. doi: 10.1172/JCI108079. - DOI - PMC - PubMed
    1. Hasenfuss G, et al. Energetics of isometric force development in control and volume-overload human myocardium. Comparison with animal species. Circ Res. 1991;68(3):836–846. doi: 10.1161/01.RES.68.3.836. - DOI - PubMed
    1. Huke S, et al. Focal energy deprivation underlies arrhythmia susceptibility in mice with calcium-sensitized myofilaments. Circ Res. 2013;112(10):1334–1344. doi: 10.1161/CIRCRESAHA.113.301055. - DOI - PMC - PubMed
    1. Belke DD, et al. Insulin signaling coordinately regulates cardiac size, metabolism, and contractile protein isoform expression. J Clin Invest. 2002;109(5):629–639. doi: 10.1172/JCI13946. - DOI - PMC - PubMed
    1. Backs J, et al. The delta isoform of CaM kinase II is required for pathological cardiac hypertrophy and remodeling after pressure overload. Proc Natl Acad Sci U S A. 2009;106(7):2342–2347. doi: 10.1073/pnas.0813013106. - DOI - PMC - PubMed

Publication types