. 2017 Dec;49(12):1714-1721.
doi: 10.1038/ng.3959. Epub 2017 Oct 30.

Genetic variation and gene expression across multiple tissues and developmental stages in a nonhuman primate

Affiliations

Genetic variation and gene expression across multiple tissues and developmental stages in a nonhuman primate

Anna J Jasinska et al. Nat Genet. 2017 Dec.

Abstract

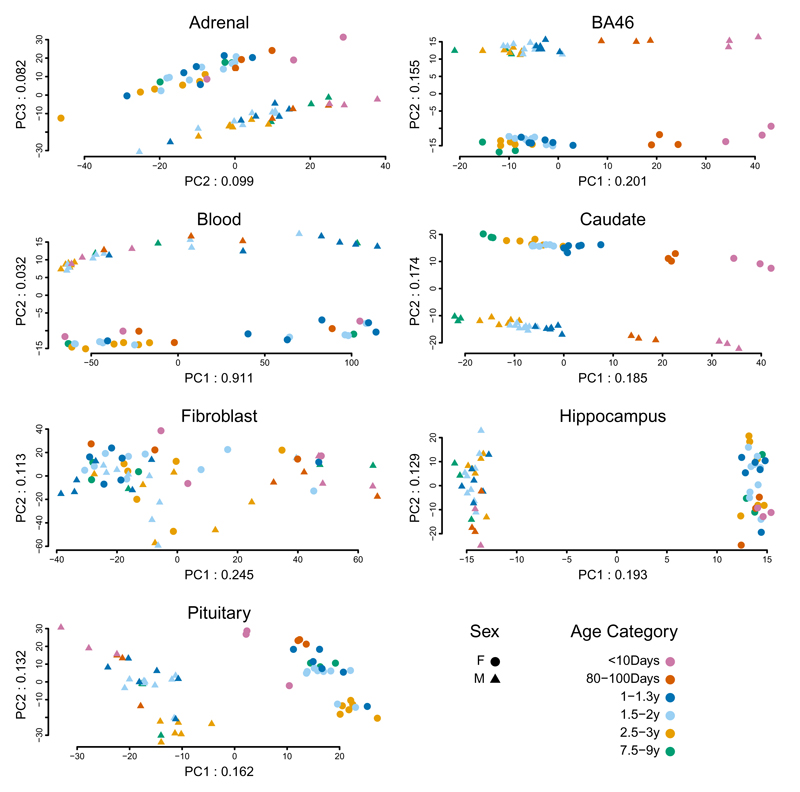
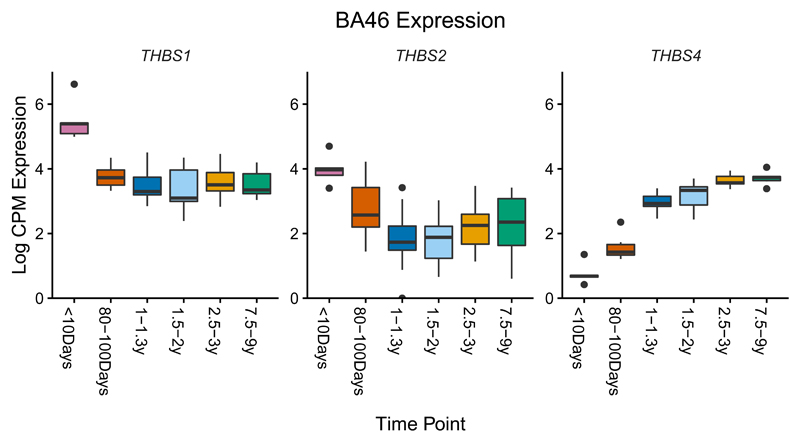
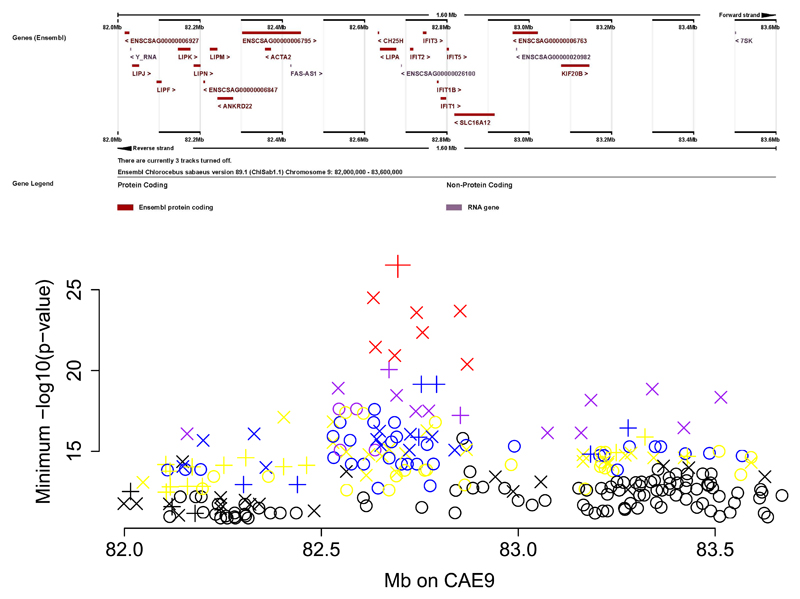
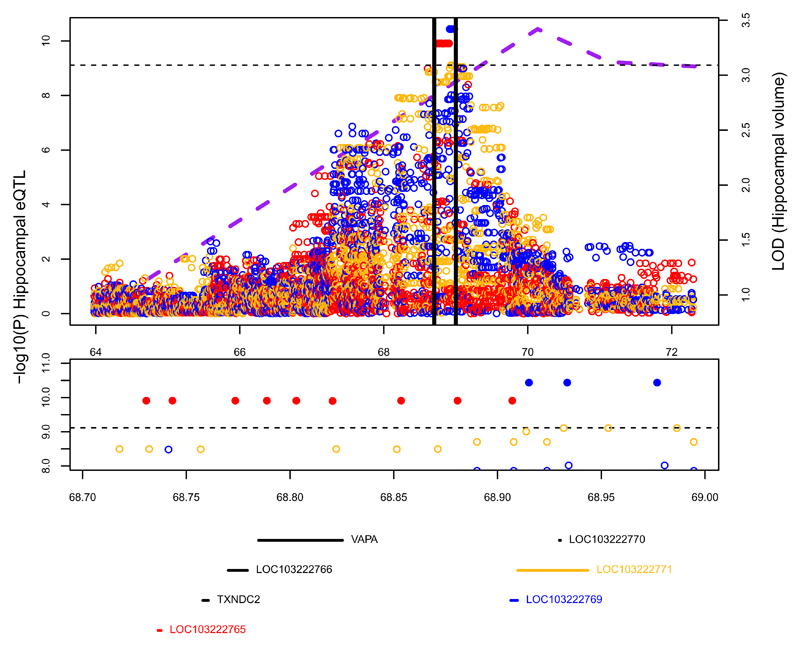
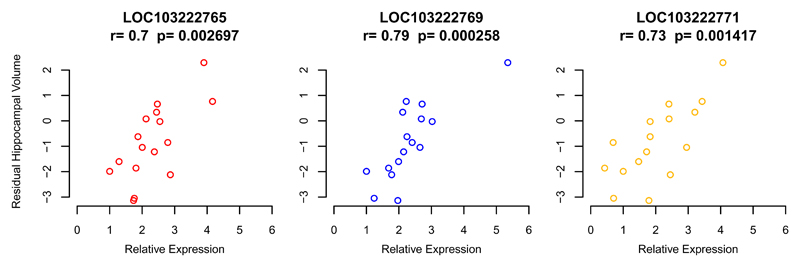
By analyzing multitissue gene expression and genome-wide genetic variation data in samples from a vervet monkey pedigree, we generated a transcriptome resource and produced the first catalog of expression quantitative trait loci (eQTLs) in a nonhuman primate model. This catalog contains more genome-wide significant eQTLs per sample than comparable human resources and identifies sex- and age-related expression patterns. Findings include a master regulatory locus that likely has a role in immune function and a locus regulating hippocampal long noncoding RNAs (lncRNAs), whose expression correlates with hippocampal volume. This resource will facilitate genetic investigation of quantitative traits, including brain and behavioral phenotypes relevant to neuropsychiatric disorders.


Figures

Fig. 1
Fig. 1
PCA of 1,000 genes with the most variable expression levels. Analysis was performed separately by tissue; sample size was 60 animals for adrenal, blood, fibroblasts, and pituitary and 59 for BA46, caudate, and hippocampus. Numbers in the labels for x and y axes indicate the proportion of total variance accounted for by that PC.
Fig. 2
Fig. 2
Boxplot of log counts per million (CPM) expression in samples of BA46 from 58 animals vs. timepoint, for three genes with a strong relationship between expression pattern and age. The inter-quartile range defines the height of the box, and whiskers extend to 1.5x the inter-quartile range. Outliers are indicated as individual points. In each box, the median is represented by the horizontal black bar.
Fig. 3
Fig. 3
Master regulatory locus on vervet chromosome CAE 9. Upper panel: Ensembl view of the CAE 9 region. Lower panel: The minimum –log10(p-value) for each SNP in association analyses vs. expression in 347 animals of microarray probes on different chromosomes. The symbols are color-coded to represent the number of probes significantly associated to each SNP: 1-2 probes (black), 3-4 probes (yellow), 5-6 probes (blue), 7-10 probes (purple), 11-14 probes (red). Symbols indicate the p-value from analysis of expression in Dataset 2 (RNA-Seq). Cross: p<2.35e-05; X: p<0.001; circle: p>0.001. The large red X at the top of the plot is CAE9_82694171.
Fig. 4
Fig. 4
Hippocampal volume QTL and local hippocampal eQTLs in RNA-Seq analysis. Top panel: purple dotted line is the multipoint LOD score for hippocampal volume (measured in 347 animals). Circles represent evidence for association of SNPs to hippocampal expression in 58 animals of three genes: LOC103222765 (red), LOC103222769 (blue) and LOC103222771 (gold). Solid circles indicate genome-wide significant associations. The region between the black vertical lines is blown up in the middle and bottom panels. The horizontal dotted line represents the genome-wide significant threshold for local eQTLs. Middle panel: SNPs with –log10(p-value)>8 for association to expression in hippocampus, color codes are as in the top panel. Bottom panel: Genes sited between 68.7 and 69 Mb (the eQTL region). Color codes are as in the top panel. The Pearson correlations for expression between these three genes are: LOC103222765-LOC103222769 r=-0.16; LOC103222765-LOC103222771 r=0.32; LOC103222769-LOC103222771 r=0.60.
Fig. 5
Fig. 5
Correlation in 16 animals of hippocampal volume (MRI) with hippocampal expression of LOC103222765 (left), LOC103222769 (middle) and LOC103222771 (right). The expression data are from qRT-PCR. Quantification was performed using the relative standard curve method, with the reference gene HPRT1 used as an endogenous control for normalization of the interpolated lncRNA quantities. Hippocampal volume measurements are residuals from a regression on covariates of age and sex. “r” is the Pearson correlation coefficient, and the p-value tests the null hypothesis that r=0. The Pearson correlation between expression of these three genes are: LOC103222765-LOC103222769 r=0.56; LOC103222765-LOC103222771 r=0.64; LOC103222769-LOC103222771 r=0.63.

References

    1. Hindorff LA, et al. Potential etiologic and functional implications of genome-wide association loci for human diseases and traits. Proc Natl Acad Sci U S A. 2009;106:9362–7. - PMC - PubMed
    1. Nicolae DL, et al. Trait-associated SNPs are more likely to be eQTLs: annotation to enhance discovery from GWAS. PLoS Genet. 2010;6:e1000888. - PMC - PubMed
    1. Albert FW, Kruglyak L. The role of regulatory variation in complex traits and disease. Nat Rev Genet. 2015;16:197–212. - PubMed
    1. Gilad Y, Rifkin SA, Pritchard JK. Revealing the architecture of gene regulation: the promise of eQTL studies. Trends Genet. 2008;24:408–15. - PMC - PubMed
    1. Gibson G, Powell JE, Marigorta UM. Expression quantitative trait locus analysis for translational medicine. Genome Med. 2015;7:60. - PMC - PubMed