. 2018 Apr;67(4):1284-1302.
doi: 10.1002/hep.29623. Epub 2018 Feb 22.

The circulating microbiome signature and inferred functional metagenomics in alcoholic hepatitis

Affiliations

The circulating microbiome signature and inferred functional metagenomics in alcoholic hepatitis

Puneet Puri et al. Hepatology. 2018 Apr.

Abstract

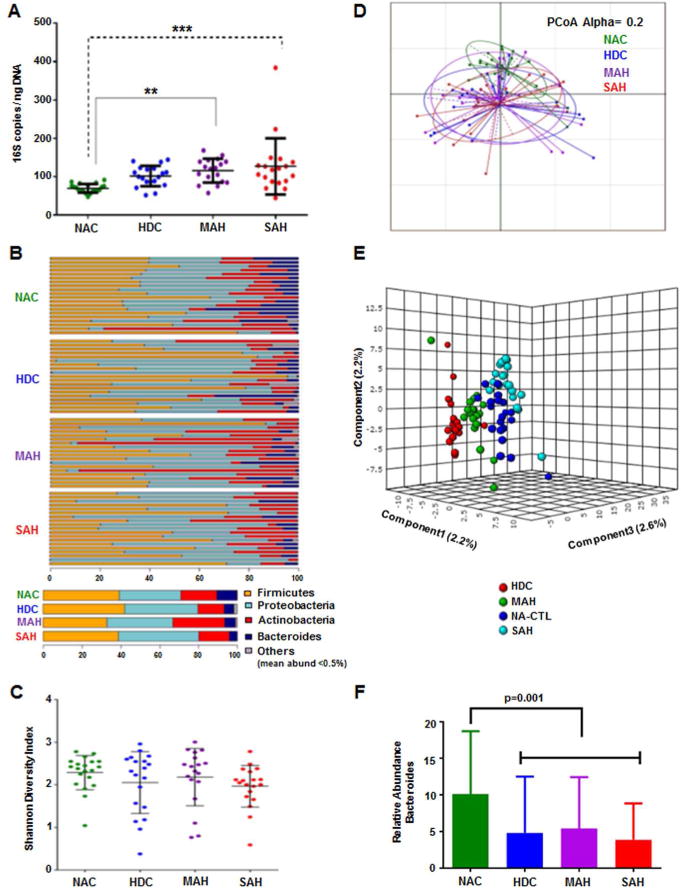
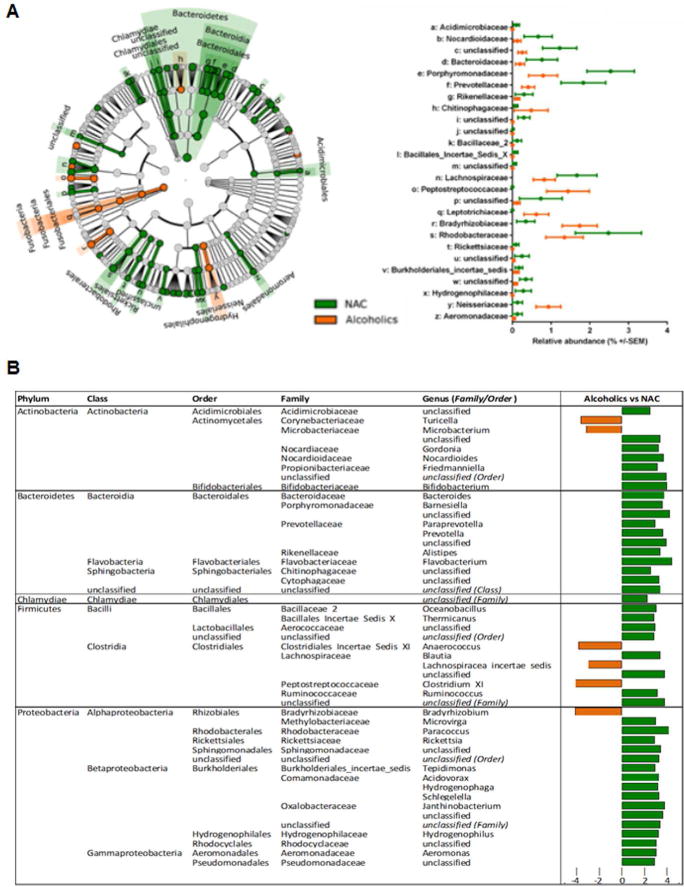
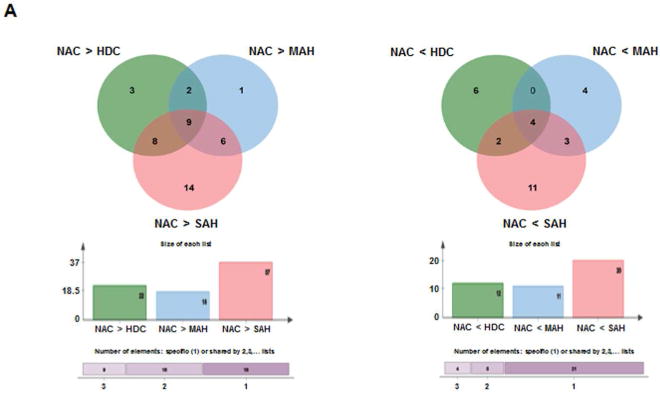
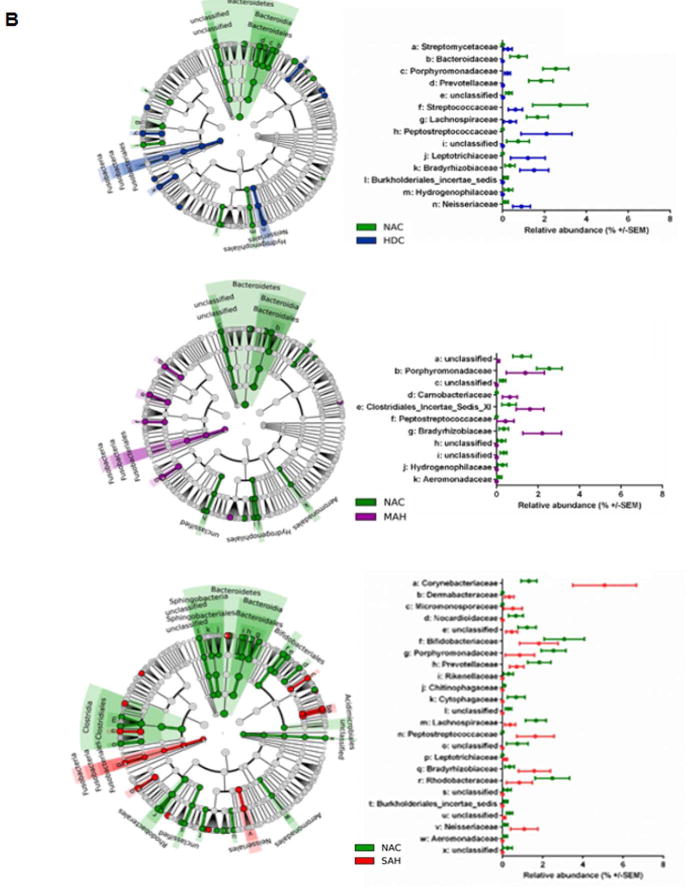
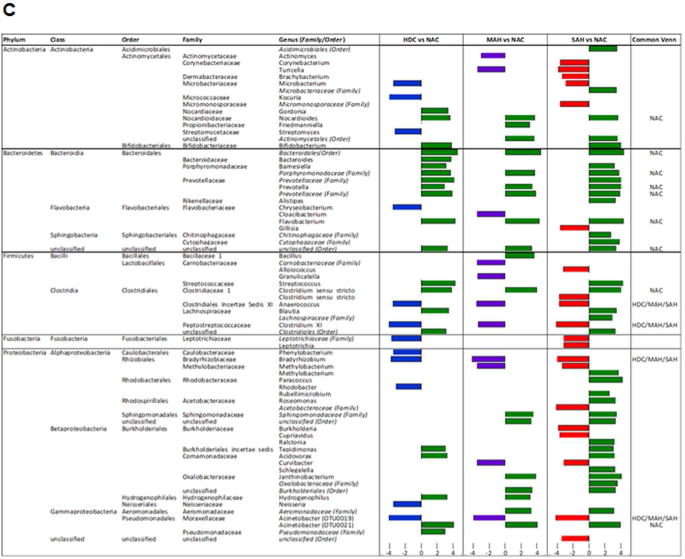
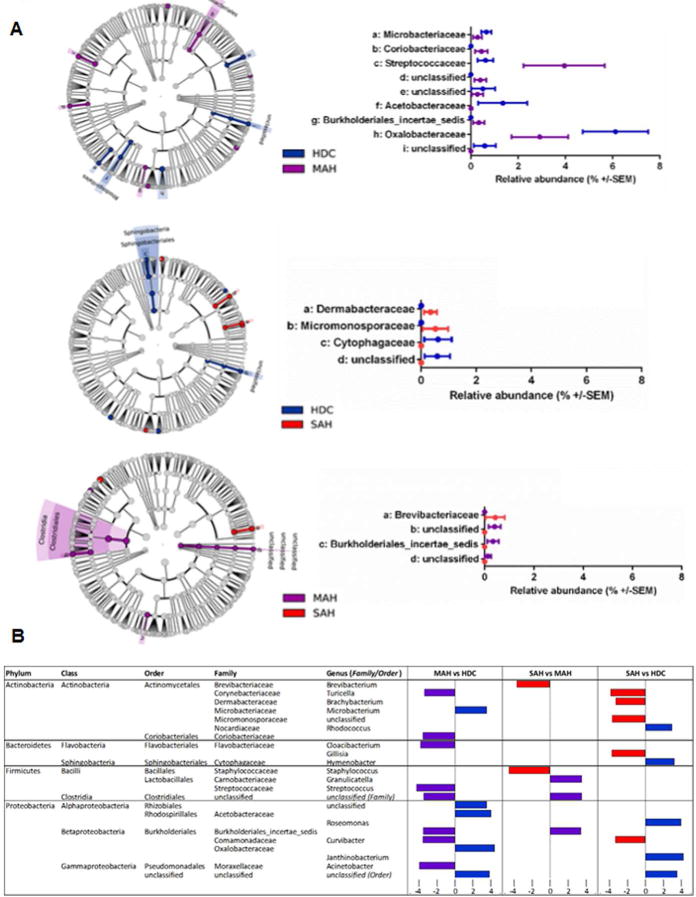
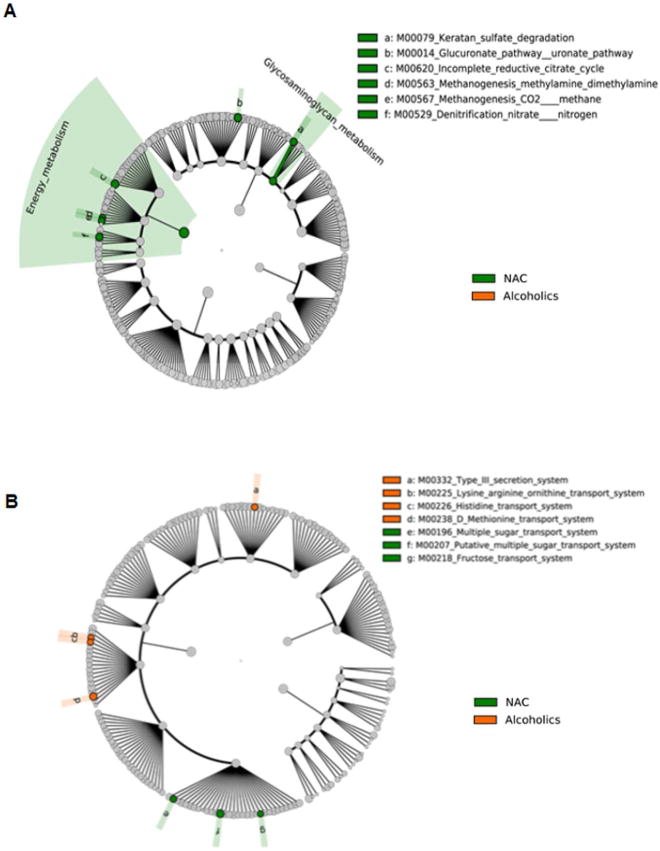
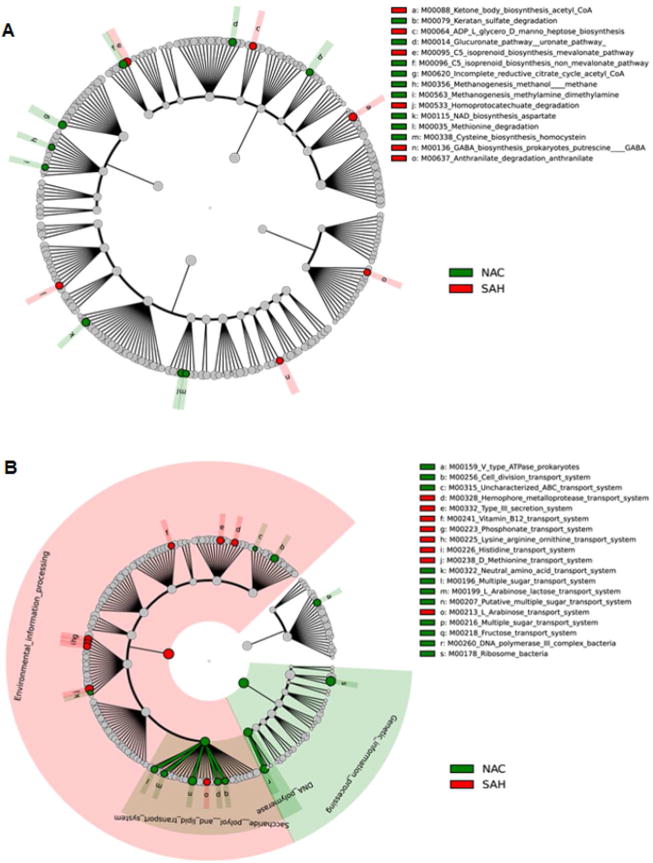
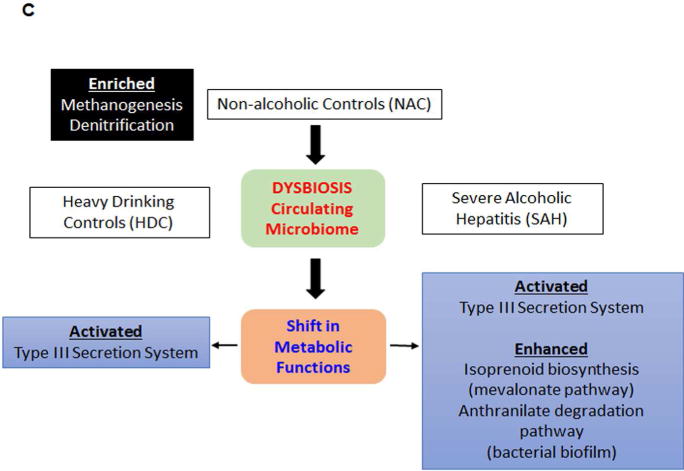
Intestinal dysbiosis is implicated in alcoholic hepatitis (AH). However, changes in the circulating microbiome, its association with the presence and severity of AH, and its functional relevance in AH is unknown. Qualitative and quantitative assessment of changes in the circulating microbiome were performed by sequencing bacterial DNA in subjects with moderate AH (MAH) (n = 18) or severe AH (SAH) (n = 19). These data were compared with heavy drinking controls (HDCs) without obvious liver disease (n = 19) and non-alcohol-consuming controls (NACs, n = 20). The data were related to endotoxin levels and markers of monocyte activation. Linear discriminant analysis effect size (LEfSe) analysis, inferred metagenomics, and predictive functional analysis using PICRUSt were performed. There was a significant increase in 16S copies/ng DNA both in MAH (P < 0.01) and SAH (P < 0.001) subjects. Compared with NACs, the relative abundance of phylum Bacteroidetes was significantly decreased in HDCs, MAH, and SAH (P < 0.001). In contrast, all alcohol-consuming groups had enrichment with Fusobacteria; this was greatest for HDCs and decreased progressively in MAH and SAH. Subjects with SAH had significantly higher endotoxemia (P = 0.01). Compared with alcohol-consuming groups, predictive functional metagenomics indicated an enrichment of bacteria with genes related to methanogenesis and denitrification. Furthermore, both HDCs and SAH showed activation of a type III secretion system that has been linked to gram-negative bacterial virulence. Metagenomics in SAH versus NACs predicted increased isoprenoid synthesis via mevalonate and anthranilate degradation, known modulators of gram-positive bacterial growth and biofilm production, respectively.

Conclusion: Heavy alcohol consumption appears to be the primary driver of changes in the circulating microbiome associated with a shift in its inferred metabolic functions. (Hepatology 2018;67:1284-1302).


Conflict of interest statement

Conflicts of interest: None relevant for this paper.

Figures

Fig 1
Fig 1. Whole blood sample 16S rDNA sequence, diversity analysis and relative taxonomic abundances
A: A scatter plot depicting 16S copies/ngDNA among the study groups. There is a step wise increase in 16S copies/ngDNA from NAC to HDC to MAH to SAH. Compared to NAC group, both MAH and SAH showed significantly higher 16S copies/ngDNA using Kruskal Wallis test. B: Stacked column bar graphs depicting the individual sample phylum level taxonomic abundance by study group for 16S targeted sequence analysis. Taxa were identified by name for the most abundant phyla or merged into the “Other” category for below 0.5% abundance. C: Plots of microbiome alpha diversity (Shannon index), representing the mean of species diversity per sample at the genus level with respect to alcohol use study groups, demonstrating a small but insignificant shift toward lower diversity in alcohol using subjects and corresponding to disease severity. D: Principal Component Analysis (PCoA) unsupervised dimensional reduction plots depicting the relationships between the microbiomes with respect to alcohol use study groups based on weighted UniFrac methodology for β-diversity. E: On Partial Least Square Discriminant Analysis the study groups are separated by supervised dimensionality reduction multivariate regression model. F: Stacked column bar graphs depicting the average phylum level taxonomic abundance by study group for 16S targeted sequence analysis. Taxa were identified by name for the most abundant phyla or merged into the “Other” category for below 0.5% abundance. Significantly lower relative abundance of the phylum Bacteroidetes was seen in the alcoholic (HDC, MAH, SAH) vs. the nonalcoholic controls (NAC) using Kruskal Wallis test. NAC = Non Alcoholic Controls, HDC = Heavy Drinking Controls, MAH = Moderate Alcoholic Hepatitis, SAH = Severe Alcoholic Hepatitis
Fig. 2
Fig. 2. Differential group taxonomic features relative to use of alcohol
A: LDA Effect Size (LEfSe) cladograms of pairwise analysis for nonalcoholic controls (NAC) and combined alcoholic groups (HDC + MAH + SAH) for 16S rDNA sequence analysis of whole blood samples. The cladogram shows the taxonomic levels represented by rings with phyla at the innermost ring and genera at the outermost ring, and each circle is a member within that level. Taxa at each level are shaded green (NAC) or orange (Alcoholics) in which it is more abundant (P < 0.05; LDA score >2.0). The LEfSe analysis indicates differential signatures based on alcohol use by subjects. B (Table): LDA effect size plots of pairwise analysis for the nonalcoholic controls (NAC) and combined alcoholic groups (HDC + MAH + SAH) for 16S rDNA sequence analysis of whole blood samples. The phylum and subsequent taxonomic levels are sorted alphabetically and the corresponding LDA score indicated in the furthest right column according to the group in which it is more abundant (P < 0.05; LDA score >2.0).
Fig. 3
Fig. 3. Differential group taxonomic features relative to nonalcoholic control study group
A: Venn diagrams indicating the number of common differential features (KW<0.05, LDA>2.0) from any taxonomic level (phylum to genus) that are enriched in the nonalcoholic group (NAC, left panel Venn) or enriched in the alcoholic groups (HDC + MAH + SAH, right panel Venn). B: LDA Effect Size (LEfSe) cladograms of pairwise analysis for the nonalcoholic controls (NAC) and each individual alcoholic group (HDC, MAH, or SAH) for 16S rDNA sequence analysis of whole blood samples. The cladogram shows the taxonomic levels represented by rings with phyla at the innermost ring and genera at the outermost ring, and each circle is a member within that level. Taxa at each level are shaded green (NAC), blue (HDC), violet (MAH), or red (SAH) according to the alcohol use group in which it is more abundant (P < 0.05; LDA score >2.0). C (Table): LDA effect size plots of pairwise analysis with nonalcoholic controls (NAC) and each individual alcoholic group (HDC, MAH, or SAH) for 16S rDNA sequence analysis of whole blood samples. The phylum and subsequent taxonomic levels are sorted alphabetically and the corresponding LDA scores for each pairwise analysis with the NAC group are indicated in columns to the right according to the group in which it is more abundant (P < 0.05; LDA score >2.0). The furthest right column indicates the nine common taxonomic features enriched in the NAC group and the four common taxonomic features enriched in the alcoholic groups.
Fig. 4
Fig. 4. Distinct Circulating Microbiome Enrichment in Alcoholic Hepatitis
A: LDA Effect Size (LEfSe) cladograms of pairwise analysis for each alcoholic group (HDC, MAH, and SAH) for 16S rDNA sequence analysis of whole blood samples. The cladogram shows the taxonomic levels represented by rings with phyla at the innermost ring and genera at the outermost ring, and each circle is a member within that level. Taxa at each level are shaded blue (HDC), violet (MAH), or red (SAH) according to the alcohol use group in which it is more abundant (P < 0.05; LDA score >2.0). B (Table): LDA effect size plots of pairwise analysis for each alcoholic group (HDC, MAH, and SAH) for 16S rDNA sequence analysis of whole blood samples. The phylum and subsequent taxonomic levels are sorted alphabetically and the corresponding LDA scores for each pairwise analysis are indicated in columns to the right according to the group in which it is more abundant (P < 0.05; LDA score >2.0).
Fig 5
Fig 5. Disease severity MELD regression plots
Regression analysis plots of 16S rDNA sequence relative abundance relative to MELD disease score. Two genera, Janthinobacterium and Enhydrobacter, from the phylum Proteobacteria were identified to have a negative correlation with MELD disease score. HDC (blue), MAH (purple) and SAH (red).
Fig 6
Fig 6. Predicted metagenome metabolic pathway and structural complex analysis
LDA Effect Size (LEfSe) cladograms of pairwise analysis for the nonalcoholic controls (NAC) and combined alcoholic groups (HDC + MAH + SAH). The cladograms show the KEGG hierarchy for A) metabolic pathways and B) structural complexes represented by rings with the pathway or structural modules at the outermost ring, and each circle is a member within that level. KEGG modules are shaded green (NAC) or orange (alcoholics) according to the study group in which it is more abundant (P < 0.05; LDA score >2.0).
Fig 7
Fig 7. Predicted metagenome metabolic pathway and structural complex analysis
LDA Effect Size (LEfSe) cladograms of pairwise analysis for the nonalcoholic controls (NAC) and severe alcoholic hepatitis (SAH). The cladograms show the KEGG hierarchy for A) metabolic pathways and B) structural complexes represented by rings with the pathway or structural modules at the outermost ring, and each circle is a member within that level. KEGG modules are shaded green (NAC) or red (SAH) according to the study group in which it is more abundant (P < 0.05; LDA score >2.0). C) An overview of changes in the metabolic function and structural complex in HDC and SAH compared to NAC.

Comment in

References

    1. Jewell J, Sheron N. Trends in European liver death rates: implications for alcohol policy. Clin Med (Lond) 2010;10:259–263. - PMC - PubMed
    1. Rehm J, Samokhvalov AV, Shield KD. Global burden of alcoholic liver diseases. J Hepatol. 2013;59:160–168. - PubMed
    1. Case A, Deaton A. Rising morbidity and mortality in midlife among white non-Hispanic Americans in the 21st century. Proc Natl Acad Sci U S A. 2015;112:15078–15083. - PMC - PubMed
    1. Teli MR, Day CP, Burt AD, Bennett MK, James OF. Determinants of progression to cirrhosis or fibrosis in pure alcoholic fatty liver. Lancet. 1995;346:987–990. - PubMed
    1. Liangpunsakul S, Puri P, Shah VH, Kamath P, Sanyal A, Urban T, Ren X, et al. Effects of Age, Sex, Body Weight, and Quantity of Alcohol Consumption on Occurrence and Severity of Alcoholic Hepatitis. Clin Gastroenterol Hepatol. 2016;14:1831–1838e1833. - PMC - PubMed

Publication types