. 2017 Oct 30;13(10):e1005836.
doi: 10.1371/journal.pcbi.1005836. eCollection 2017 Oct.

Maximum entropy methods for extracting the learned features of deep neural networks

Affiliations

Maximum entropy methods for extracting the learned features of deep neural networks

Alex Finnegan et al. PLoS Comput Biol. .

Abstract

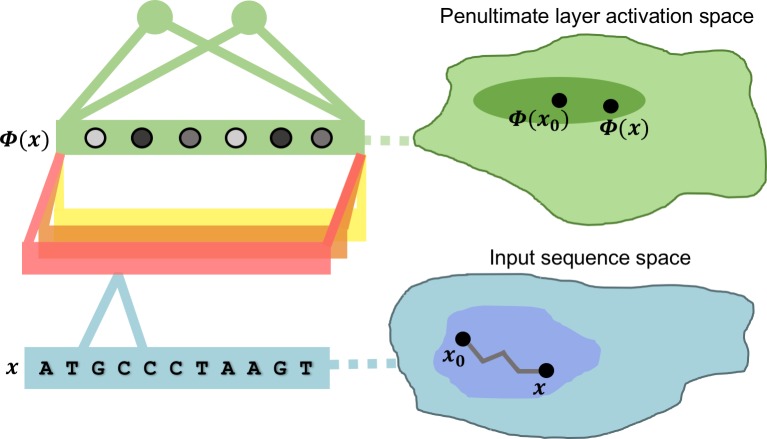
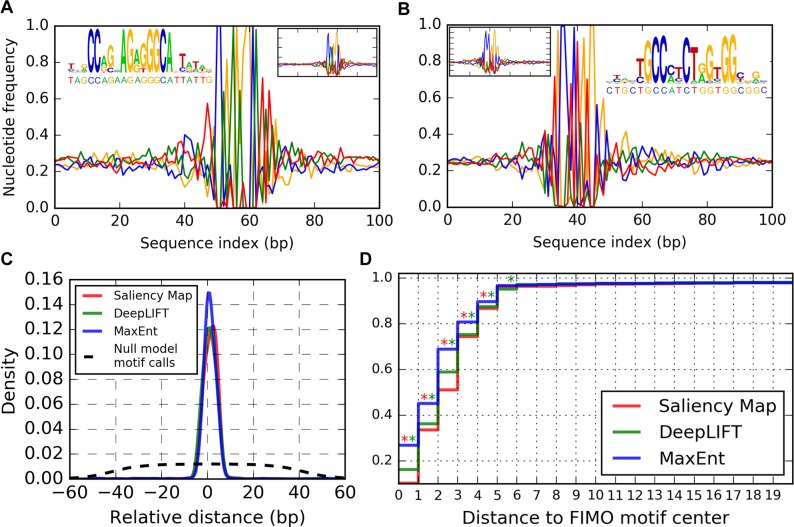
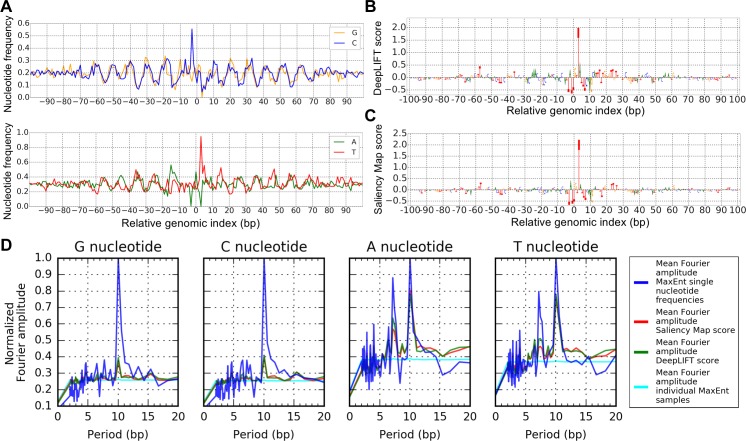
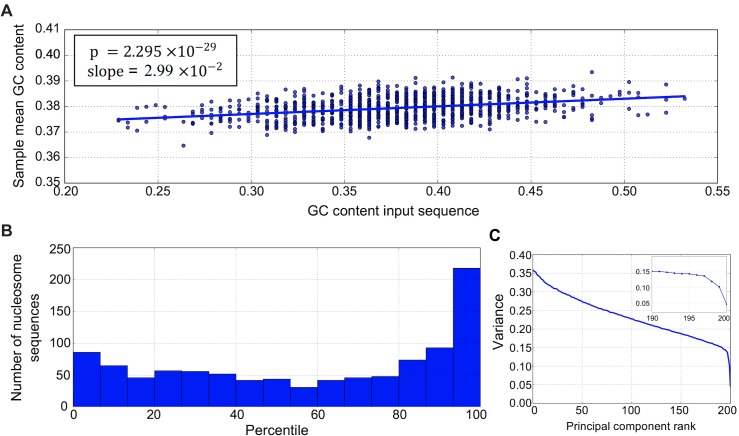
New architectures of multilayer artificial neural networks and new methods for training them are rapidly revolutionizing the application of machine learning in diverse fields, including business, social science, physical sciences, and biology. Interpreting deep neural networks, however, currently remains elusive, and a critical challenge lies in understanding which meaningful features a network is actually learning. We present a general method for interpreting deep neural networks and extracting network-learned features from input data. We describe our algorithm in the context of biological sequence analysis. Our approach, based on ideas from statistical physics, samples from the maximum entropy distribution over possible sequences, anchored at an input sequence and subject to constraints implied by the empirical function learned by a network. Using our framework, we demonstrate that local transcription factor binding motifs can be identified from a network trained on ChIP-seq data and that nucleosome positioning signals are indeed learned by a network trained on chemical cleavage nucleosome maps. Imposing a further constraint on the maximum entropy distribution also allows us to probe whether a network is learning global sequence features, such as the high GC content in nucleosome-rich regions. This work thus provides valuable mathematical tools for interpreting and extracting learned features from feed-forward neural networks.


Conflict of interest statement

The authors have declared that no competing interests exist.

Figures

Fig 1
Fig 1. Schematic representation of our MaxEnt interpretation method.
An unseen sequence x elicits penultimate unit activations (shaded dots in left figure) via non-linear operations of intermediate layers (illustrated as a horizontal stack of convolutional filters). The MaxEnt method for interpreting a given input sequence x0 assigns probability to a new sequence x according to its similarity to x0 in the space of penultimate activations. The irregular path connecting x0 and x in sequence space illustrates the steps of MCMC.
Fig 2
Fig 2. Interpretation of XOR network inputs.
(A, B) Scatter plots of interpretation scores assigned to the 0th and 1st sequence position by Saliency Map and DeepLIFT interpretation, respectively, for the AA network input. Markers at the origin have size proportional to number of overlapping data points. Colors in (B) indicate DeepLIFT interpretation scores using different reference inputs (see S3 Text). (C, D) Same as (A, B), respectively, but for the GG network input. (E) Density of MCMC samples from MaxEnt distribution (2) for AA input. Densities are normalized by the most abundant dinucleotide. Green boxes highlight the set of dinucleotide inputs belonging to class 1. (F) Same as (E) but for the GG network input. All results are interpretation of the same 30 ANNs.
Fig 3
Fig 3. Interpretation of CTCF-bound sequences.
(A, B) Nucleotide frequencies of MCMC samples from MaxEnt distribution (2) for two input sequences that the ANN correctly identified as CTCF bound. Main plots correspond to sampling at β = 400; inset line plots correspond to sampling at β = 100, illustrating the multiscale nature of our interpretation method. Inset sequence logos show the called motifs, with the corresponding input sequences indicated below the horizontal axis. Colors green, blue, orange, red correspond to A, C, G, T. (C) Kernel-density smoothed distribution of relative distances between motifs called by network interpretation methods and motifs called by FIMO. Null model density is estimated by calling motif positions with uniform probability over the set of 19bp intervals contained in the 101 bp network inputs. (D) Cumulative distribution of the absolute distances from (C). Red asterisk at (x,x+1) indicates significantly fewer Saliency Map motif calls than MaxEnt motif calls within x bp from a FIMO motif (one-sided binominal test, p < 0.01)). Green asterisks indicate the similar comparison between DeepLIFT and MaxEnt motif calls.
Fig 4
Fig 4. Interpretation of nucleosome positioning signals.
(A) Nucleotide frequencies for samples from MaxEnt distribution (2) associated with a single nucleosomal input sequence. (B) DeepLIFT interpretation scores for the input analyzed in (A). (C) Saliency Map interpretation scores for the input analyzed in (A) (representation of DeepLIFT and Saliency Map scores uses code from [8]). (D) Normalized Fourier amplitudes of interpretation scores averaged over 2500 interpreted nucleosomal sequences correctly classified by the network. Note vertical axis is scale by maximum value.
Fig 5
Fig 5. Assessing the importance of GC content for nucleosome positioning.
(A) Distribution of GC content of 1000 network input sequences corresponding to nucleosomal DNA and the mean GC content of samples associated with these inputs. (B) Histogram of the percentiles of GC feature importance scores in the distribution of importance scores of 300 “dummy” sequence features. Histogram summarizes percentiles of GC feature importance scores for 1000 nucleosomal sequences. (C) Example of decay in variance associated with ranked principal component vectors in PCA analysis of samples from the distribution (2).

References

    1. Alipanahi B, Delong A, Weirauch MT, Frey BJ. Predicting the sequence specificities of DNA- and RNA-binding proteins by deep learning. Nat Biotechnol. 2015;33(8):831–8. doi: 10.1038/nbt.3300 . - DOI - PubMed
    1. Zeng H, Edwards MD, Liu G, Gifford DK. Convolutional neural network architectures for predicting DNA-protein binding. Bioinformatics. 2016;32(12):i121–i7. doi: 10.1093/bioinformatics/btw255 ; PubMed Central PMCID: PMCPMC4908339. - DOI - PMC - PubMed
    1. Zhou J, Troyanskaya OG. Predicting effects of noncoding variants with deep learning-based sequence model. Nat Methods. 2015;12(10):931–4. doi: 10.1038/nmeth.3547 ; PubMed Central PMCID: PMCPMC4768299. - DOI - PMC - PubMed
    1. Kelley DR, Snoek J, Rinn JL. Basset: learning the regulatory code of the accessible genome with deep convolutional neural networks. Genome Res. 2016;26(7):990–9. doi: 10.1101/gr.200535.115 ; PubMed Central PMCID: PMCPMC4937568. - DOI - PMC - PubMed
    1. Zeng H, Gifford DK. Predicting the impact of non-coding variants on DNA methylation. Nucleic acids research. 2017. doi: 10.1093/nar/gkx177 . - DOI - PMC - PubMed