. 2018 May 1;28(13):1187-1208.
doi: 10.1089/ars.2017.7373. Epub 2017 Dec 11.

SIRT1 Controls Acetaminophen Hepatotoxicity by Modulating Inflammation and Oxidative Stress

Affiliations

SIRT1 Controls Acetaminophen Hepatotoxicity by Modulating Inflammation and Oxidative Stress

Patricia Rada et al. Antioxid Redox Signal. .

Abstract

Aims: Sirtuin 1 (SIRT1) is a key player in liver physiology and a therapeutic target against hepatic inflammation. We evaluated the role of SIRT1 in the proinflammatory context and oxidative stress during acetaminophen (APAP)-mediated hepatotoxicity.

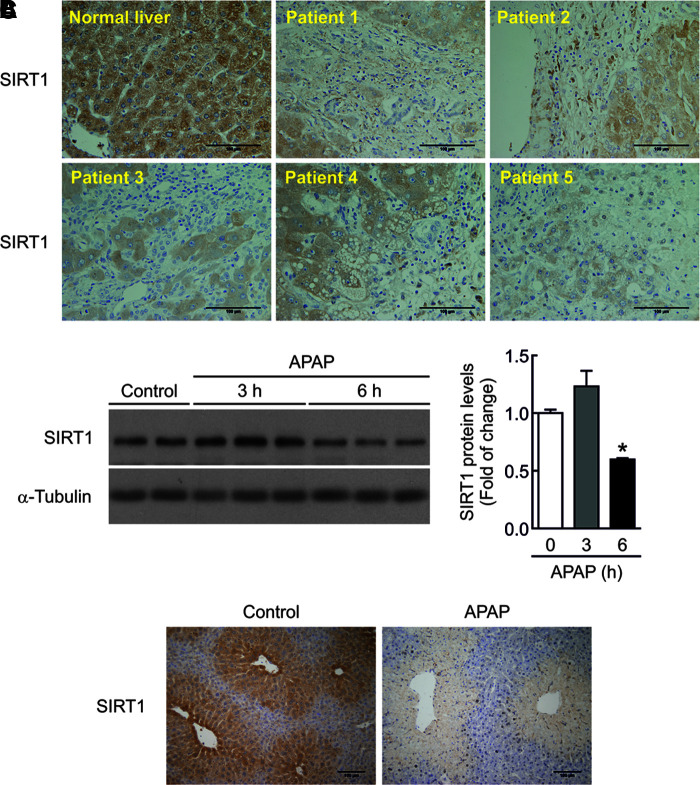
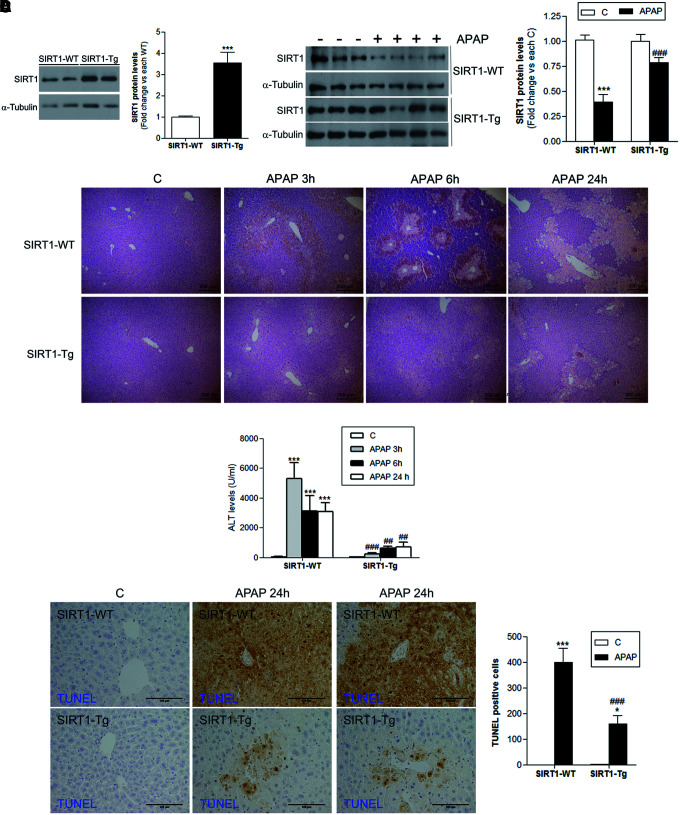
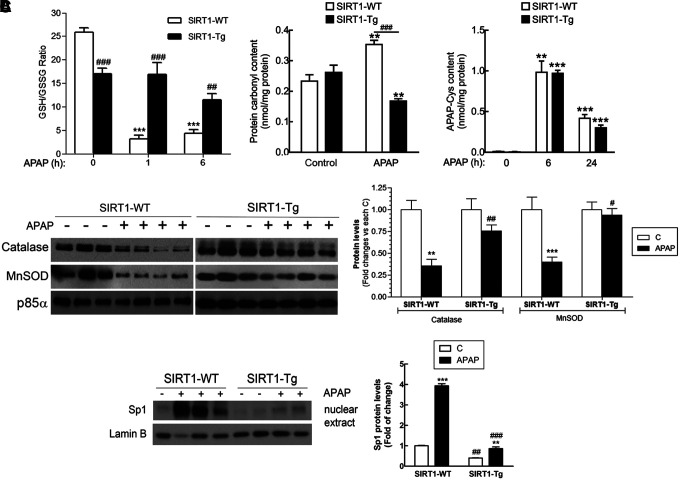
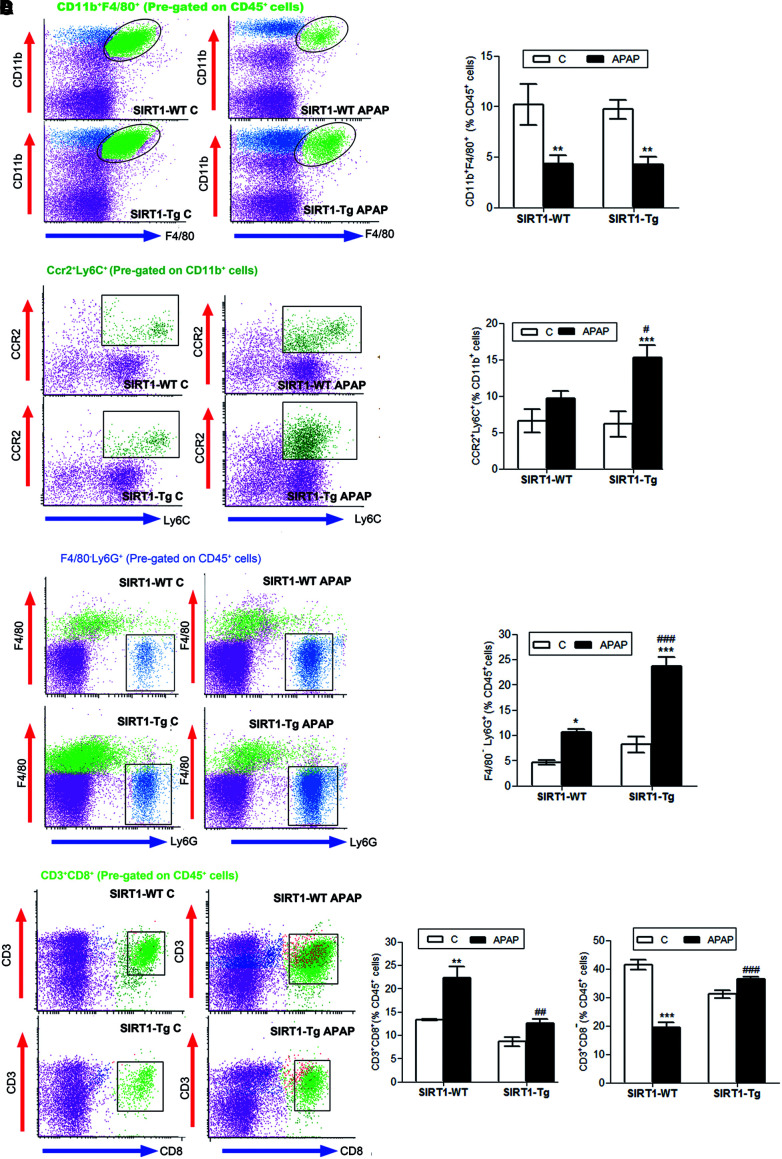
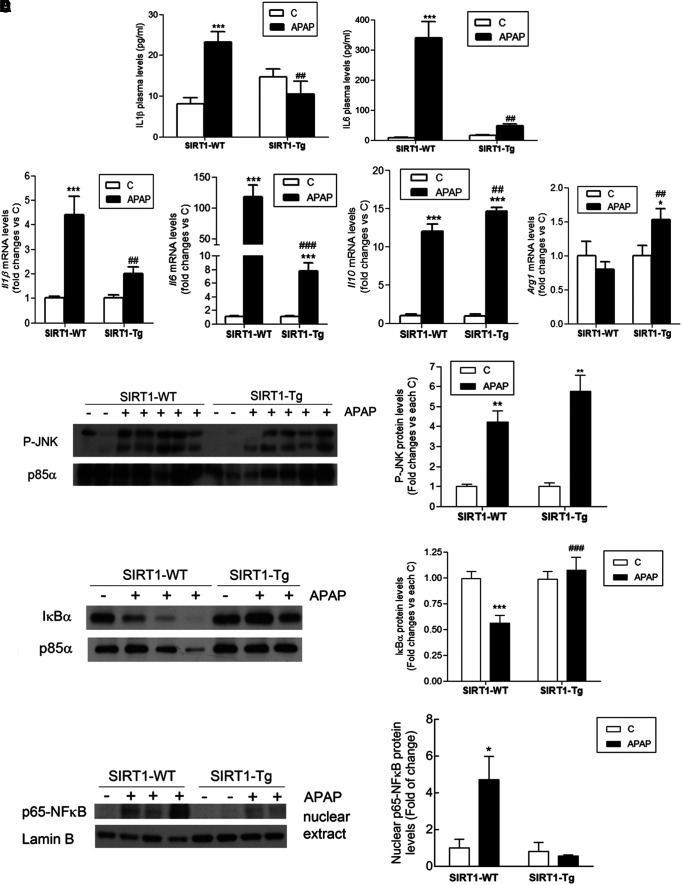
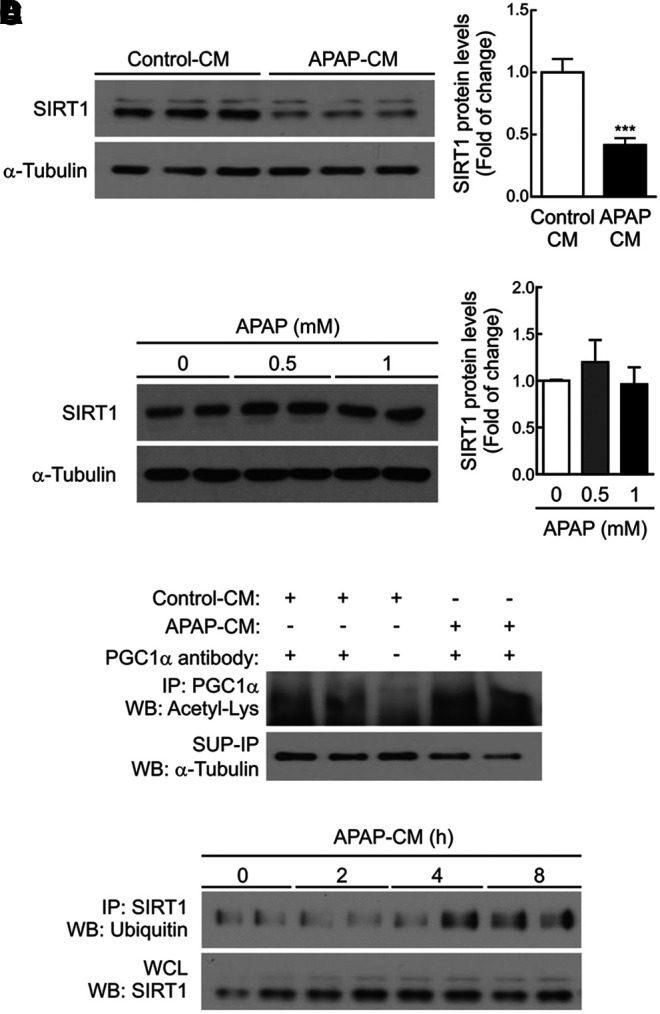
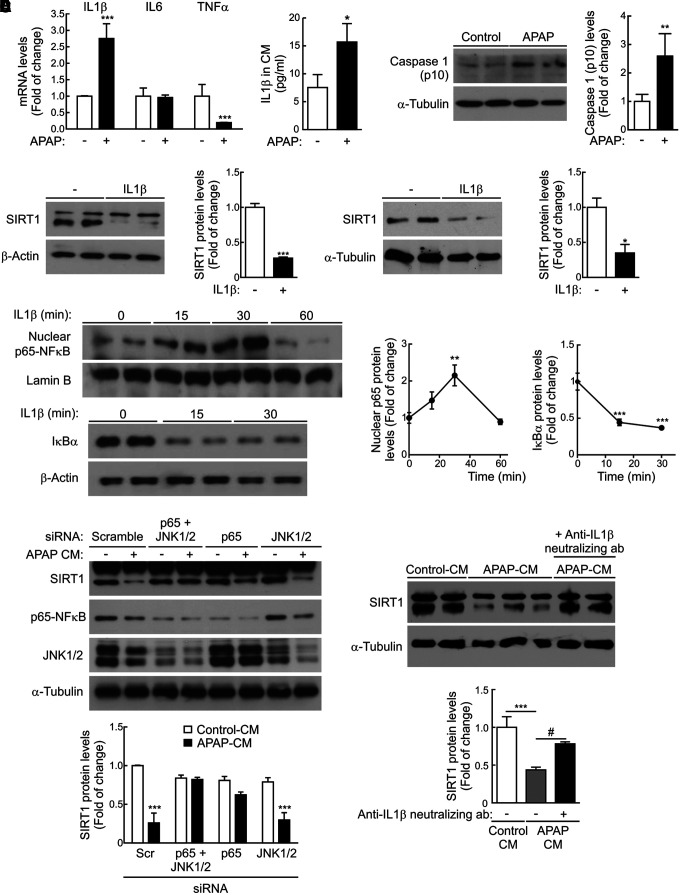
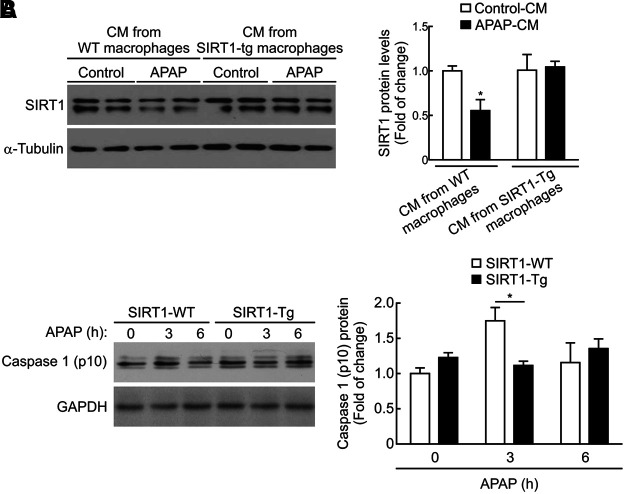
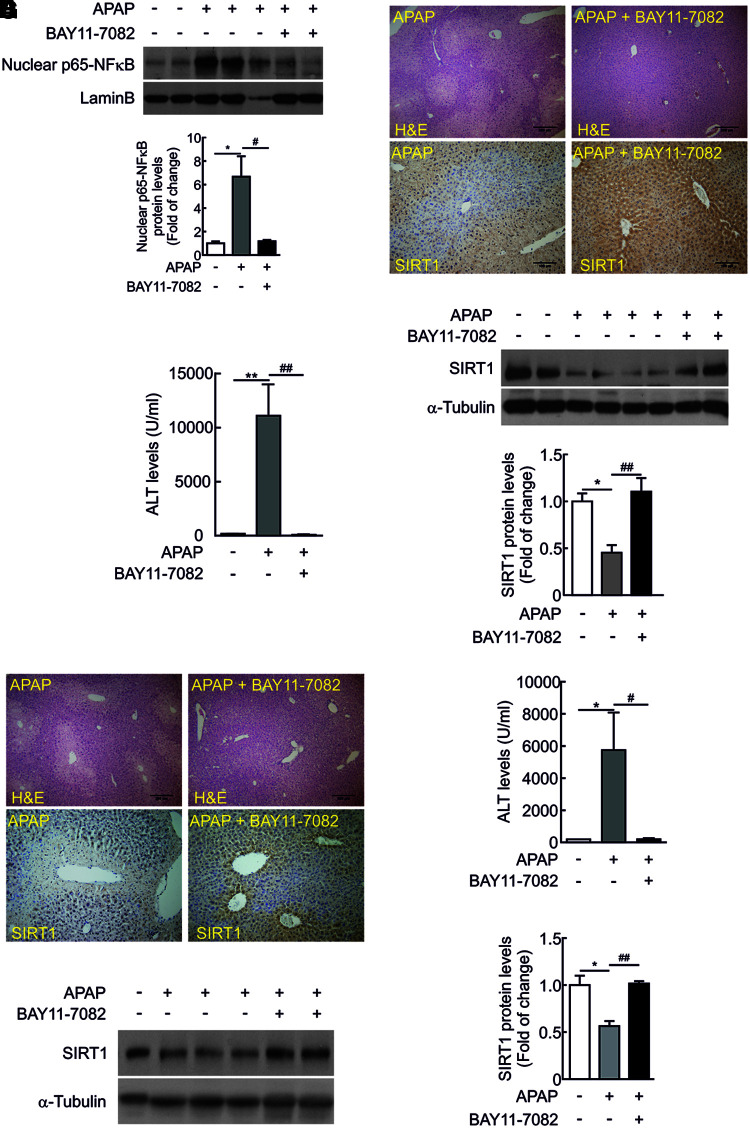
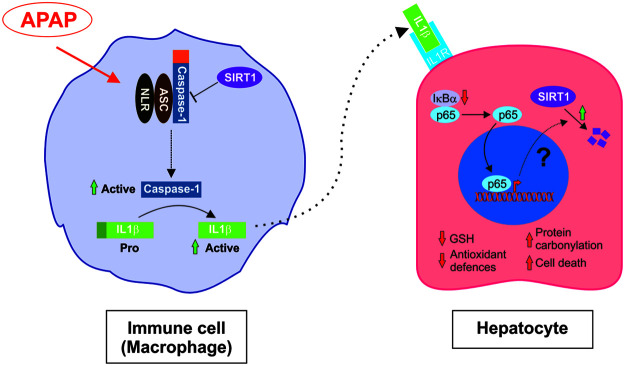
Results: SIRT1 protein levels decreased in human and mouse livers following APAP overdose. SIRT1-Tg mice maintained higher levels of SIRT1 on APAP injection than wild-type mice and were protected against hepatotoxicity by modulation of antioxidant systems and restrained inflammatory responses, with decreased oxidative stress, proinflammatory cytokine messenger RNA levels, nuclear factor kappa B (NFκB) signaling, and cell death. Mouse hepatocytes stimulated with conditioned medium of APAP-treated macrophages (APAP-CM) showed decreased SIRT1 levels; an effect mimicked by interleukin (IL)1β, an activator of NFκB. This negative modulation was abolished by neutralizing IL1β in APAP-CM or silencing p65-NFκB in hepatocytes. APAP-CM of macrophages from SIRT1-Tg mice failed to downregulate SIRT1 protein levels in hepatocytes. In vivo administration of the NFκB inhibitor BAY 11-7082 preserved SIRT1 levels and protected from APAP-mediated hepatotoxicity.

Innovation: Our work evidenced the unique role of SIRT1 in APAP hepatoprotection by targeting oxidative stress and inflammation.

Conclusion: SIRT1 protein levels are downregulated by IL1β/NFκB signaling in APAP hepatotoxicity, resulting in inflammation and oxidative stress. Thus, maintenance of SIRT1 during APAP overdose by inhibiting NFκB might be clinically relevant. Rebound Track: This work was rejected during standard peer review and rescued by Rebound Peer Review (Antioxid Redox Signal 16:293-296, 2012) with the following serving as open reviewers: Rafael de Cabo, Joaquim Ros, Kalervo Hiltunen, and Neil Kaplowitz. Antioxid. Redox Signal. 28, 1187-1208.

Keywords: SIRT1; antioxidant defense; hepatotoxicity; inflammation; interleukin 1β; oxidative stress; paracetamol.


Conflict of interest statement

No competing financial interests exist.

Figures

FIG. 1.
FIG. 1.
SIRT1 levels are decreased in the liver of humans and mice on acute APAP treatment. (A) Representative anti-SIRT1 immunostaining in human liver sections from five individuals with severe APAP intoxication that required liver transplantation and from a healthy individual as control. Scale bars = 100 μm. (B) SIRT1 protein levels in liver extracts from wild-type mice i.p. injected 300 mg/kg APAP or saline for 3 or 6 h. Graph depicts SIRT1 densitometric quantification. After quantification of all blots, results are expressed as fold change relative to the saline-injected condition and are mean ± SEM. Statistical analysis was performed by one-way ANOVA followed by Bonferroni post hoc test. *p < 0.05 versus saline-injected mice. n = 5–6 mice per group. (C) Overnight fasted mice were i.p. injected physiological saline (vehicle) or 300 mg/kg APAP. After 6 h, mice were sacrificed. Liver sections were stained against SIRT1 protein. Scale bars = 100 μm. ANOVA, analysis of variance; APAP, acetaminophen; i.p., intraperitoneal; SEM, standard error of the mean; SIRT1, sirtuin 1. To see this illustration in color, the reader is referred to the web version of this article at www.liebertpub.com/ars
FIG. 2.
FIG. 2.
Mice with moderate overexpression of SIRT1 are more resistant to liver damage during acute APAP treatment. Overnight fasted wild-type (SIRT1-WT) and mice overexpressing SIRT1 (SIRT1-Tg) were i.p. injected physiological saline (vehicle) or 300 mg/kg APAP. Mice were sacrificed after 3, 6, or 24 h, as indicated, and livers and serum were collected. (A) Left panels, SIRT1 protein levels detected in liver extracts derived from SIRT1-WT or SIRT1-Tg mice sacrificed before APAP or vehicle injection. Blots were quantified and results are expressed as fold change relative to SIRT1-WT mice. Values are mean ± SEM. ***p < 0.001 versus SIRT1-WT mice according to Student's t-test. n = 5 mice per genotype. Right panels, Immunoblots showing SIRT1 protein levels in liver extracts from SIRT1-WT and SIRT1-Tg mice treated with APAP or saline for 6 h. α-Tubulin was used as loading control. Densitometric quantification depicts SIRT1 protein levels in each condition. After quantification of all blots, results are expressed as fold change relative to the vehicle-injected condition and are mean ± SEM. Statistical analysis was performed by one-way ANOVA followed by Bonferroni post hoc test. ***p < 0.001 versus each vehicle-injected control. ###p < 0.001 versus APAP-injected SIRTI-WT mice. n = 6–8 mice per group. (B) Images of hematoxylin and eosin staining of liver sections from wild-type and SIRT1-Tg mice treated with APAP or saline for the indicated times. Scale bars = 200 μm. n = 5 mice per group. (C) Plasma ALT levels measured in the same experimental conditions. Values are mean ± SEM. Statistical analysis was performed by one-way ANOVA followed by Bonferroni post hoc test. ***p < 0.001 versus control (vehicle) condition. ##p < 0.01, ###p < 0.001 versus SIRT1-WT mice. n = 6–8 mice per group. (D) Images of TUNEL staining and quantification of TUNEL-positive cells analyzed 24 h after APAP injection. Scale bars: 100 μm. Values are mean ± SEM. Statistical analysis was performed by one-way ANOVA followed by Bonferroni post hoc test. *p < 0.05, ***p < 0.001 versus control (vehicle) condition. ###p < 0.001 versus SIRT1-WT. n = 5 mice per group. ALT, alanine transaminase. To see this illustration in color, the reader is referred to the web version of this article at www.liebertpub.com/ars
FIG. 3.
FIG. 3.
Moderate overexpression of SIRT1 contributes to reduction in oxidative stress by improving the antioxidant capacity during APAP treatment. Overnight fasted SIRT1-WT and SIRT1-Tg mice were i.p. injected physiological saline (vehicle) or 300 mg/kg APAP and sacrificed after the indicated times. (A) GSH/GSSG ratio, protein carbonyl content, and APAP-Cys adducts were analyzed in livers from SIRT1-WT and SIRT1-Tg mice treated with APAP for 6 and 24 h. Values are mean ± SEM. Statistical analysis was performed by one-way ANOVA followed by Bonferroni post hoc test. **p < 0.01, ***p < 0.001 versus each control (vehicle) condition. ##p < 0.01, ###p < 0.001 versus SIRT1-WT mice. n = 6–8 mice per group. (B) Immunoblot analysis of catalase and MnSOD levels in total liver extracts from SIRT1-WT and SIRT1-Tg mice 6 h after APAP injection. p85α was used as a loading control. After quantification of all blots, results are expressed as fold change relative to the saline-injected condition and are mean ± SEM. Statistical analysis was performed by one-way ANOVA followed by Bonferroni post hoc test. **p < 0.01, ***p < 0.001 versus vehicle-injected mice. #p < 0.05, ##p < 0.01 versus SIRT1-WT mice. n = 6–8 mice per group. (C) Nuclear levels of Sp1 are increased by APAP in wild-type mice and this effect was attenuated in SIRT1-Tg mice. Representative immunoblots showing nuclear Sp1 and Lamin B as a loading control. After quantification of all blots, results are expressed as fold change relative to vehicle condition and are mean ± SEM. Statistical analysis was performed by two-way ANOVA followed by Bonferroni post hoc test. **p < 0.01, ***p < 0.001 versus control (vehicle) condition. ##p < 0.01, ###p < 0.001 versus SIRT1-WT mice. n = 5–6 mice per group. GSH, glutathione; MnSOD, manganese superoxide dismutase; Sp1, specific protein 1.
FIG. 4.
FIG. 4.
SIRT1 overexpression modulates immune populations in the early stage of APAP toxicity. Overnight fasted SIRT1-WT and SIRT1-Tg mice were i.p. injected physiological saline (vehicle) or 300 mg/kg APAP. Mice were sacrificed after 3 or 6 h, as indicated, and NPCs were isolated and analyzed by flow cytometry. (A) Analysis of active resident macrophages 3 h after APAP injection (percentage of F4/80+CD11b+ cells pregated on CD45+ cells). Values are mean ± SEM. Statistical analysis was performed by one-way ANOVA followed by Bonferroni post hoc test. **p < 0.01 versus control (vehicle) condition. n = 6 mice per group. (B) Newly recruited monocytes 3 h after APAP injection (percentage of CCR2+Ly6C+ cells pregated on CD11b+ cells). Values are mean ± SEM. Statistical analysis was performed by one-way ANOVA followed by Bonferroni post hoc test. ***p < 0.001 versus control (vehicle) condition. #p < 0.05 versus SIRT1-WT mice. n = 6 mice per group. (C) Analysis of neutrophils (Ly6G+F4/80 cells on CD45+ pregated cells). *p < 0.05, ***p < 0.001 versus control (vehicle) condition. ###p < 0.001 versus SIRT1-WT mice. n = 6 mice per group. (D) Study of cytotoxic and noncytotoxic T lymphocytes (percentage of CD3+CD8+ or CD3+CD8 cells on CD45+ pregated cells, respectively). Values are mean ± SEM. Statistical analysis was performed by one-way ANOVA followed by Bonferroni post hoc test. **p < 0.01, ***p < 0.001 versus control (vehicle) condition. ##p < 0.01, ###p < 0.001 versus SIRT1-WT mice. n = 6–8 mice per group. To see this illustration in color, the reader is referred to the web version of this article at www.liebertpub.com/ars
FIG. 5.
FIG. 5.
SIRT1-Tg mice were protected against the elevation of circulating and hepatic proinflammatory cytokines and NFκB signaling pathway in APAP toxicity. Overnight fasted SIRT1-WT and SIRT1-Tg mice were i.p. injected physiological saline (vehicle) or 300 mg/kg APAP and sacrificed as indicated. (A) Plasma levels of IL6 and IL1β analyzed 6 h after APAP injection. Values are mean ± SEM. Statistical analysis was performed by one-way ANOVA followed by Bonferroni post hoc test. ***p < 0.001 versus control (vehicle) condition. ##p < 0.01 versus SIRT1-WT mice. n = 6–8 mice per group. (B) Il1b, Il6, IL10, and Arg1 mRNA levels determined by qRT-PCR 3 and 6 h after APAP injection. Values are mean ± SEM. Statistical analysis was performed by one-way ANOVA followed by Bonferroni post hoc test. *p < 0.05, ***p < 0.001 versus control (vehicle) condition. ##p < 0.01, ###p < 0.001 versus SIRT1-WT mice. n = 6–8 mice per group. (C, D, E) Representative immunoblots showing (C) phospho-JNK, (D) IjBa, and (C, D) p85a-PI3K as a loading control and (E) nuclear p65-NFjB and Lamin B as a loading control. After quantification of all blots, results are expressed as fold change relative to control (vehicle) condition and are mean ± SEM. Statistical analysis was performed by two-way ANOVA followed by Bonferroni post hoc test. *p < 0.05, **p < 0.01, ***p < 0.001 versus control (vehicle) condition. ###p < 0.001 versus SIRT1-WT mice. n = 5–6 mice per group. IκBα, inhibitor of kappa B alpha; IL, interleukin; JNK, c-Jun N-terminal kinase; mRNA, messenger RNA; NFκB, nuclear factor kappa B; qRT-PCR, quantitative real-time PCR.
FIG. 6.
FIG. 6.
CM from APAP-treated macrophages decreased SIRT1 protein levels in hepatocytes. (A) Hepatocytes were treated 16 h with conditioned media collected from RAW 264.7 cells treated with vehicle or 5 mM APAP for 8 h and then reefed with fresh medium for a further 16 h (control-CM or APAP-CM, respectively). Representative immunoblots showing SIRT1 and α-Tubulin (loading control) protein levels (left). After quantification of all blots, results are expressed as fold change relative to control-CM condition (right). Values are mean ± SEM. ***p < 0.001 versus control-CM according to Student's t-test. (B) Hepatocytes were treated with APAP (0.5 and 1 mM) for 16 h. Representative immunoblot showing SIRT1 and α-Tubulin (loading control) protein levels (left). After quantification of all blots, results are expressed as fold change relative to vehicle condition (right). Values are mean ± SEM. (C) Hepatocytes were treated with control-CM or APAP-CM for 16 h, as indicated (A). PGC1α was immunoprecipitated with anti-PGC1α antibody or protein A agarose as a negative control. Immunoblot against anti-Acetil-Lys represents acetylated PGC1α protein levels. Total α-Tubulin was analyzed in the SUP-IP as a loading protein control. (D) Hepatocytes were treated with APAP-CM for the indicated times in the presence of the proteasome inhibitor MG132 (10 μM) and then the levels of ubiquitinated SIRT1 were analyzed by immunoprecipitation (upper blot). Total SIRT1 protein detected in the WCL is shown in the lower blot. APAP-CM, conditioned medium of APAP-treated macrophages; PGC1α, peroxisome proliferator-activated receptor (PPAR) gamma coactivator 1 alpha; SUP-IP, IP-supernatant; WCL, whole-cell lysate.
FIG. 7.
FIG. 7.
Role of IL1β in the modulation of SIRT1 expression in hepatocytes treated with APAP. (A) Left panel, Il1b, Il6, and Tnfa mRNA levels were determined by qRT-PCR in RAW 264.7 cells stimulated with vehicle or 5 mM APAP for 8 h. Values are mean ± SEM. ***p < 0.001 versus vehicle according to Student's t-test. Right panel, Media from RAW 264.7 cells treated with vehicle or 5 mM APAP for 8 h were collected, and then, IL1β protein levels were measured. After quantification of all blots, results are expressed as fold change relative to control-CM condition. Values are mean ± SEM. *p < 0.05 versus vehicle according to Student's t-test. (B) Immunoblots showing the active fragment of caspase-1 (p10) detected in RAW 264.7 macrophages stimulated with APAP (5 mM) for 4 h and α-Tubulin showing that similar amounts of protein were loaded in each lane. Representative blots are shown. After quantification of all blots, results are expressed as fold change relative to vehicle condition and are mean ± SEM. **p < 0.01 versus vehicle according to Student's t-test. (C) Upper panels, SIRT1 levels detected in protein extracts from primary mouse (left) or human (right) hepatocytes treated with or without IL1β (20 ng/mL) for 16 h. Densitometric quantifications of protein levels are shown. After quantification of all blots, results are expressed as fold change relative to untreated condition. Values are mean ± SEM. *p < 0.05, ***p < 0.001 versus without IL1β condition according to Student's t-test. Lower panels, Mouse hepatocytes were treated with IL1β (20 ng/mL) for the indicated times, and then, the levels of nuclear p65-NFκB and total IκBα were analyzed by immunoblot. Lamin B and β-Actin were used as nuclear and total protein loading controls, respectively. After quantification of all blots, results are expressed as fold change relative to untreated condition and are mean ± SEM. Statistical analysis was performed by one-way ANOVA followed by Newman–Keuls multiple comparison test. **p < 0.01, ***p < 0.001 versus without IL1β. (D) Primary mouse hepatocytes were transfected with siRNAs for p65, JNK1/2, or both or with a control scrambled siRNA for 48 h. Then, hepatocytes were treated with control-CM or APAP-CM for 16 h in the presence of siRNAs. Total protein was analyzed by Western blot using the indicated antibodies. Densitometric quantification depicts SIRT1 protein levels in each condition. Values are mean ± SEM. Statistical analysis was performed by two-way ANOVA followed by Bonferroni post hoc test. ***p < 0.001 versus scramble siRNA-transfected hepatocytes treated with control-CM. (E) Control-CM, APAP-CM, and APAP-CM, previously incubated with anti-IL1β neutralizing antibody (0.2 μg/mL) for 1 h, were added to mouse hepatocytes for 16 h, and then, SIRT1 protein levels were analyzed by immunoblot. After quantification of all blots, results are expressed as fold change relative to control-CM condition. Values are mean ± SEM. Statistical analysis was performed by one-way ANOVA followed by Newman–Keuls multiple comparison test. ***p < 0.001 versus control-CM. #p < 0.05 versus without anti-IL1β neutralizing antibody condition. siRNA, small interfering RNA.
FIG. 8.
FIG. 8.
Effect of APAP-CM from peritoneal macrophages from wild-type and SIRT1-Tg mice in the modulation of SIRT1 protein levels in hepatocytes. (A) Peritoneal macrophages were isolated from SIRT1-WT and SIRT1-Tg mice and then used to prepare control-CM or APAP-CM as previously described. Then, mouse hepatocytes were treated with these CM for 16 h. Immunoblots showing SIRT1 protein levels and α-Tubulin as a loading control. Densitometric quantification showing SIRT1 protein levels in each condition. Values are mean ± SEM. Statistical analysis was performed by two-way ANOVA followed by Bonferroni post hoc test. *p < 0.05 versus control-CM. (B) Levels of the active fragment of caspase-1 (p10) detected in peritoneal macrophages derived from SIRT1-WT and SIRT1-Tg mice stimulated with APAP (5 mM) for 3 or 6 h. GAPDH showing similar amounts of protein loaded in each lane. Representative blots are shown. After quantification of all blots, results are expressed as fold change relative to vehicle-treated SIRT1-WT macrophages and are mean ± SEM. Statistical analysis was performed by two-way ANOVA followed by Bonferroni post hoc test. *p < 0.05 versus wild-type macrophages. GAPDH, glyceraldehyde-3-phosphate dehydrogenase.
FIG. 9.
FIG. 9.
In vivo administration of the NFκB inhibitor BAY 11-7082 protected from APAP-mediated acute hepatotoxicity. Overnight fasted wild-type mice were i.p. injected physiological saline (vehicle) or 300 mg/kg APAP or BAY 11-7082 (5 mg/kg) 1 h prior APAP intoxication. Mice were sacrificed after 6 h and livers and serum were collected. (A) Nuclear p65-NFκB and Lamin B as loading control. Blots were quantified and results are expressed as fold change relative to vehicle (saline)-treated mice. Values are mean ± SEM. Statistical analysis was performed by one-way ANOVA followed by Newman–Keuls test. *p < 0.05 versus control (vehicle)-treated mice, #p < 0.05 versus APAP-treated mice. n = 5 mice per group. (B) Representative images of hematoxylin and eosin staining (upper panels) or anti-SIRT1 immunostaining (lower panels) in liver sections from wild-type mice treated with APAP or injected BAY 11-7082 1 h prior APAP intoxication. Scale bars = 100 μm. (C) Plasma ALT levels measured in the same experimental conditions. Values are mean ± SEM. Statistical analysis was performed by one-way ANOVA followed by Bonferroni post hoc test. **p < 0.01 versus control (vehicle)-treated mice, ##p < 0.01 versus APAP-treated mice. n = 5 mice per group. (D) SIRT1 protein levels detected in liver extracts. Blots were quantified and results are expressed as fold change relative to control (vehicle)-treated mice. Values are mean ± SEM. Statistical analysis was performed by one-way ANOVA followed by Bonferroni post hoc test. *p < 0.05 versus control (vehicle)-treated mice, ##p < 0.01 versus APAP-treated mice. n = 5 mice per group. (E) Overnight fasted wild-type mice were i.p. injected physiological saline (vehicle) or 300 mg/kg APAP or BAY 11-7082 (5 mg/kg) 1 h after APAP intoxication. Mice were sacrificed after 6 h and livers and serum were collected. Representative images of hematoxylin and eosin staining (upper panels) or anti-SIRT1 immunostaining (lower panels) in liver sections. Scale bars = 100 μm. (F) Plasma ALT levels measured in the same experimental conditions. Values are mean ± SEM. Statistical analysis was performed by one-way ANOVA followed by Bonferroni post hoc test. *p < 0.05 versus control (vehicle)-treated mice, #p < 0.05 versus APAP-treated mice. n = 5 mice per group. (G) SIRT1 protein levels detected in liver extracts. Blots were quantified and results are expressed as fold change relative to APAP-treated mice. Values are mean ± SEM. *p < 0.05 versus control (vehicle)-treated mice, ##p < 0.01 versus APAP-treated mice. n = 5 mice per group. H&E, hematoxylin and eosin. To see this illustration in color, the reader is referred to the web version of this article at www.liebertpub.com/ars
FIG. 10.
FIG. 10.
Model for the interplay between macrophages and hepatocytes in the context of APAP hepatotoxicity. Proposed model for the cross talk between macrophages and hepatocytes modulated by APAP and involving IL1β-mediated NFκB signaling and SIRT1 degradation in hepatocytes. To see this illustration in color, the reader is referred to the web version of this article at www.liebertpub.com/ars

Similar articles

Cited by

References

    1. Antoniades CG, Quaglia A, Taams LS, Mitry RR, Hussain M, Abeles R, Possamai LA, Bruce M, McPhail M, Starling C, Wagner B, Barnardo A, Pomplun S, Auzinger G, Bernal W, Heaton N, Vergani D, Thursz MR, and Wendon J. Source and characterization of hepatic macrophages in acetaminophen-induced acute liver failure in humans. Hepatology 56: 735–746, 2012. - PubMed
    1. Barbieri SS, Amadio P, Gianellini S, Tarantino E, Zacchi E, Veglia F, Howe LR, Weksler BB, Mussoni L, and Tremoli E. Cyclooxygenase-2-derived prostacyclin regulates arterial thrombus formation by suppressing tissue factor in a sirtuin-1-dependent-manner. Circulation 126: 1373–1384, 2012. - PubMed
    1. Blazka ME, Elwell MR, Holladay SD, Wilson RE, and Luster MI. Histopathology of acetaminophen-induced liver changes: role of interleukin 1 alpha and tumor necrosis factor alpha. Toxicol Pathol 24: 181–189, 1996. - PubMed
    1. Cavar I, Kelava T, Heinzel R, and Culo F. The role of prostacyclin in modifying acute hepatotoxicity of acetaminophen in mice. Coll Antropol 33(Suppl 2): 25–29, 2009. - PubMed
    1. Cover C, Liu J, Farhood A, Malle E, Waalkes MP, Bajt ML, and Jaeschke H. Pathophysiological role of the acute inflammatory response during acetaminophen hepatotoxicity. Toxicol Appl Pharmacol 216: 98–107, 2006. - PubMed

Publication types