. 2017 Oct 30;18(1):208.
doi: 10.1186/s13059-017-1344-6.

The fitness cost of mis-splicing is the main determinant of alternative splicing patterns

Affiliations

The fitness cost of mis-splicing is the main determinant of alternative splicing patterns

Baptiste Saudemont et al. Genome Biol. .

Abstract

Background: Most eukaryotic genes are subject to alternative splicing (AS), which may contribute to the production of protein variants or to the regulation of gene expression via nonsense-mediated messenger RNA (mRNA) decay (NMD). However, a fraction of splice variants might correspond to spurious transcripts and the question of the relative proportion of splicing errors to functional splice variants remains highly debated.

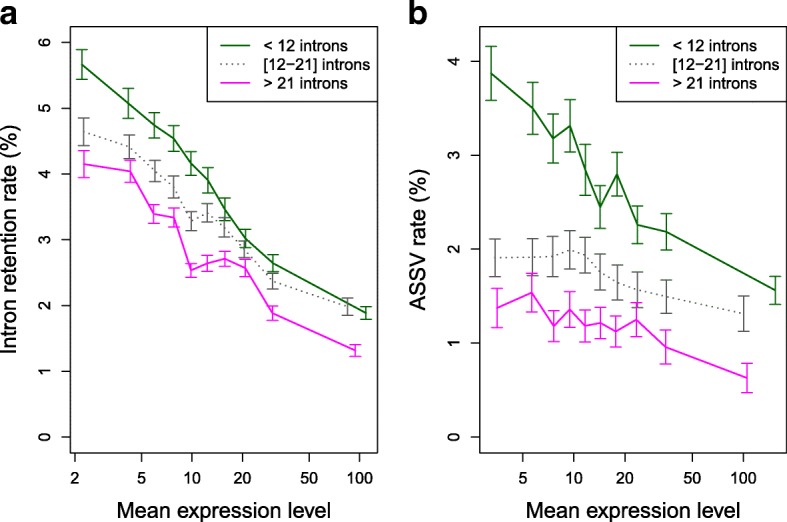
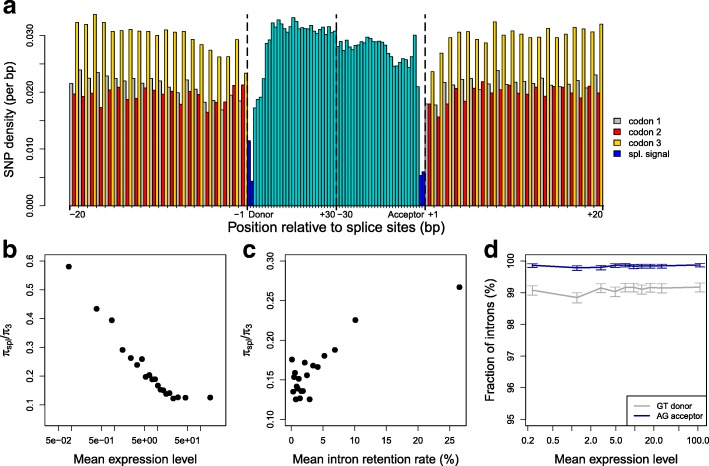
Results: We propose a test to quantify the fraction of AS events corresponding to errors. This test is based on the fact that the fitness cost of splicing errors increases with the number of introns in a gene and with expression level. We analyzed the transcriptome of the intron-rich eukaryote Paramecium tetraurelia. We show that in both normal and in NMD-deficient cells, AS rates strongly decrease with increasing expression level and with increasing number of introns. This relationship is observed for AS events that are detectable by NMD as well as for those that are not, which invalidates the hypothesis of a link with the regulation of gene expression. Our results show that in genes with a median expression level, 92-98% of observed splice variants correspond to errors. We observed the same patterns in human transcriptomes and we further show that AS rates correlate with the fitness cost of splicing errors.

Conclusions: These observations indicate that genes under weaker selective pressure accumulate more maladaptive substitutions and are more prone to splicing errors. Thus, to a large extent, patterns of gene expression variants simply reflect the balance between selection, mutation, and drift.

Keywords: Alternative splicing; Random genetic drift; Selectionist/neutralist debate.


Conflict of interest statement

Ethics approval and consent to participate

Not applicable.

Consent for publication

Not applicable.

Competing interests

The authors declare that they have no competing interests.

Publisher’s Note

Springer Nature remains neutral with regard to jurisdictional claims in published maps and institutional affiliations.

Figures

Fig. 1
Fig. 1
Introns and cryptic introns in P. tetraurelia. a Length distribution of introns (n = 65,159). b Length distribution of cryptic introns (n = 20,719 cryptic introns detected in wild-type or NMD-deficient cells). Introns and cryptic introns of length multiple of three (3n) or non-multiple of three (non-3n) are displayed in blue and red, respectively. c Quantification of splicing variation. For each intron, we identified all RNA-seq reads spanning both flanking exons and counted the number of reads corresponding to the canonical transcript (n1), to usage of 5′ or 3′ alternative splice sites (ASSV, n2), and to IR (n3). The IR rate is defined as n3/(n1 + n2 + n3), the ASSV rate is n2/(n1 + n2 + n3). Similarly, for potential cryptic introns (PCIs), the splice rate is defined as m2/(m1 + m2)
Fig. 2
Fig. 2
Impact of NMD on observed AS rates. AS events (IR or cryptic intron splicing) are classified into three groups according to their NMD-visibility: PTC-inducing events (i.e. NMD-visible); events that do not introduce frameshift or PTC (3n no PTC); events that create a frameshift but without introducing a PTC (non-3n no PTC). The two latter categories are not detectable by NMD. AS rates in WT and in NMD-deficient cells were computed globally within each bin, as the proportion of AS reads among all reads spanning introns (or PCIs) from that bin. Error bars represent the 95% confidence interval (CI) of this proportion. a IR (n = 65,159 introns). b Splicing of PCIs (n = 1,383,067 PCIs)
Fig. 3
Fig. 3
Relationship between AS rate and gene features: expression level, number of introns, or length of coding regions. Introns (n = 65,159) and PCIs (n = 1,383,067) were classified into ten bins of equal sample size, according to gene expression levels in WT cells. The AS rate was computed globally within each bin, as the proportion of AS reads among all reads spanning introns (or PCIs) from that bin. Error bars represent the 95% CI of this proportion. a IR rate. b ASSV rate. c Rate of splicing at potential cryptic introns. d, e same as (a, b), but introns were first classified into three bins, according to the number of introns of the gene in which they are located: genes with 1 intron (n = 5606 introns), genes with 2–3 introns (n = 24,452 introns), genes with > 3 introns (n = 35,101 introns). f Same as (c), but PCIs were first classified into three bins, according to the length of the coding region (CDS) in which they are located: CDS < 750 bp (n = 169,030 PCIs), CDS 750–1400 bp (n = 406,460 PCIs), CDS > 1400 bp (n = 807,577 PCIs). ac AS rates were measured in normal cells (WT, black line) and in NMD-deficient cells (dashed line). df AS rates were measured in NMD-deficient cells. Expression levels (RPKM) are represented in log scale
Fig. 4
Fig. 4
Relationship between AS rate and expression level, for NMD-visible or NMD-invisible AS events. a Introns were first classified into two groups according to their NMD-visibility in case of retention events (n = 52,163 NMD-visible introns, in red, and n = 12,996 NMD-invisible introns, in blue), and then further grouped into ten bins of equal sample size, according to gene expression levels in WT cells. IR rates (in WT cells) were measured globally in each bin. Error bars represent the 95% CI of the proportion of AS reads. b Same as (a), but for the splicing of PCIs: n = 882,579 NMD-visible PCIs and n = 500,488 NMD-invisible PCIs. Expression levels (RPKM) are represented in log scale
Fig. 5
Fig. 5
Relationship between AS rate, expression level, and number of introns in human genes. a IR rate (n = 118,703 introns). b ASSV rate (n = 102,697 introns). In both panels, introns were first classified into three groups of equal sample size, according to the number of introns of the genes in which they are located (genes with < 12 introns, genes with 12–21 introns, genes with > 21 introns), and then further grouped into ten bins of equal sample size, according to gene expression levels. We computed the average AS rate (IR or ASSV) over all introns within each bin. Error bars represent the 95% CI of the mean. Expression levels (RPKM, averaged over the 52 samples) are represented in log scale
Fig. 6
Fig. 6
Variation in selective constraints on splice signals in human genes. a SNP density was measured in the vicinity of exon-intron boundaries (first and last 30 bp of introns and 20 bp of flanking exons), over all introns located between coding exons (n = 170,015). Splice sites (first and last 2 bp of introns) are displayed in dark blue, other intron positions in light blue. Within coding regions, the SNP density at each site was computed separately for the three codon positions (gray: position 1, red: position 2, yellow: position 3). b The level of selective constraints on splice signals increases with gene expression level. Introns were classified into bins of equal sample size, according to gene expression levels. Within each bin, the fitness impact of mutations on splice sites was estimated by measuring the ratio πspl3, where πspl is the SNP density at splice sites and π3 is the SNP density at flanking third codon positions. c The level of selective constraints on splice signals decreases with increasing IR rate. Introns were classified into bins of equal sample size according to their average retention rate and the ratio πspl3 was measured in each bin. d The fraction of introns with consensus splice signals does not vary with gene expression level. The proportion of introns matching the consensus splice donor (GT) and the proportion of introns matching the consensus splice acceptor (AG) was computed for each bin of expression level. Error bars represent the 95% CI of this proportion. b, d Mean expression levels (RPKM) are represented in log scale

References

    1. Graveley BR. Alternative splicing: Increasing diversity in the proteomic world. Trends Genet. 2001;17:100–7. doi: 10.1016/S0168-9525(00)02176-4. - DOI - PubMed
    1. Nilsen TW, Graveley BR. Expansion of the eukaryotic proteome by alternative splicing. Nature. 2010;463:457–63. doi: 10.1038/nature08909. - DOI - PMC - PubMed
    1. Blencowe BJ. Alternative splicing: new insights from global analyses. Cell. 2006;126:37–47. doi: 10.1016/j.cell.2006.06.023. - DOI - PubMed
    1. Kelemen O, Convertini P, Zhang Z, Wen Y, Shen M, Falaleeva M, et al. Function of alternative splicing. Gene. 2013;514:1–30. doi: 10.1016/j.gene.2012.07.083. - DOI - PMC - PubMed
    1. Graille M, Séraphin B. Surveillance pathways rescuing eukaryotic ribosomes lost in translation. Nat Rev Mol Cell Biol. 2012;13:727–35. doi: 10.1038/nrm3457. - DOI - PubMed

Publication types