

Determinants for Sustained Use of an Activity Tracker: Observational Study
- PMID: 29084709
- PMCID: PMC5695980
- DOI: 10.2196/mhealth.7311
Determinants for Sustained Use of an Activity Tracker: Observational Study
Abstract
Background: A lack of physical activity is considered to cause 6% of deaths globally. Feedback from wearables such as activity trackers has the potential to encourage daily physical activity. To date, little research is available on the natural development of adherence to activity trackers or on potential factors that predict which users manage to keep using their activity tracker during the first year (and thereby increasing the chance of healthy behavior change) and which users discontinue using their trackers after a short time.
Objective: The aim of this study was to identify the determinants for sustained use in the first year after purchase. Specifically, we look at the relative importance of demographic and socioeconomic, psychological, health-related, goal-related, technological, user experience-related, and social predictors of feedback device use. Furthermore, this study tests the effect of these predictors on physical activity.
Methods: A total of 711 participants from four urban areas in France received an activity tracker (Fitbit Zip) and gave permission to use their logged data. Participants filled out three Web-based questionnaires: at start, after 98 days, and after 232 days to measure the aforementioned determinants. Furthermore, for each participant, we collected activity data tracked by their Fitbit tracker for 320 days. We determined the relative importance of all included predictors by using Random Forest, a machine learning analysis technique.
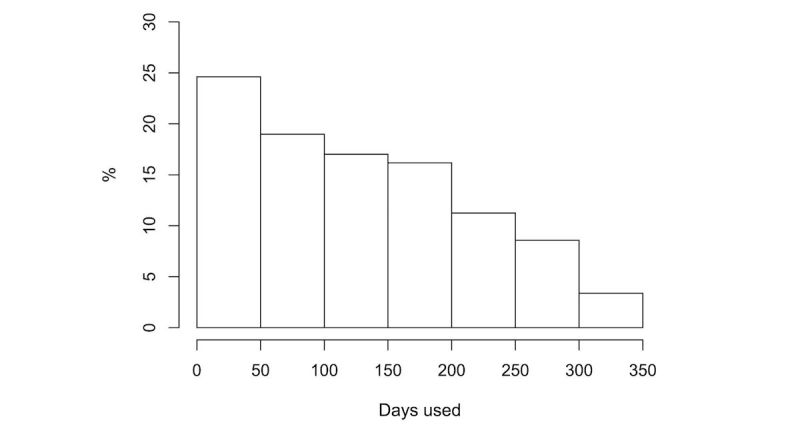
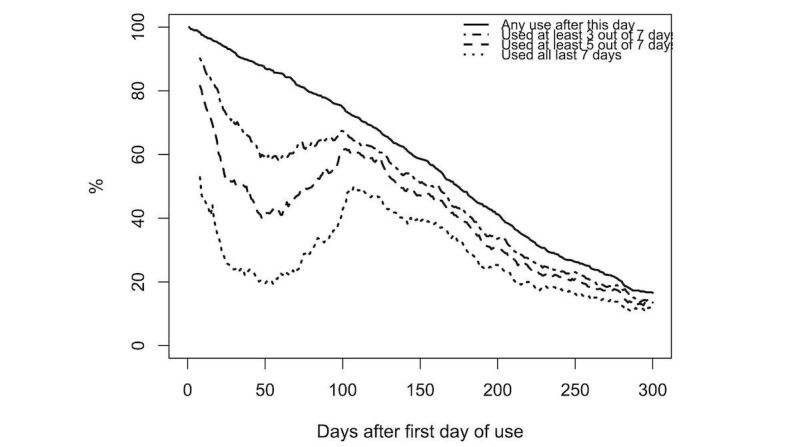
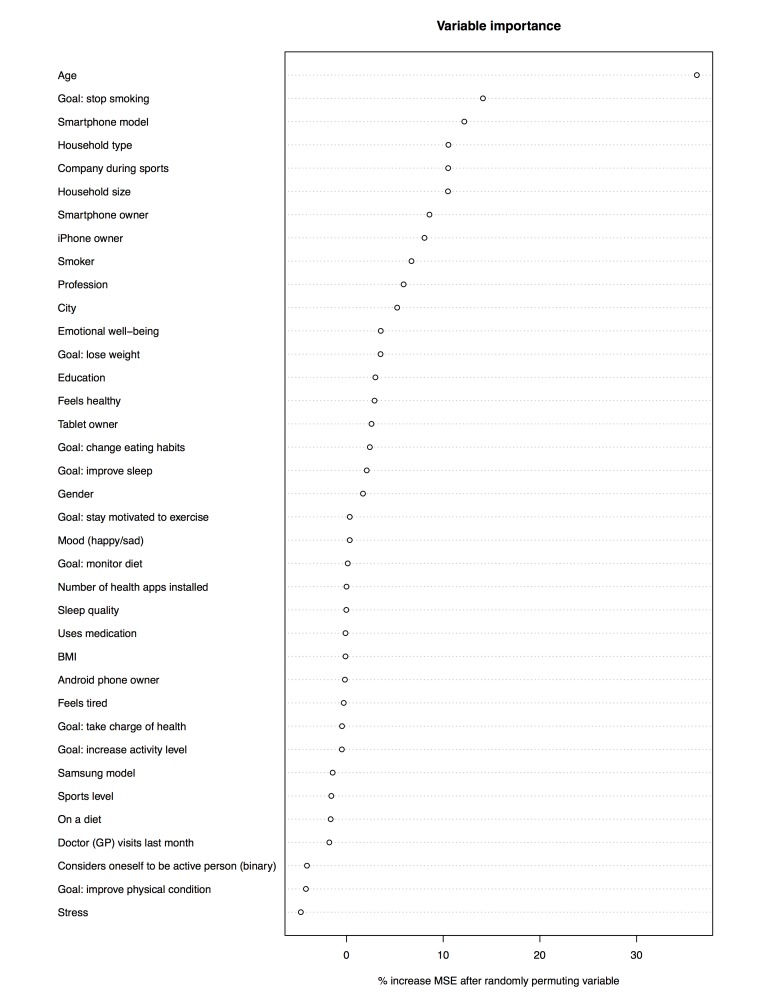
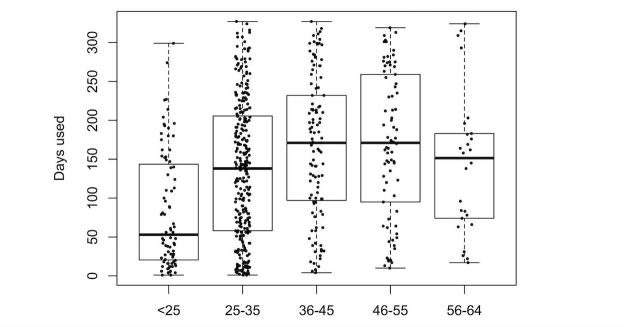
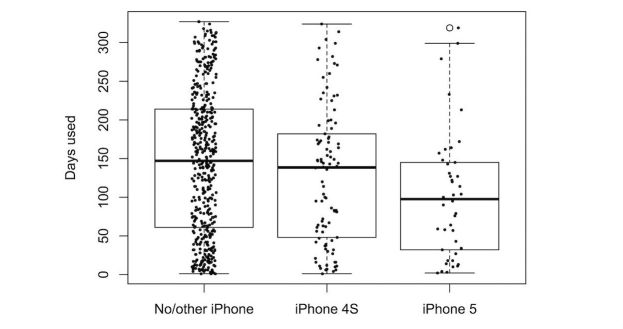
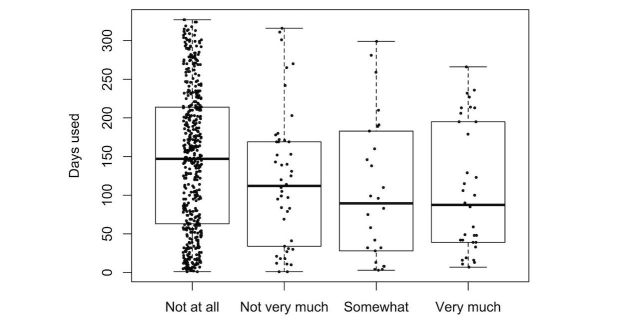
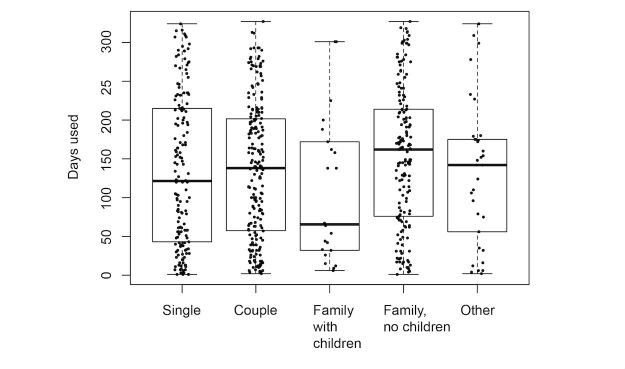
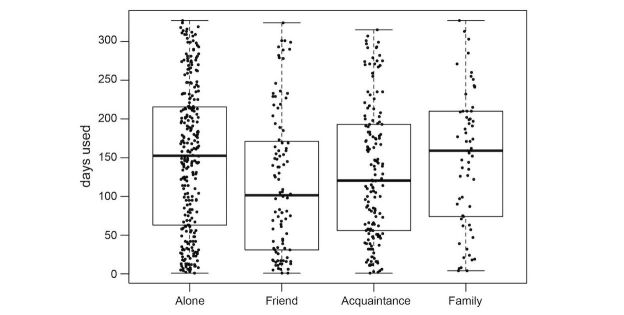
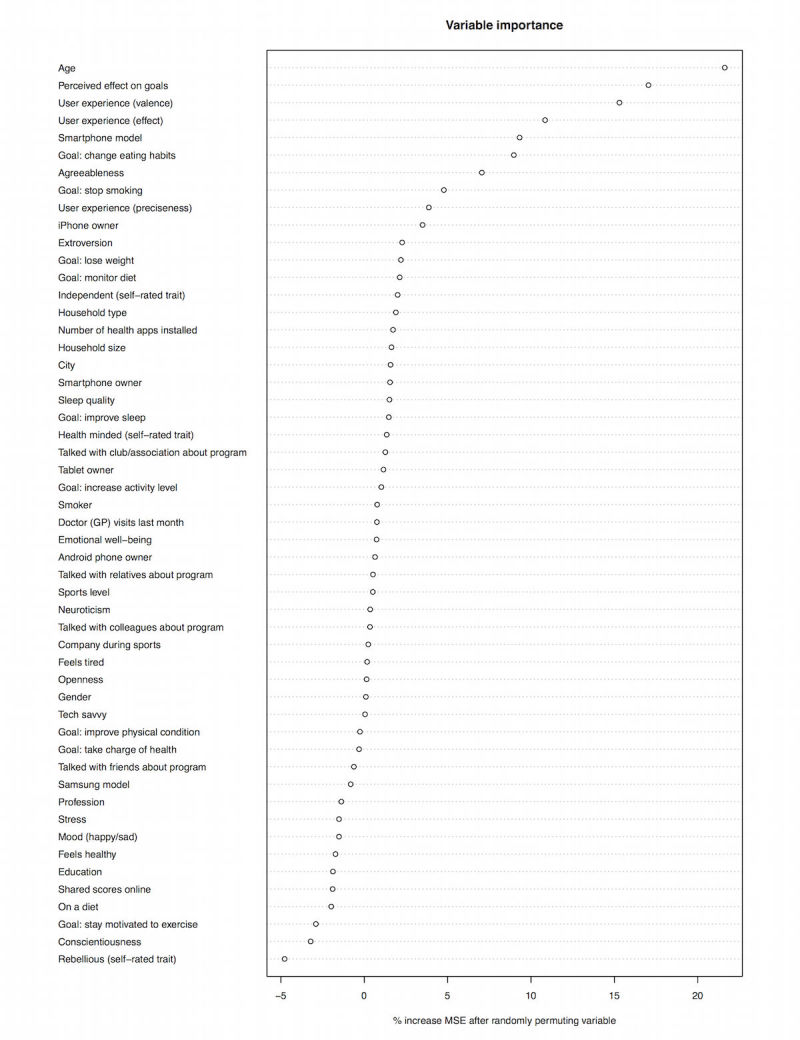
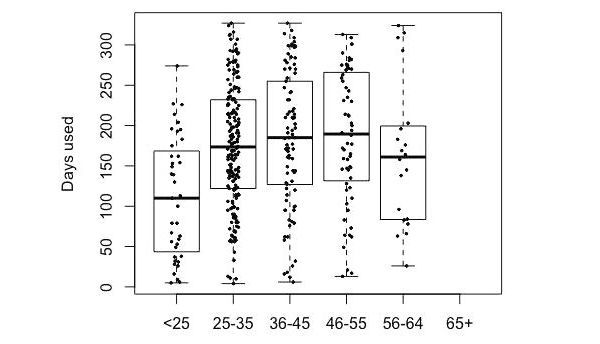
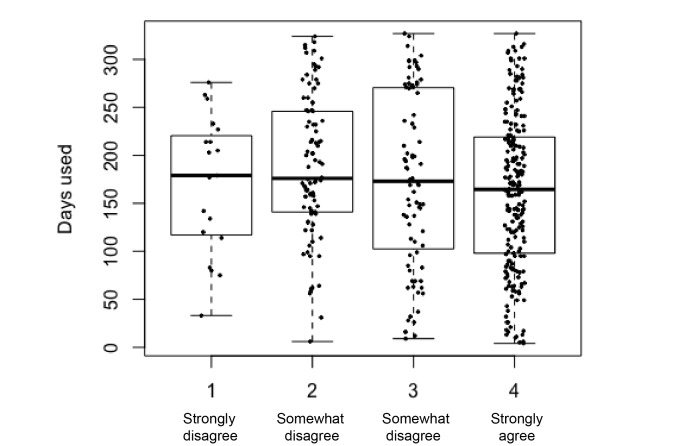
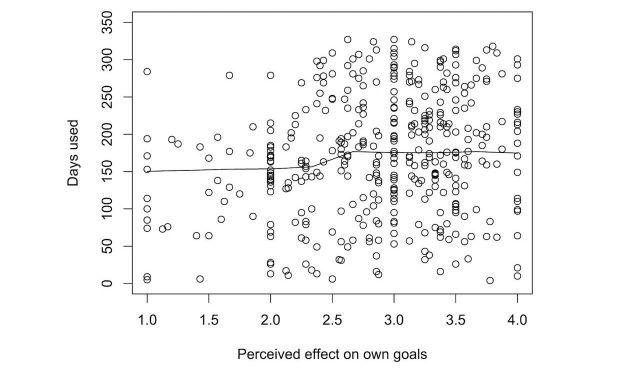
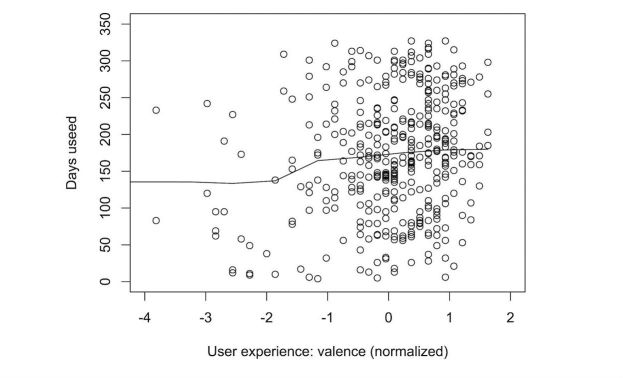
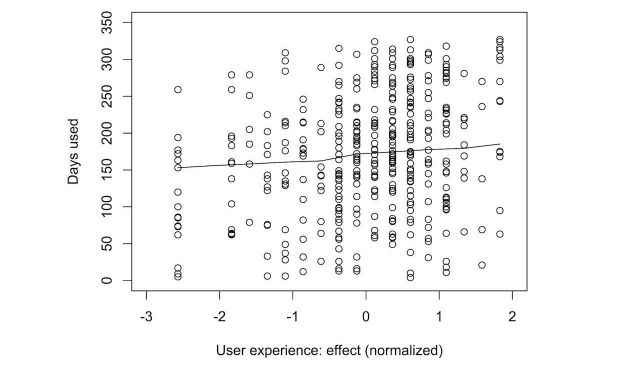
Results: The data showed a slow exponential decay in Fitbit use, with 73.9% (526/711) of participants still tracking after 100 days and 16.0% (114/711) of participants tracking after 320 days. On average, participants used the tracker for 129 days. Most important reasons to quit tracking were technical issues such as empty batteries and broken trackers or lost trackers (21.5% of all Q3 respondents, 130/601). Random Forest analysis of predictors revealed that the most influential determinants were age, user experience-related factors, mobile phone type, household type, perceived effect of the Fitbit tracker, and goal-related factors. We explore the role of those predictors that show meaningful differences in the number of days the tracker was worn.
Conclusions: This study offers an overview of the natural development of the use of an activity tracker, as well as the relative importance of a range of determinants from literature. Decay is exponential but slower than may be expected from existing literature. Many factors have a small contribution to sustained use. The most important determinants are technical condition, age, user experience, and goal-related factors. This finding suggests that activity tracking is potentially beneficial for a broad range of target groups, but more attention should be paid to technical and user experience-related aspects of activity trackers.
Keywords: habits; mHealth; machine learning; mobile health; physical activity.
©Sander Hermsen, Jonas Moons, Peter Kerkhof, Carina Wiekens, Martijn De Groot. Originally published in JMIR Mhealth and Uhealth (http://mhealth.jmir.org), 30.10.2017.
Conflict of interest statement
Conflicts of Interest: None declared.
Figures
References
-
- World Health Organization apps.who.int. 2010. [2016-12-13]. Global Database on Obesity http://apps.who.int/bmi/index.jsp?introPage=intro_3.html .
-
- Warburton DE, Nicol CW, Bredin SS. Health benefits of physical activity: the evidence. CMAJ. 2006 Mar 14;174(6):801–9. doi: 10.1503/cmaj.051351. http://www.cmaj.ca/cgi/pmidlookup?view=long&pmid=16534088 - DOI - PMC - PubMed
-
- Tudor-Locke C, Craig CL, Brown WJ, Clemes SA, De Cocker K, Giles-Corti B, Hatano Y, Inoue S, Matsudo SM, Mutrie N, Oppert JM, Rowe DA, Schmidt MD, Schofield GM, Spence JC, Teixeira PJ, Tully MA, Blair SN. How many steps/day are enough? For adults. Int J Behav Nutr Phys Act. 2011 Jul 28;8:79. doi: 10.1186/1479-5868-8-79. http://www.ijbnpa.org/content/8//79 - DOI - PMC - PubMed
-
- Lee I, Shiroma EJ, Lobelo F, Puska P, Blair SN, Katzmarzyk PT, Lancet Physical Activity Series Working Group Effect of physical inactivity on major non-communicable diseases worldwide: an analysis of burden of disease and life expectancy. Lancet. 2012 Jul 21;380(9838):219–29. doi: 10.1016/S0140-6736(12)61031-9. http://europepmc.org/abstract/MED/22818936 - DOI - PMC - PubMed
LinkOut - more resources
Full Text Sources
Other Literature Sources
