. 2018 Feb;176(2):1286-1298.
doi: 10.1104/pp.17.01002. Epub 2017 Oct 30.

Gene Regulation and Survival under Hypoxia Requires Starch Availability and Metabolism

Affiliations

Gene Regulation and Survival under Hypoxia Requires Starch Availability and Metabolism

Elena Loreti et al. Plant Physiol. 2018 Feb.

Abstract

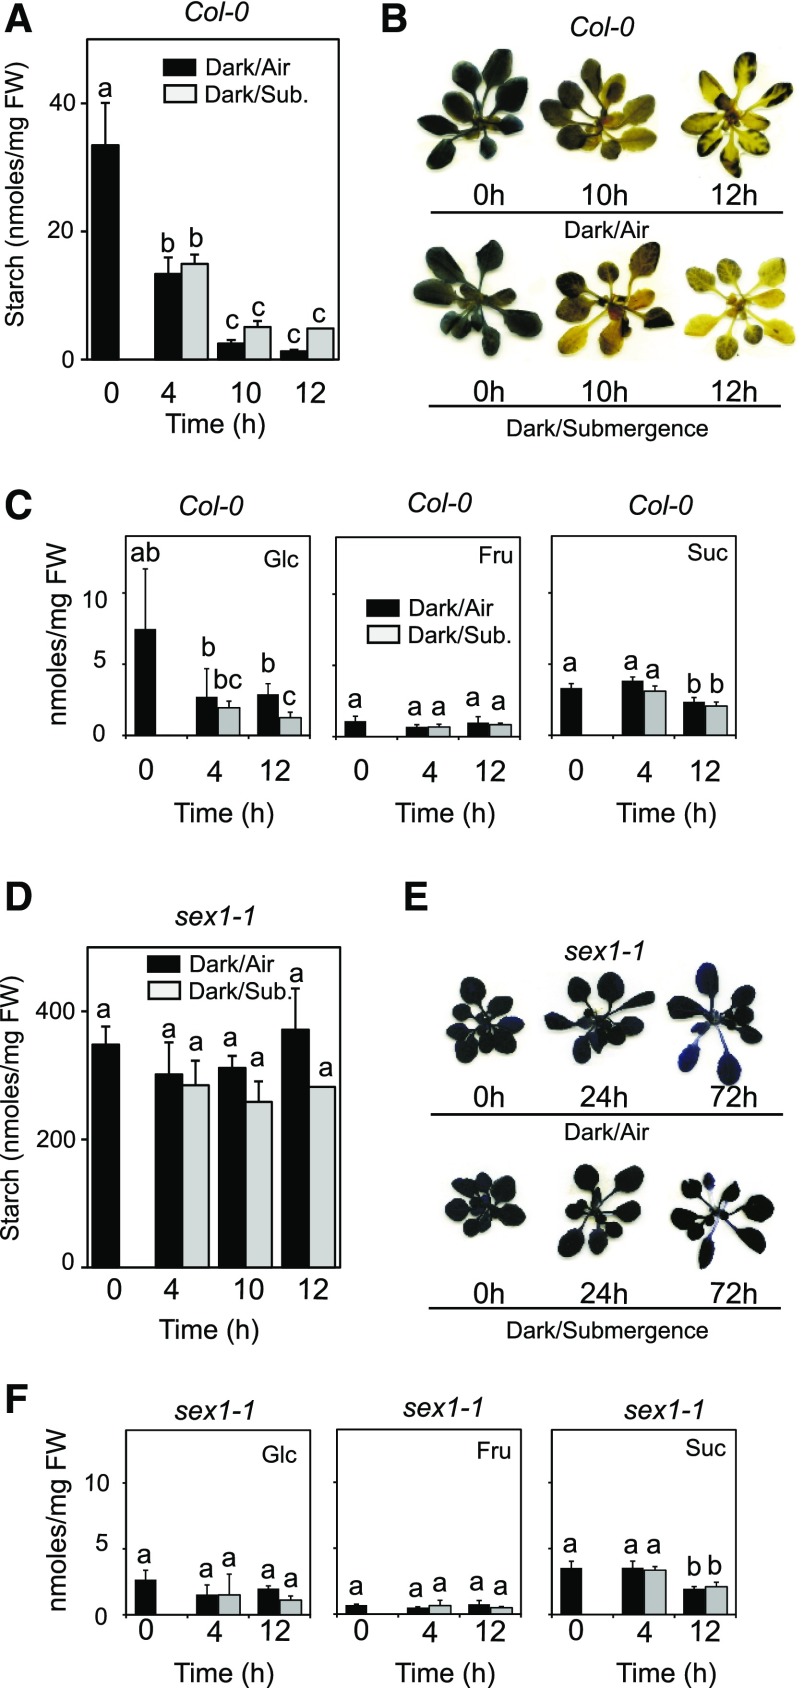
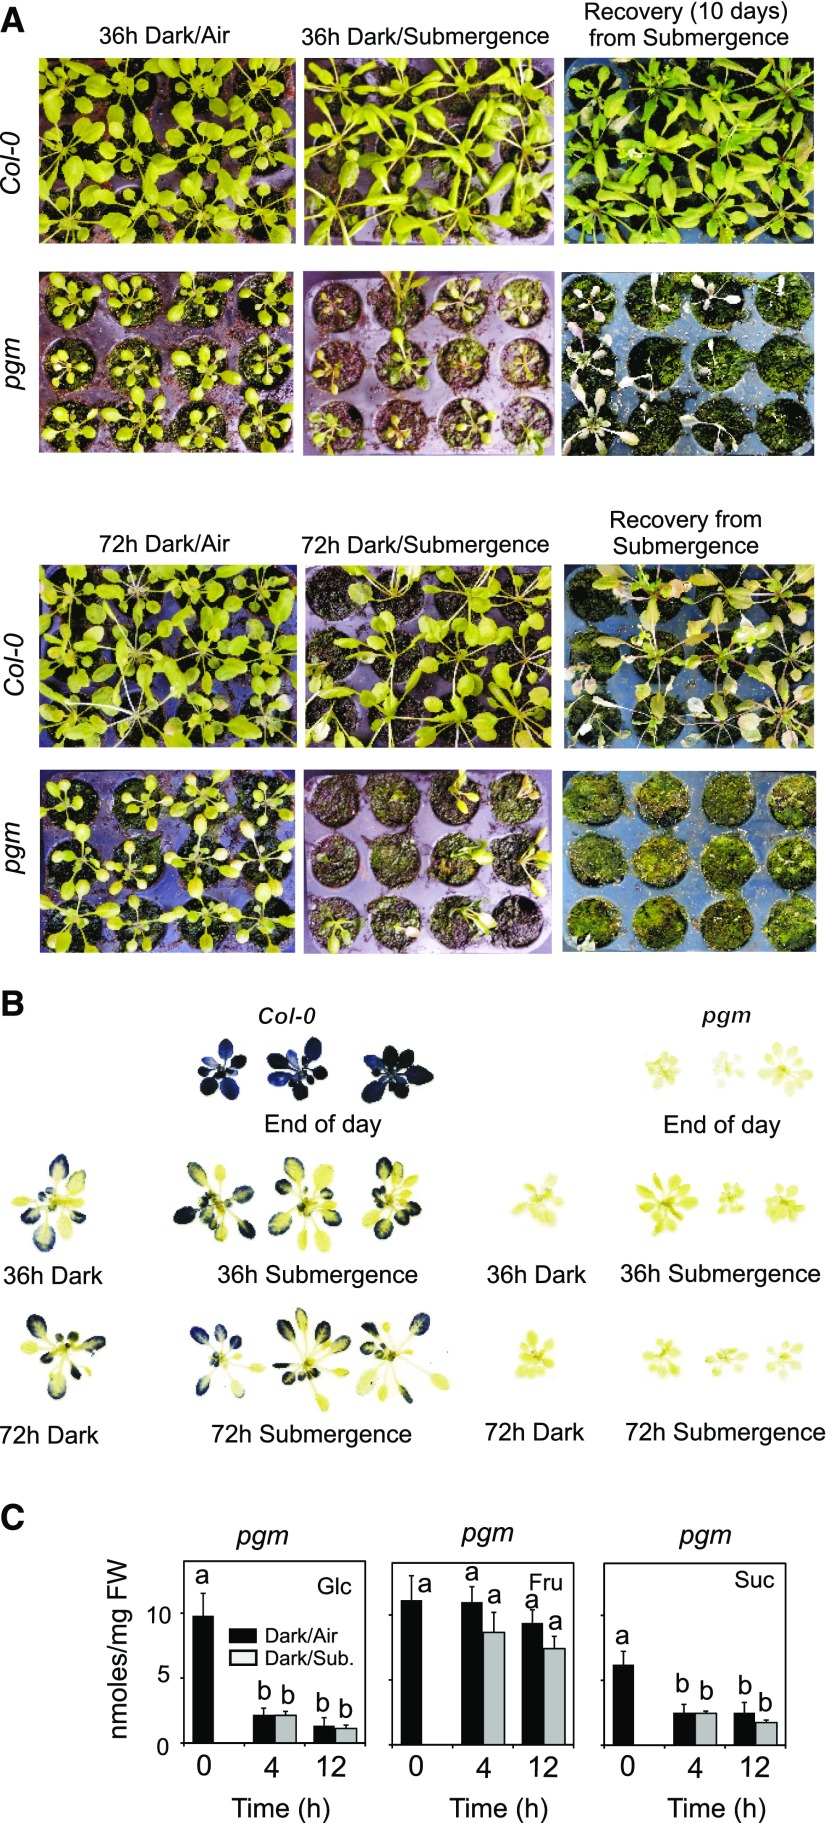
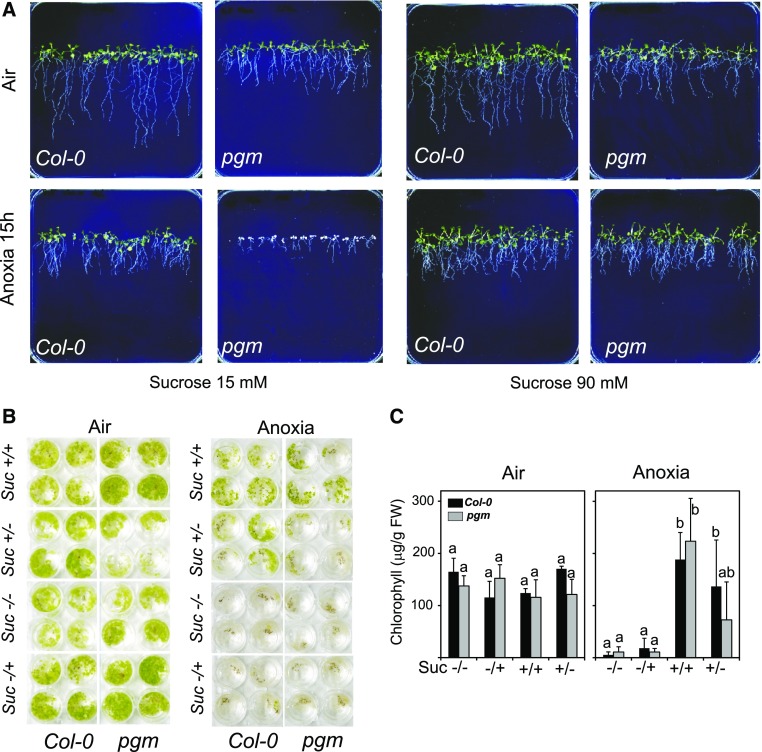
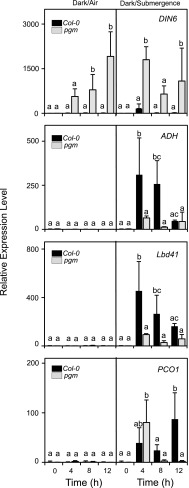
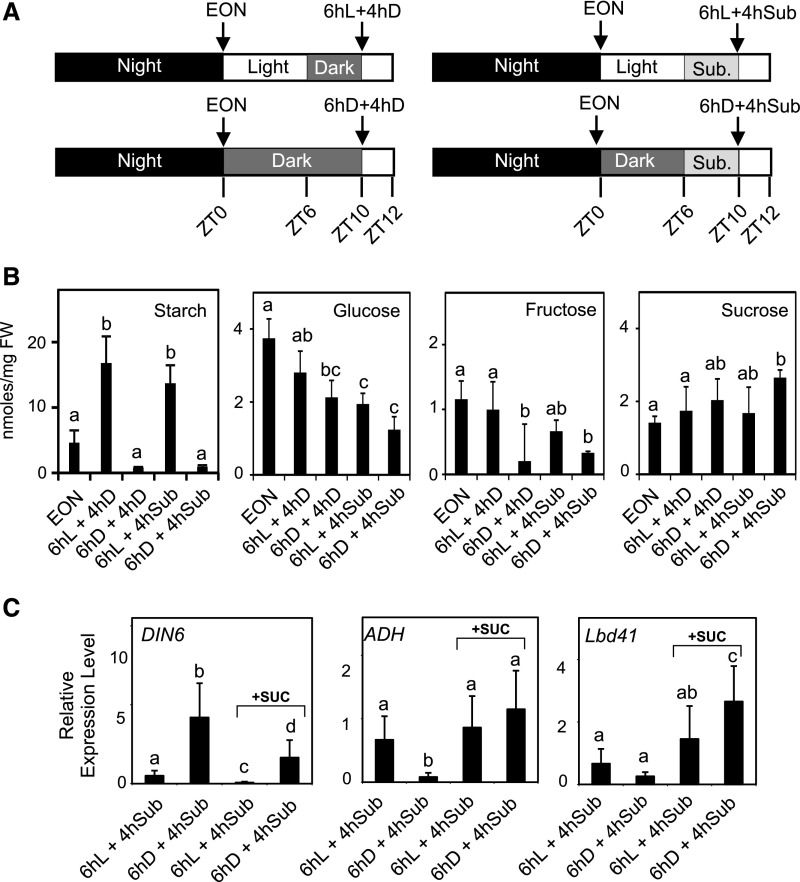
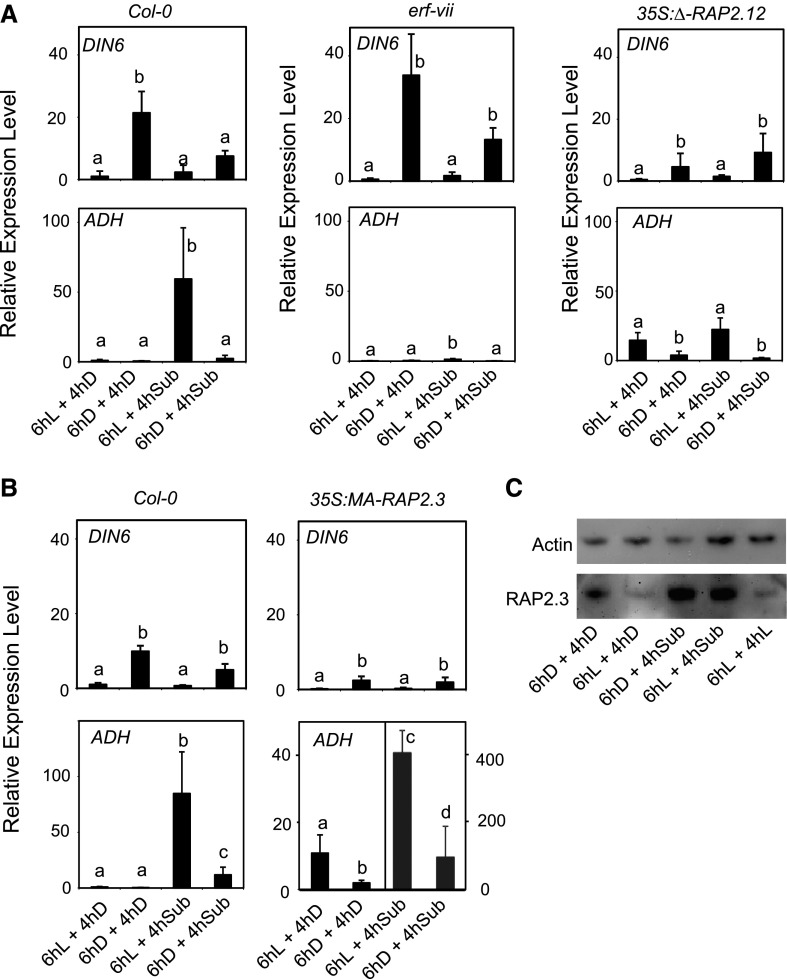
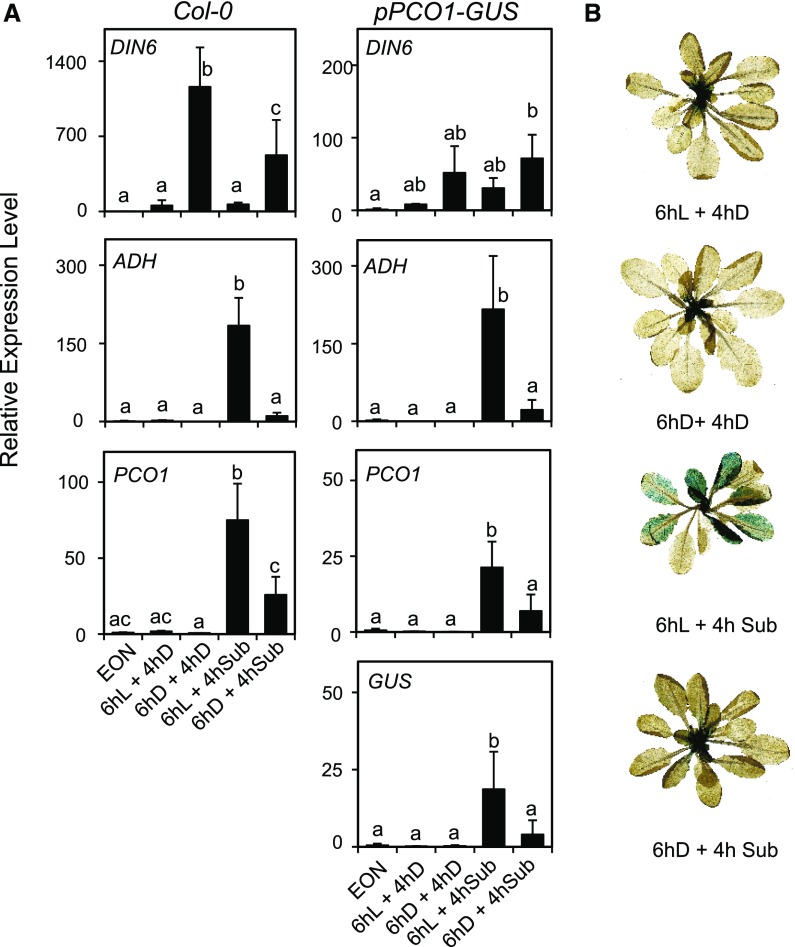
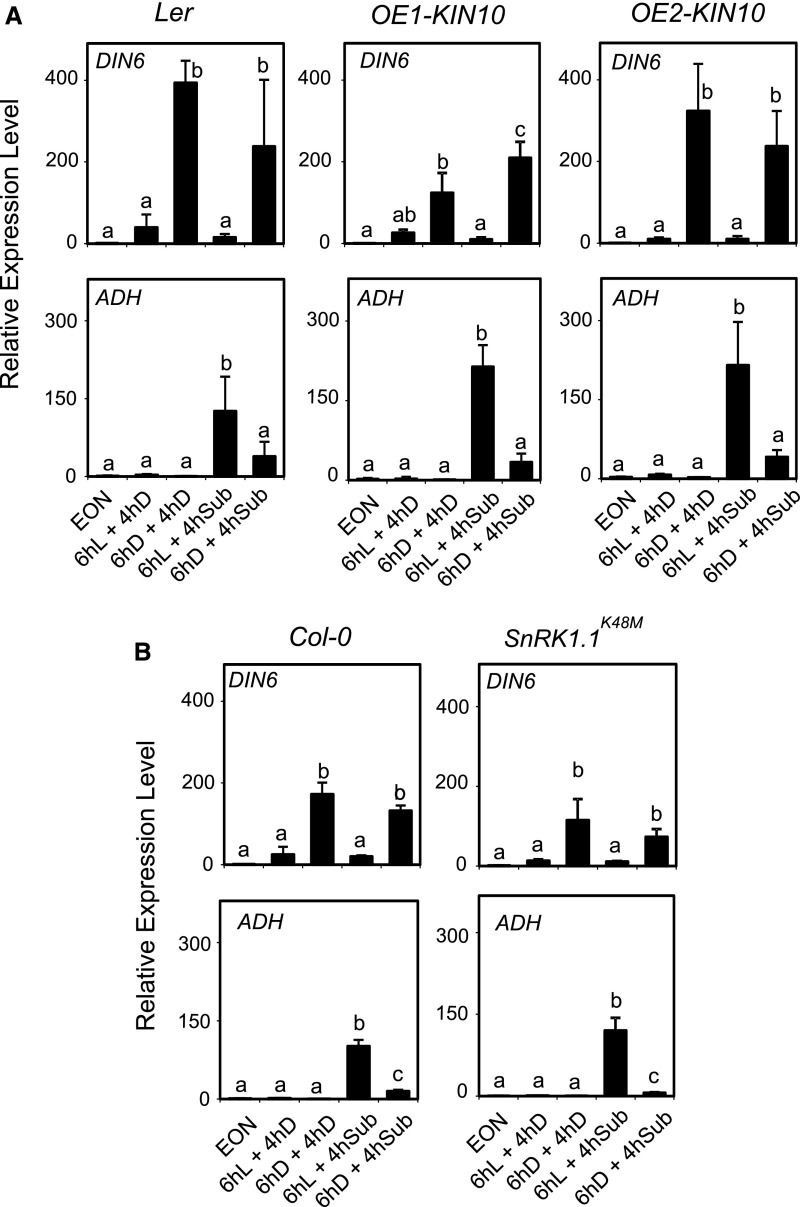
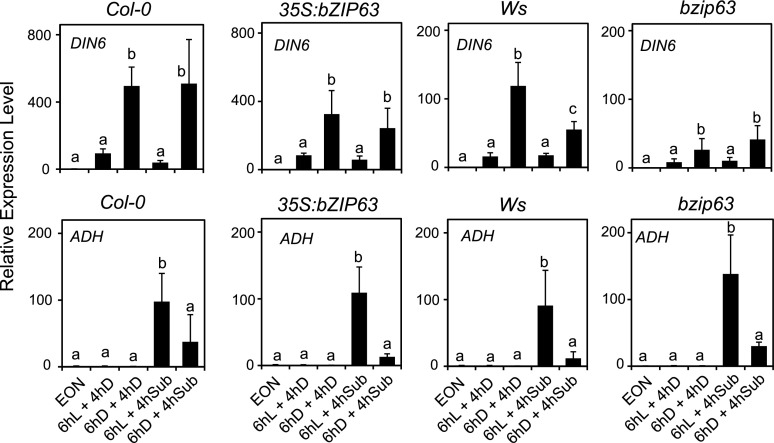
Plants respond to hypoxia, often caused by submergence, by expressing a specific set of genes that contribute to acclimation to this unfavorable environmental condition. Genes induced by low oxygen include those encoding enzymes for carbohydrate metabolism and fermentation, pathways that are required for survival. Sugar availability is therefore of crucial importance for energy production under hypoxia. Here, we show that Arabidopsis (Arabidopsis thaliana) plants require starch for surviving submergence as well as for ensuring the rapid induction of genes encoding enzymes required for anaerobic metabolism. The starchless pgm mutant is highly susceptible to submergence and also fails to induce anaerobic genes at the level of the wild type. Treating wild-type plants under conditions inducing sugar starvation results in a weak induction of alcohol dehydrogenase and other anaerobic genes. Induction of gene expression under hypoxia requires transcription factors belonging to group VII ethylene response factors (ERF-VII) that, together with plant Cys oxidases, act as an oxygen-sensing mechanism. We show that repression of this pathway by sugar starvation occurs downstream of the hypoxia-dependent stabilization of ERF-VII proteins and independently of the energy sensor protein kinases SnRK1.1 (SNF1-related kinase 1.1).


Figures

Figure 1.
Figure 1.
Starch degradation in submerged Arabidopsis plants. A, Quantitation of starch in rosette leaves of Arabidopsis Col-0 plants that were submerged at the end of the light period. Submergence was carried out in the dark; see Supplemental Figure S1 for oxygen content in the water. Data are mean ± sd of three biological replicates (ANOVA, P < 0.05). B, Iodine staining of starch in plants from the experiment described in A. C, Sugar content in rosette leaves of Arabidopsis plants that were submerged at the end of the light period. Submergence was carried out in the dark. Sugars were quantified at the end of the day (Time 0) and after 4 and 12 h of darkness/submergence. Data are mean ± sd of five biological replicates, n = 3 for sugars (ANOVA, P < 0.05). D, Quantitation of starch in rosette leaves of Arabidopsis sex1-1 mutant. Treatments are as in A. E, Iodine staining of starch in plants from the experiment described in D. F, Sugar content in rosette leaves of Arabidopsis sex1-1 plants (see C for details). Data are mean ± sd of five biological replicates for starch, n = 3 for sugars (ANOVA, P < 0.05).
Figure 2.
Figure 2.
Survival of Arabidopsis plants to submergence. A, Wild-type plants (Col-0) and pgm mutant plants were submerged for 36 and 72 h. The pictures, taken immediately after the submergence treatment or after recovery (10 d), show the consequences of the submergence treatment. B, Iodine staining of starch of plants that were submerged for 36 and 72 h. C, Sugar content in rosette leaves of Arabidopsis pgm plants that were submerged at the end of the light period. Submergence was carried out in the dark. Sugars were quantified at the end of the day (Time 0) and after 4 and 12 h of darkness/submergence. Data are mean ± sd of five biological replicates, n = 3 for sugars (ANOVA, P < 0.05).
Figure 3.
Figure 3.
Effects of exogenous Suc on the survival of Arabidopsis seedling. A, Seedlings (1 week old) of Arabidopsis grown on vertical agar plates were treated under anoxia for 15 h. Photographs were taken after 10 d of recovery. Suc was present in the plates at the concentrations shown in the figure. B, Seedlings were treated under anoxia for 22 h in the presence of Suc (30 mm) during anoxia in liquid medium and the subsequent 10 d of recovery in air (Suc +/+), during anoxia only (Suc +/−), during recovery in air (10 d) only (−/+), or in the absence of Suc (Suc −/−). C, Quantitation of chlorophyll in plants from the experiment described in B. Data are mean ± sd of three biological replicates (ANOVA, P < 0.05).
Figure 4.
Figure 4.
Expression level of sugar starvation and anaerobic genes in rosette leaves of Arabidopsis plants that were submerged at the end of the light period. Wild-type plants (Col-0) and plants of the pgm mutant were submerged for 12 h in the darkness or kept in the darkness in air. The mRNA level of genes was measured by RT-qPCR, and data are expressed as relative to the Time 0 of Col-0 (Time 0 = 1). Data are mean ± se of three biological replicates (ANOVA, P < 0.05).
Figure 5.
Figure 5.
Effect of submergence and darkness on carbohydrate content and effect of exogenous Suc on the induction of anaerobic genes. A, Schematic representation of the experimental set-up. B, Starch, Suc, Glc, and Fru content in Arabidopsis plants that were submerged after a 6-h treatment in the light or in the darkness. EON, end of night. Data are mean ± sd of three biological replicates (ANOVA, P < 0.05). C, Effect of exogenous Suc on the induction of starvation and anaerobic genes. Suc was applied by spraying (90 mm) the plants during the 6-h-long pretreatment (either in the light or darkness) and Suc was added to the water (45 mm) used to submerge the plants. Data are mean ± sd of three biological replicates (ANOVA, P < 0.05).
Figure 6.
Figure 6.
Induction of anaerobic genes requires ERF-VII genes but repression by extended night-induced starvation occurs downstream of ERF-VII stabilization by the N-end-rule. A, Wild-type plants (Col-0), the erf-vii mutant, and a transgenic line overexpressing a constitutively stable version of RAP.12 (35S:Δ-RAP2.12) were submerged (4 h) in the darkness or kept in the darkness in air after a pretreatment (6 h) either in the light or darkness. See Figure 5A for the experimental setup. The mRNA level was measured by RT-qPCR and data are expressed as relative to the 6hL+4hD sample of the Col-0 sample. Data are mean ± sd of three biological replicates (ANOVA, P < 0.05). B, same as in A, but using the 35S:MA-RAP2.3 line. C, Immunoblotting using an HA-tag antibody to measure the protein level of RAP2.3-HA. Plants of the 35S:RAP2.3-HA were treated as detailed in the figure. An α-actin antibody was used to verify the loading of protein on the electrophoresis.
Figure 7.
Figure 7.
Darkness-induced sugar starvation interferes with the activation of an anaerobic promoter. A, Wild-type plants (Col-0) and a transgenic lines having the GUS gene under the control of the PCO1 promoter (pPCO1:GUS) were submerged (4 h) in the darkness or kept in the darkness in air after a pretreatment (6 h) either in the light (L) or darkness (D). The mRNA level was measured by RT-qPCR and data are expressed as relative to the EON time point of each genotype. Data are mean ± sd of three biological replicates (ANOVA, P < 0.05). B, GUS staining of the pPCO1:GUS plants at the end of the treatment described in the figure.
Figure 8.
Figure 8.
Darkness-induced sugar starvation dampens the anaerobic response independently of KIN10. A, Wild-type plants (Col-0), the Ler genotype (background of the transgenic lines), and two lines overexpressing KIN10 were submerged (4 h) in the darkness or kept in the darkness in air after a pretreatment (6 h) either in the light (L) or darkness (D). EON, End of night time point. The mRNA levels are expressed as relative to the EON time point of each genotype. Data are mean ± sd (n = 3; ANOVA, P < 0.05). B, Wild-type plants (Col-0) and the dominant-negative SnRK1.1 mutant were treated as described in A. The mRNA levels are expressed as relative to the EON time point of each genotype. Data are mean ± sd (n = 3; ANOVA, P < 0.05).
Figure 9.
Figure 9.
Darkness-induced sugar starvation dampens the anaerobic response independently of bZIP63. Wild-type plants (Col-0), the bzip63 mutant, and a transgenic line overexpressing bZIP63 were treated as described in Figure 8. The mRNA levels are expressed as relative to the EON time point of each genotype. Data are mean ± sd (n = 3; ANOVA, P < 0.05).

References

    1. Abbas M, Berckhan S, Rooney DJ, Gibbs DJ, Vicente Conde J, Sousa Correia C, Bassel GW, Marín-de la Rosa N, León J, Alabadí D, Blázquez MA, Holdsworth MJ (2015) Oxygen sensing coordinates photomorphogenesis to facilitate seedling survival. Curr Biol 25: 1483–1488 - PMC - PubMed
    1. Arvidsson S, Kwasniewski M, Riaño-Pachón DM, Mueller-Roeber B (2008) QuantPrime--a flexible tool for reliable high-throughput primer design for quantitative PCR. BMC Bioinformatics 9: 465. - PMC - PubMed
    1. Baena-González E, Rolland F, Thevelein JM, Sheen J (2007) A central integrator of transcription networks in plant stress and energy signalling. Nature 448: 938–942 - PubMed
    1. Bailey-Serres J, Voesenek LACJ (2008) Flooding stress: acclimations and genetic diversity. Annu Rev Plant Biol 59: 313–339 - PubMed
    1. Bailey-Serres J, Fukao T, Gibbs DJ, Holdsworth MJ, Lee SC, Licausi F, Perata P, Voesenek LACJ, van Dongen JT (2012) Making sense of low oxygen sensing. Trends Plant Sci 17: 129–138 - PubMed

Publication types

MeSH terms

LinkOut - more resources